I’ve had a lot of help from people as I learned to code this report in Python and I’ve had some interest expressed in my report, so here it is, warts and all, for free use and modification or simply as code examples.
This has been my excuse and motivation to learn Python. It has evolved as I’ve learned and added new things, so it’s probably not a great example of how to write python code, but the bits that make it up might help someone else on their coding journey.
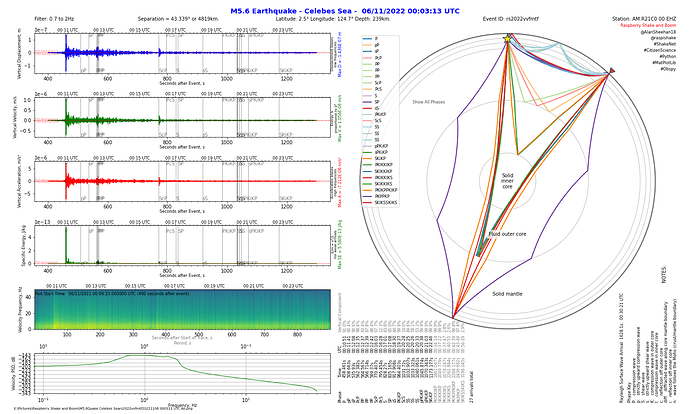
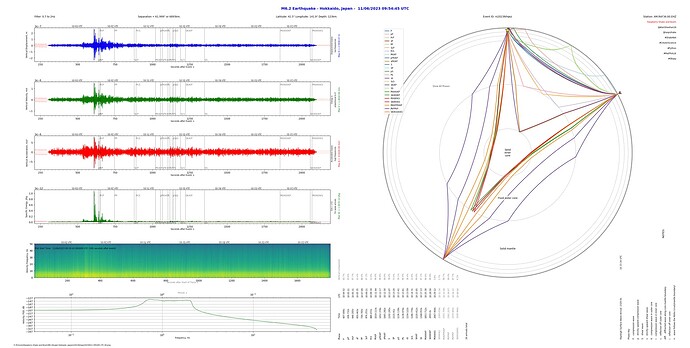
This is what the resulting report looks like:
That is with ‘All’ phases selected to display in the ray path plot.
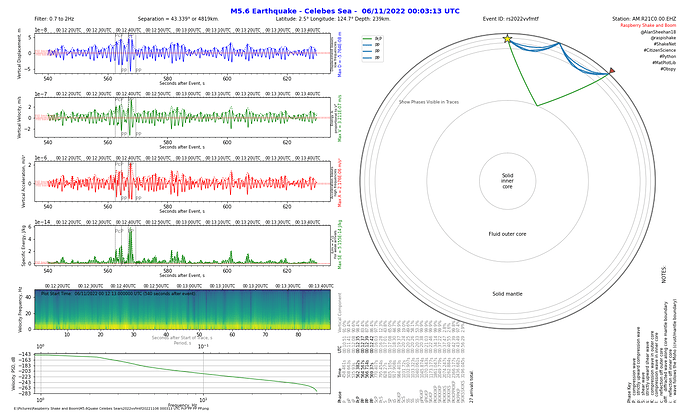
It can also look like this:
This is with only the phases that arrive in the time window of the displayed traces displayed in the ray path plot.
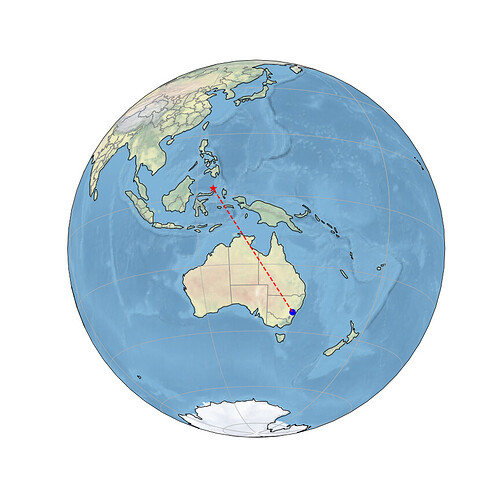
I have also recently added Cartopy, and the ability to produce a simple Nearside Perspective map to show the station and earthquake locations and the great circle path between, which looks like this:
Here is the code from my report:
from obspy.clients.fdsn import Client
from obspy.core import UTCDateTime
from obspy.signal import filter
import matplotlib.pyplot as plt
from matplotlib.ticker import AutoMinorLocator
import numpy as np
from obspy.taup import TauPyModel
import math
import cartopy.crs as ccrs
import cartopy.feature as cfeature
rs = Client('RASPISHAKE')

def plot_arrivals(ax):
    y1 = -1
    axb, axt = ax.get_ylim()               # calculate the y limits of the graph
    for q in range(0, no_arrs):            #plot each arrival in turn
        x1 = arrs[q].time              # extract the time to plot
        if (x1 >= delay):
            if x1 < delay+duration:
                ax.axvline(x=x1, linewidth=0.5, linestyle='--', color='black')      # draw a vertical line
                if y1 < 0 or y1 < axt/2:                      # alternate top and bottom for phase tags
                    y1 = axt*0.8
                else:
                    y1 = axb*0.95
                ax.text(x1,y1,arrs[q].name, alpha=0.5)                                 # print the phase name

def time2UTC(a):        #convert time (seconds) since event back to UTCDateTime
    return eventTime + a

def uTC2time(a):        #convert UTCDateTime to seconds since the event
    return a - eventTime

def one_over(a):            # 1/x to convert frequency to period
    #Vectorized 1/a, treating a==0 manually
    a = np.array(a).astype(float)
    near_zero = np.isclose(a, 0)
    a[near_zero] = np.inf
    a[~near_zero] = 1 / a[~near_zero]
    return a

inverse = one_over          #function 1/x is its own inverse

def plot_noiselims(ax, uplim, downlim):
    axl, axr = ax.get_xlim()
    ax.axhline(y=uplim, lw=0.33, color='r', linestyle='dotted')     #plot +1 SD
    ax.axhline(y=uplim*2, lw=0.33, color='r', linestyle='dotted')     #plot +2 SD
    ax.axhline(y=uplim*3, lw=0.33, color='r', linestyle='dotted')     #plot upper background noise limit +3SD
    ax.axhline(y=downlim, lw=0.33, color='r', linestyle='dotted')   #plot -1 SD
    ax.axhline(y=downlim*2, lw=0.33, color='r', linestyle='dotted')   #plot -2SD
    ax.axhline(y=downlim*3, lw=0.33, color='r', linestyle='dotted')   #plot lower background noise limit -3SD
    ax.text(axl, uplim*3,'3SD background', size='xx-small', color='r',alpha=0.5, ha='left', va='bottom')
    ax.text(axl, downlim*3, '-3SD background', size='xx-small', color='r', alpha=0.5, ha='left', va='top')

def plot_se_noiselims(ax, uplim):
    axl, axr = ax.get_xlim()
    ax.axhline(y=uplim, lw=0.33, color='r', linestyle='dotted')     #plot +1 SD
    ax.axhline(y=uplim*2*2, lw=0.33, color='r', linestyle='dotted')     #plot +2 SD
    ax.axhline(y=uplim*3*3, lw=0.33, color='r', linestyle='dotted')     #plot upper background noise limit +3SD
    ax.axhline(y=0, lw=0.33, color='r', linestyle='dotted')         #plot 0 limit in case data has no zero
    ax.text(axl, uplim*3*3,'3SD background', size='xx-small', color='r',alpha=0.5, ha='left', va='bottom')

def divTrace(tr, n):            #divide trace into n equal parts for background noise determination
    return tr.__div__(n)

# set the station name and download the response information
stn = 'R21C0'                            # your station name
inv = rs.get_stations(network='AM', station=stn, level='RESP')  # get the instrument response
latS = -33.7691     #station latitude
lonS = 149.8843     #station longitude
eleS = 1114         #station elevation

#enter event data
eventTime = UTCDateTime(2022, 11, 6, 0, 3, 26) # (YYYY, m, d, H, M, S) **** Enter data****
latE = 3.7                           # quake latitude + N -S **** Enter data****
lonE = 123.2                          # quake longitude + E - W **** Enter data****
depth = 500                             # quake depth, km **** Enter data****
mag = 5.2                              # quake magnitude **** Enter data****
eventID = 'rs2022vvfmxs'               # ID for the event **** Enter data****
locE = "Celebes Sea"                # location name **** Enter data****

#set plot s29tart time
delay = 120                     # delay the start of the plot from the event **** Enter data****
duration = 900                  # duration of plots **** Enter data****
start = eventTime + delay       # calculate the plot start time from the event and delay
end = start + duration               # calculate the end time from the start and duration

#set background noise sample times (choose a section of minimum velocity amplitude to represent background noise)
bnstart = eventTime - 900                 # enter time of start of background noise sample (default = 0) **** Enter data****
bnend = eventTime + 600               # enter time of end of background noise sample (default = 600) **** Enter data****

# bandpass filter - select to suit system noise and range of quake
filt = [0.7, 0.7, 2, 2.1]       #distant quake
#filt = [0.7, 0.7, 6, 6.1]
#filt = [0.7, 0.7, 8, 8.1]
#filt = [1, 1, 10, 10.1]
#filt = [1, 1, 20, 20.1]        #use for local quakes

# set the FDSN server location and channel names
ch = 'EHZ' # ENx = accelerometer channels; EHx or SHZ = geophone channels

# get waveform and copy it for independent removal of instrument response
trace0 = rs.get_waveforms('AM', stn, '00', ch, start, end)
trace0.merge(method=0, fill_value='latest')         #fill in any gaps in the data to prevent a crash
trace0.detrend(type='demean')                       #demean the data
trace1 = trace0.copy()
trace2 = trace0.copy()

#get waveform for background noise and copy it for independent removal of instrument response
bn0 = rs.get_waveforms('AM', stn, '00', ch, bnstart, bnend)
bn0.merge(method=0, fill_value='latest')         #fill in any gaps in the data to prevent a crash
bn0.detrend(type='demean')                       #demean the data
bn1 = bn0.copy()
bn2 = bn0.copy()

# calculate great circle angle of separation
# convert angles to radians
latSrad = math.radians(latS)
lonSrad = math.radians(lonS)
latErad = math.radians(latE)
lonErad = math.radians(lonE)

if lonSrad > lonErad:
    lon_diff = lonSrad - lonErad
else:
    lon_diff = lonErad - lonSrad

great_angle_rad = math.acos(math.sin(latErad)*math.sin(latSrad)+math.cos(latErad)*math.cos(latSrad)*math.cos(lon_diff))
great_angle_deg = math.degrees(great_angle_rad)     #great circle angle between quake and station
distance = great_angle_rad*12742/2      #calculate distance between quake and station in km

#Calculate the Phase Arrivals
model = TauPyModel(model='iasp91')
arrs = model.get_travel_times(depth, great_angle_deg)
print(arrs)             # print the arrivals for reference when setting delay and duration
no_arrs = len(arrs)     # the number of arrivals

#calculate Rayleigh Wave arrival Time
rayt = distance/2.96

# Create output traces
outdisp = trace0.remove_response(inventory=inv,pre_filt=filt,output='DISP',water_level=60, plot=False) # convert to Disp
outvel = trace1.remove_response(inventory=inv,pre_filt=filt,output='VEL',water_level=60, plot=False) # convert to Vel
outacc = trace2.remove_response(inventory=inv,pre_filt=filt,output='ACC',water_level=60, plot=False) # convert to Acc

#Calculate maximums
disp_max = outdisp[0].max()
vel_max = outvel[0].max()
acc_max = outacc[0].max()
se_max = vel_max*vel_max/2

#Create background noise traces
bndisp = bn0.remove_response(inventory=inv,pre_filt=filt,output='DISP',water_level=60, plot=False) # convert to Disp
bnvel = bn1.remove_response(inventory=inv,pre_filt=filt,output='VEL',water_level=60, plot=False) # convert to Vel
bnacc = bn2.remove_response(inventory=inv,pre_filt=filt,output='ACC',water_level=60, plot=False) # convert to Acc

# Calculate background noise limits using standard deviation
bns = int((bnend - bnstart)/15)         #calculate the number of 15s samples in the background noise traces
bnd = divTrace(bndisp[0],bns)           #divide the displacement background noise trace into equal traces
bnv = divTrace(bnvel[0],bns)            #divide the velocity background noise trace into equal traces
bna = divTrace(bnacc[0],bns)            #divide the acceleration background noise trace into equal traces
for j in range (0, bns):                #find the sample interval with the minimum background noise amplitude
    if j == 0:
        bndispstd = abs(bnd[j].std())
        bnvelstd = abs(bnv[j].std())
        bnaccstd = abs(bna[j].std())
    elif abs(bnd[j].std()) < bndispstd:
        bndispmax = abs(bnd[0].max())
    elif abs(bnv[j].std()) < bnvelstd:
        bnvelstd = abs(bnv[j].std())
    elif abs(bna[j].max()) < bnaccstd:
        bnaccstd = abs(bna[j].std())
bnsestd = bnvelstd*bnvelstd/2           #calculate the max background noise level for the specific energy

# Create Signal Envelopes
disp_env = filter.envelope(outdisp[0].data)     #create displacement envelope
vel_env = filter.envelope(outvel[0].data)       #create velocity envelope
acc_env = filter.envelope(outacc[0].data)       #create acceleration envelope
#se_env=filter.envelope(outvel[0].data*outvel[0].data/2) #create specific energy envelope - comment out undesired method.
se_env=vel_env*vel_env/2                        #create specific energy envelope from velocity envelope! - comment out undesired method.

#plot map
plot_map = True
if plot_map:
    latC = (latE+latS)/2        #latitude 1/2 way between station and event/earthquake - may need adjusting!
    lonC = (lonE+lonS)/2        #longitude 1/2 way between station and event/earthquake - may need adjusting!
    if abs(lonE-lonS) > 180:
        lonC = lonC + 180
    plt.figure(figsize=(12, 12))
    ax = plt.axes(projection=ccrs.NearsidePerspective(
                        central_latitude=latC,
                        central_longitude=lonC,
                        satellite_height=100000000.0))      #adjust satellite height to best display station and event/earthquake
    ax.coastlines(resolution='110m')
    ax.stock_img()
    # Create a feature for States/Admin 1 regions at 1:50m from Natural Earth to display state borders
    states_provinces = cfeature.NaturalEarthFeature(
        category='cultural',
        name='admin_1_states_provinces_lines',
        scale='50m',
        facecolor='none')
    ax.add_feature(states_provinces, edgecolor='gray')
    ax.gridlines()
    #plot station position on map
    plt.plot(lonS, latS,
         color='blue', marker='o', markersize=10,
         transform=ccrs.Geodetic(),
         )
    #plot event/earthquake position on map
    plt.plot(lonE, latE,
         color='red', marker='*', markersize=12,
         transform=ccrs.Geodetic(),
         )
    #plot dashed great circle line from event/earthquake to station
    plt.plot([lonS, lonE], [latS, latE],
         color='red', linewidth=2, linestyle='--',
         transform=ccrs.Geodetic(),
         )
    #plt.savefig('E:\Pictures\Raspberry Shake and Boom\M'+str(mag)+'Quake '+locE+eventID+eventTime.strftime('%Y%m%d %H%M%S UTC Map.png'))   #comment this out till map is right
    plt.show()
    plt.close()     #close this figure so the next one can be created

# set up plot
fig = plt.figure(figsize=(20,12))       # set to page size in inches
ax1 = fig.add_subplot(6,2,1)            # displacement waveform
ax2 = fig.add_subplot(6,2,3)            # velocity Waveform
ax3 = fig.add_subplot(6,2,5)            # acceleration waveform
ax6 = fig.add_subplot(6,2,7)            # specific energy waveform
ax4 = fig.add_subplot(6,2,9)            # velocity spectrogram
ax5 = fig.add_subplot(6,2,11)            # velocity PSD
ax7 = fig.add_subplot(6,2,(2,10), polar=True)       # TAUp plot
fig.suptitle("M"+str(mag)+" Earthquake - "+locE+" - "+eventTime.strftime(' %d/%m/%Y %H:%M:%S UTC'), weight='black', color='b', size='x-large')      #Title of the figure
fig.text(0.05, 0.95, "Filter: "+str(filt[1])+" to "+str(filt[2])+"Hz")          # Filter details
fig.text(0.2, 0.95, 'Separation = '+str(round(great_angle_deg,3))+u"\N{DEGREE SIGN}"+' or '+str(int(distance))+'km.')   #distance between quake and station
fig.text(0.4, 0.95, 'Latitude: '+str(latE)+u"\N{DEGREE SIGN}"+' Longitude: '+str(lonE)+u"\N{DEGREE SIGN}"+' Depth: '+str(depth)+'km.')  #quake lat, lon and depth
fig.text(0.7, 0.95, 'Event ID: '+eventID)
fig.text(0.98, 0.95, 'Station: AM.'+stn+'.00.'+ch, ha='right')
fig.text(0.98, 0.935, 'Raspberry Shake and Boom', color='r', ha='right', size='small')
fig.text(0.98, 0.92, '@AlanSheehan18', ha='right', size='small')
fig.text(0.98, 0.905, '@raspishake', ha='right', size='small')
fig.text(0.98, 0.89, '#ShakeNet', ha='right', size='small')
fig.text(0.98, 0.875, '#CitizenScience', ha='right', size='small')
fig.text(0.98, 0.86, '#Python', ha='right', size='small')
fig.text(0.98, 0.845, '#MatPlotLib', ha='right', size='small')
fig.text(0.98, 0.83, '#Obspy', ha='right', size='small')
fig.text(0.96, 0.32, 'NOTES: ', rotation=90)                 # add any notes about the report **** Enter data****
fig.text(0.97, 0.32, '', rotation=90)                 # add any notes about the report **** Enter data****
fig.text(0.98, 0.32, '', rotation=90)                 # add any notes about the report **** Enter data****
fig.text(0.48, 0.715, 'Energy is', size='x-small',rotation=90, va='center')
fig.text(0.485, 0.715, 'proportional to V²', size='x-small',rotation=90, va='center')
fig.text(0.48, 0.87, 'Displacement biases', size='x-small',rotation=90, va='center')
fig.text(0.485, 0.87, 'low frequencies', size='x-small',rotation=90, va='center')
fig.text(0.48, 0.56, 'Acceleration biases', size='x-small',rotation=90, va='center')
fig.text(0.485, 0.56, 'high frequencies', size='x-small',rotation=90, va='center')
fig.text(0.48, 0.41, 'E/m = v²/2', size='x-small',rotation=90, va='center')
fig.text(0.485, 0.41, 'For weak arrivals', size='x-small',rotation=90, va='center')
fig.text(0.49, 0.87, 'Max D = '+f"{disp_max:.3E}"+' m', size='small',rotation=90, va='center',color='b')
fig.text(0.49, 0.715, 'Max V = '+f"{vel_max:.3E}"+' m/s', size='small',rotation=90, va='center',color='g')
fig.text(0.49, 0.56, 'Max A = '+f"{acc_max:.3E}"+' m/s²', size='small',rotation=90, va='center',color='r')
fig.text(0.49, 0.41, 'Max SE = '+f"{se_max:.3E}"+' J/kg', size='small',rotation=90, va='center',color='g')

#plot traces
ax1.plot(trace0[0].times(reftime=eventTime), outdisp[0].data, lw=1, color='b')      # displacement waveform
ax1.xaxis.set_minor_locator(AutoMinorLocator(10))
#ax1.set_ylim(-2e-7,2e-7)         # set manual y limits for displacement- comment this out for autoscaling
ax2.plot(trace0[0].times(reftime=eventTime), outvel[0].data, lw=1, color='g')       # velocity Waveform
ax2.xaxis.set_minor_locator(AutoMinorLocator(10))
#ax2.set_ylim(-1e-7,1e-7)         # set manual y limits for velocity - comment this out for autoscaling
ax3.plot(trace0[0].times(reftime=eventTime), outacc[0].data, lw=1, color='r')       # acceleration waveform
ax3.xaxis.set_minor_locator(AutoMinorLocator(10))
#ax3.set_ylim(-1e-6,1e-6)         # set manual y limits for acceleration - comment this out for auto scaling
ax4.specgram(x=trace1[0], NFFT=32, noverlap=2, Fs=100, cmap='viridis')         # velocity spectrogram
ax4.xaxis.set_minor_locator(AutoMinorLocator(10))
#ax4.set_yscale('log')               # set logarithmic y scale - comment this out for linear scale
#ax4.set_ylim(0,10)
#ax4.set_ylim(0,filt[3])            # limit y axis to the filter range - comment this out for full 50Hz
ax5.psd(x=trace1[0], NFFT=duration, noverlap=0, Fs=100, color='g', lw=1)             # velocity PSD
ax5.set_xscale('log')               #use logarithmic scale on PSD
ax6.plot(trace0[0].times(reftime=eventTime), outvel[0].data*outvel[0].data/2, lw=1, color='g')  #specific Energy Waveform
ax6.xaxis.set_minor_locator(AutoMinorLocator(10))
#ax6.set_ylim(0,1e-14)         # set manual y limits for energy - comment this out for autoscaling

#plot background noise limits
plot_noiselims(ax1, bndispstd, -bndispstd)      #displacement noise limits - comment out if not desired
plot_noiselims(ax2, bnvelstd, -bnvelstd)        #velocity noise limits - comment out if not desired
plot_noiselims(ax3, bnaccstd, -bnaccstd)        #acceleration noise limits - comment out if not desired
plot_se_noiselims(ax6, bnsestd)                 #specific energy noise limits - comment out if not desired

# plot Signal envelopes
plot_envelopes = False
if plot_envelopes:
    ax1.plot(trace0[0].times(reftime=eventTime), disp_env, 'b:')    #displacement envelope
    ax2.plot(trace0[0].times(reftime=eventTime), vel_env, 'g:')     #velocity envelope
    ax3.plot(trace0[0].times(reftime=eventTime), acc_env, 'r:')     #acceleration envelope
    ax6.plot(trace0[0].times(reftime=eventTime), se_env, 'g:')      #specific energy envelope

#plot secondary axes - set time interval (dt) based on the duration to avoid crowding
if duration <= 90:
    dt=10           #10 seconds
elif duration <= 180:
    dt=20           #20 seconds
elif duration <= 270:
    dt=30           #30 seconds
elif duration <= 540:
    dt=60           #1 minute
elif duration <= 1080:
    dt=120          #2 minutes
elif duration <= 2160:
    dt=240          #4 minutes
else:
    dt=300          #5 minutes
tbase = start - start.second +(int(start.second/dt)+1)*dt       #find the first time tick
tlabels = []            #initialise a blank array of time labels
tticks = []             #initialise a blank array of time ticks
sticks = []           #initialise a blank array for spectrogram ticks
nticks = int(duration/dt)       #calculate the number of ticks
for k in range (0, nticks):
    if dt >= 60:                #build the array of time labels - include UTC to eliminate the axis label
        tlabels.append((tbase+k*dt).strftime('%H:%M UTC'))      #drop the seconds if not required for readability
    else:
        tlabels.append((tbase+k*dt).strftime('%H:%M:%SUTC'))    #include seconds where required
    tticks.append(uTC2time(tbase+k*dt))                         #build the array of time ticks
    sticks.append(uTC2time(tbase+k*dt)-delay)                   #build the array of time ticks for the spectrogram
print(tlabels)                  #print the time labels - just a check for development
print(tticks)                   #print the time ticks - just a  check for development
secax_x1 = ax1.secondary_xaxis('top')       #Displacement secondary axis
secax_x1.set_xticks(ticks=tticks)
secax_x1.set_xticklabels(tlabels, size='small', va='center_baseline')
secax_x1.xaxis.set_minor_locator(AutoMinorLocator(10))
secax_x2 = ax2.secondary_xaxis('top')       #Velocity secondary axis
secax_x2.set_xticks(ticks=tticks)
secax_x2.set_xticklabels(tlabels, size='small', va='center_baseline')
secax_x2.xaxis.set_minor_locator(AutoMinorLocator(10))
secax_x3 = ax3.secondary_xaxis('top')       #acceleration secondary axis
secax_x3.set_xticks(ticks=tticks)
secax_x3.set_xticklabels(tlabels, size='small', va='center_baseline')
secax_x3.xaxis.set_minor_locator(AutoMinorLocator(10))
secax_x4 = ax4.secondary_xaxis('top')      #spectrogram secondary axis - not yet working
secax_x4.set_xticks(ticks=sticks)
secax_x4.set_xticklabels(tlabels, size='small', va='center_baseline')
secax_x6 = ax6.secondary_xaxis('top')       #Specific Energy secondary axis
secax_x6.set_xticks(ticks=tticks)
secax_x6.set_xticklabels(tlabels, size='small', va='center_baseline')
secax_x6.xaxis.set_minor_locator(AutoMinorLocator(10))
secax_x5 = ax5.secondary_xaxis('top', functions=(one_over, inverse))        #PSD secondary axis
secax_x5.set_xlabel('Period, s', size='small', alpha=0.5, labelpad=-3)

# build array of arrival data
x2 = 0.49        #start near middle of page but maximise list space
dx = 0.0066      # linespacing
fig.text(x2, 0.03, 'Phase',size='small', rotation=90)         #print headings
fig.text(x2, 0.09, 'Time',size='small', rotation=90)
fig.text(x2, 0.15, 'UTC',size='small', rotation=90)
fig.text(x2, 0.2, 'Vertical Component', alpha = 0.5, size='small', rotation=90)
pphases=[]          #create an array of phases to plot
pfile=''            #create phase names for filename
allphases=True    #true if all phases to be plotted, otherwise only those in the plotted time window are plotted **** Enter data****
alf=1.0          #set default transparency
for i in range (0, no_arrs):                    #print data array
    x2 += dx
    if arrs[i].time >= delay and arrs[i].time < (delay+duration):       #list entries in the plots are black
        alf=1.0
    else:                                                               #list entries not in plots are greyed out
        alf=0.5
    fig.text(x2, 0.03, arrs[i].name, size='small', rotation=90, alpha=alf)       #print phase name
    fig.text(x2, 0.09, str(round(arrs[i].time,3))+'s', size='small', rotation=90, alpha=alf)     #print arrival time
    arrtime = eventTime + arrs[i].time
    fig.text(x2, 0.15, arrtime.strftime('%H:%M:%S'), size='small', rotation=90, alpha=alf)
    if allphases or (arrs[i].time >= delay and arrs[i].time < (delay+duration)):      #build the array of phases
        pphases.append(arrs[i].name)
        pfile += ' '+arrs[i].name
    if arrs[i].name.endswith('P') or arrs[i].name.endswith('p') or arrs[i].name.endswith('Pdiff') or arrs[i].name.endswith('Pn'):                    #calculate and print the vertical component of the signal
        fig.text(x2, 0.2, str(round(100*math.cos(math.radians(arrs[i].incident_angle)),1))+'%', alpha = 0.5, size='small', rotation=90)
    elif arrs[i].name.endswith('S') or arrs[i].name.endswith('s') or arrs[i].name.endswith('Sn') or arrs[i].name.endswith('Sdiff'):
        fig.text(x2, 0.2, str(round(100*math.sin(math.radians(arrs[i].incident_angle)),1))+'%', alpha = 0.5, size='small', rotation=90)
x2 += 2*dx
fig.text(x2, 0.03, str(no_arrs)+' arrivals total.', size='small', rotation=90)     #print number of arrivals

print(pphases)      #print the phases to be plotted on ray path diagram

if allphases or (rayt >= delay and rayt <= (delay+duration)):
    x2 = 0.905-dx
    fig.text(x2, 0.03, 'Rayleigh Surface Wave Arrival: '+str(round(rayt,1))+'s:', size='small', rotation=90)
    arrtime = eventTime + rayt
    fig.text(x2, 0.23, arrtime.strftime('%H:%M:%S UTC'), size='small', rotation=90)

# print phase key
x2 = 0.91           # line spacing
fig.text(x2, 0.03, 'Phase Key', size='small', rotation=90)      #print heading
pkey = ['P:   compression wave', 'p:   strictly upward compression wave', 'S:   shear wave', 's:   strictly upward shear wave', 'K:   compression wave in outer core', 'I:   compression wave in inner core', 'c:   reflection off outer core', 'diff:   diffracted wave along core mantle boundary', 'i:   reflection off inner core', 'n:   wave follows the Moho (crust/mantle boundary)']
for i in range (0, 10):
    x2 +=dx
    fig.text(x2, 0.03, pkey[i], size='small', rotation=90)      #print the phase key

#plot phase arrivals
plot_arrivals(ax1)          #plot arrivals on displacement plot
plot_arrivals(ax2)          #plot arrivals on velocity plot
plot_arrivals(ax3)          #plot arrivals on acceleration plot
plot_arrivals(ax6)          #plot arrivals on energy plot

# set up some plot details
ax1.set_ylabel("Vertical Displacement, m", size='small')
ax1.set_xlabel('Seconds after Event, s', size='small', labelpad=0)
ax2.set_ylabel("Vertical Velocity, m/s", size ='small')
ax2.set_xlabel('Seconds after Event, s', size='small', labelpad=0)
ax3.set_ylabel("Vertical Acceleration, m/s²", size='small')
ax3.set_xlabel('Seconds after Event, s', size='small', labelpad=0)
ax4.set_ylabel("Velocity Frequency, Hz", size='small')
ax4.set_xlabel('Seconds after Start of Trace, s', size='small', alpha=0.5, labelpad=-3)
ax5.set_ylabel("Velocity. PSD, dB",size='small')
ax5.set_xlabel('Frequency, Hz', size='small', labelpad=0)
ax6.set_ylabel('Specific Energy, J/kg', size='small')
ax6.set_xlabel('Seconds after Event, s', size='small', labelpad=0)

# get the limits of the y axis so text can be consistently placed
ax4b, ax4t = ax4.get_ylim()
ax4.text(2, ax4t*0.85, 'Plot Start Time: '+start.strftime(' %d/%m/%Y %H:%M:%S.%f UTC (')+str(delay)+' seconds after event).', size='small')      # explain difference in x time scale

#adjust subplots for readability
plt.subplots_adjust(hspace=0.6, wspace=0.1, left=0.05, right=0.95, bottom=0.05, top=0.92)

#plot the ray paths
arrivals = model.get_ray_paths(depth, great_angle_deg, phase_list=pphases)      #calculate the ray paths
ax7 = arrivals.plot_rays(plot_type='spherical', ax=ax7, fig=fig, phase_list=pphases, show=False, legend=True)   #plot the ray paths
if allphases:
    ax7.text(math.radians(315), 4800, 'Show All Phases', ha='center', va='center', alpha=.7, size='small')
else:
    ax7.text(math.radians(315), 4800, 'Show Phases Visible in Traces', ha='center', va='center', alpha=.7, size='small')
if great_angle_deg > 103 and great_angle_deg < 143:
    ax7.text(great_angle_rad,6800, 'Station in P and\nS wave shadow', size='x-small', rotation=180-great_angle_deg, ha='center', va='center')
elif great_angle_deg >143:
    ax7.text(great_angle_rad,6800, 'Station in S\nwave shadow', size='x-small', rotation=180-great_angle_deg, ha='center', va='center')

# Annotate regions
ax7.text(0, 0, 'Solid\ninner\ncore',
        horizontalalignment='center', verticalalignment='center',
        bbox=dict(facecolor='white', edgecolor='none', alpha=0.7))
ocr = (model.model.radius_of_planet -
       (model.model.s_mod.v_mod.iocb_depth +
        model.model.s_mod.v_mod.cmb_depth) / 2)
ax7.text(math.radians(180), ocr, 'Fluid outer core',
        horizontalalignment='center',
        bbox=dict(facecolor='white', edgecolor='none', alpha=0.7))
mr = model.model.radius_of_planet - model.model.s_mod.v_mod.cmb_depth / 2
ax7.text(math.radians(180), mr, 'Solid mantle',
        horizontalalignment='center',
        bbox=dict(facecolor='white', edgecolor='none', alpha=0.7))

#create phase identifier for filename
if allphases:
    pfile = ' All'

#print filename on bottom left corner of diagram
filename = 'E:\Pictures\Raspberry Shake and Boom\M'+str(mag)+'Quake '+locE+eventID+eventTime.strftime('%Y%m%d %H%M%S UTC'+pfile+'.png')
fig.text(0.02, 0.01,filename, size='x-small')

# save the final figure
#plt.savefig(filename)  #comment this line out till figure is final

# show the final figure
plt.show()
