Help with filters

Hi. I have a 4D recently repositioned- I’m wanting feedback on whether the data I’m getting is genuine or just noise from the house. It sits under the house on mudstone in a hole. Also would like to present data with the diagrams of the earth I have seen but not sure how?
Cheers graham

Trying to paste a copy of my data ……

1 Like

Hello Graham, welcome back to our community!

Well, from what I can see from the image you posted, except for the strong motion around 11:10:00 (I assume those were steps or something similar), the new location of the Shake seems to offer very low noise at lower frequencies, and some generic noise bands around ~21 and ~37Hz.

It is difficult to pinpoint what is(are) the source(s) of that noise, however. You could try moving the Shake again and see if, in other locations, the noise is reduced/disappears.

Regarding your second query, if you meant the diagrams shown in this image, for example, you can create them via Python.

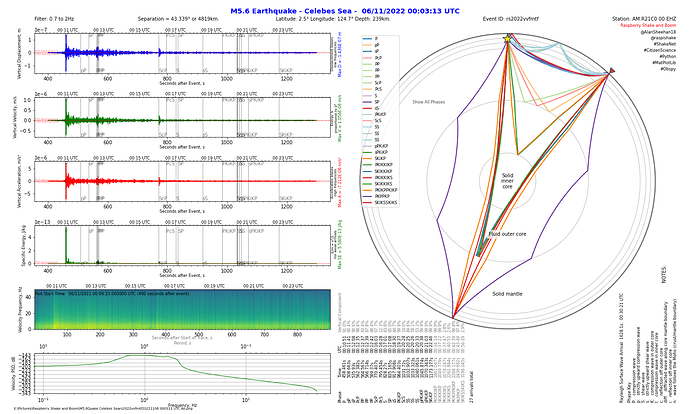
Sheeny has created an interesting and well-documented topic that covers what he has done, here: My current Python Report for code examples

1 Like

G’Day Graham.

I saw your post turn up in my Twitter feed and replied to that, but Stormchaser’s answer above covers all I can offer ATM. Happy to help with any other questions that arise of course.

If you are new to Python, I would recommend installing Python via Anaconda to manage all the different versions of the Python Packages you need. I originally didn’t do that and struggled to get Cartopy to work at all, so since uninstalling and reinstalling via Anaconda all is good. (Cartopy wouldn’t work with python v3.10, so now I use v3.9). I use the Spyder IDE from Anaconda to run Python.

Al.

2 Likes

Thank you both for the replies- will look at python.
In viewing my wave form for today for example- is this a lot of low frequency pollution or am I getting some P and S waves too?

Hello Graham,

As you have surmised, there is pollution in this specific trace segment, mainly due to some equipment that produced the “squiggly” track around 24Hz together with some close full frequency range signal (the vertical lines in the frequency window).

You can try to locate higher-magnitude earthquakes first (there has been an M7 relatively closer just after midnight UTC time), to get a feeling of what you can see with your Shake, and then move from there, acquiring experience at every step. For the event you have in your screenshot, this one is likely too low in magnitude to be detected at such a distance, which is why you don’t see defined P (or S) wave(s).

1 Like

It looks like you have log scale turned on. In general, you will get a cleaner view of what is going on if you turn that off.

2 Likes

G’Day Graham,

Looks like mostly cultural noise as Stormchaser has suggested. I agree with Philip, change your waveform Y axis scaling back to linear for a clearer idea of what’s signal and what’s noise. ATM it makes the noise look stronger than it actually is.

On the Frequency spectrogram however, the logarithmic scale helps to show the lower frequencies which is what we are usually most interested in. I usually use the log scale on the Y axis of the spectrogram.

The app has some handy sorts and filters. Try the Relevance sort. That sorts the earthquakes in order of the ones that should be strongest at your station to the top. Generally, I would expect that you could detect a M2+ quake within Tassie, M5+ within Australia/New Zealand, M6+ Pacific/Indochina and M7+ is worth a try worldwide. M2.1 from Turkey I would not expect to get a real signal.

Note the P and S arrivals are only the biggest signals on relatively close quakes. On distant quakes with marginal P and S arrivals, I often detect stronger clearer later arrivals with my python code. (I assume there’s a bit of an effect like a telescope mirror happening on the concave boundaries in the earth, that focuses/reinforces the signal somewhat).

Al.

1 Like

Hi Al. I have the log turned off the Doppler, apart from the four choices of frequency I can’t see a way to adjust the top wave forms ?

1 Like

1 Like

G’Day Graham,

I had a another look at the screenshot you posted earlier. It’s weird. The scale goes 0, 20, 40, 60, 80, 1e02, then 2e02, 4e02, 6e02… I think that’s a bug! It starts off going up in 20’s then by 200’s when the exponent kicks in. When I first looked at it I thought it was an exponential scale, but it appears not. Sorry for the confusion.

The later screenshots look good. Have a play with the spectrogram with the log scale turned on. That should compress the noisy top end of the spectrogram that we’re not interested in and expand the lower frequencies that we are interested in. See the examples below.

Al.

Looking at your 2 screenshots of the M7.0 Kermadec Quake…

It “appears” that the P wave arrives early. This is very unusual if true, so I suspect you have some local noise over the top of the P wave signal. Reflected arrivals can be earlier (or later) depending on the position of the reflecting surface (higher/lower/nearer/further), etc but not usually direct arrivals.

If you follow some other stations close to yours, you can quickly look at the signal they get to confirm your signal or identify local noise.

Al.

1 Like