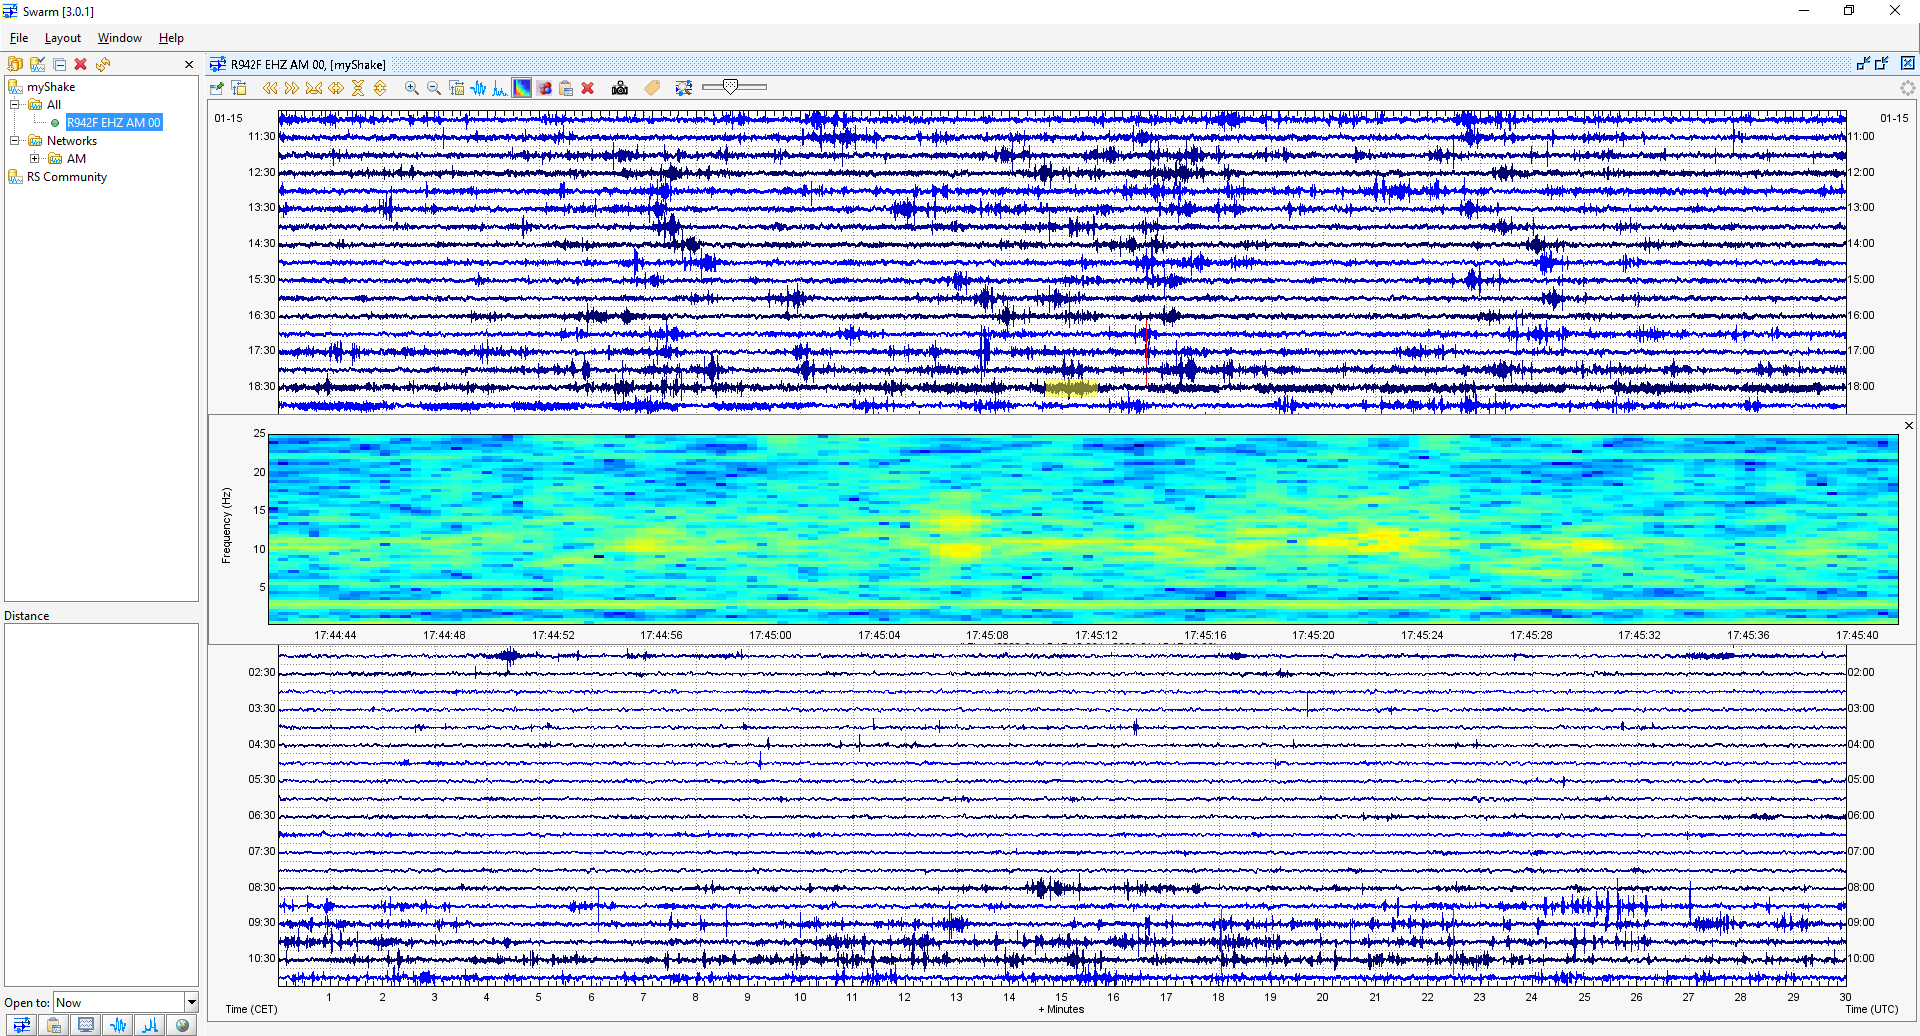
The recent eruption of Hunga Tonga-Hunga Ha’apai volcano, near Tonga, caused a tsunami alert for the US West Coast with a (water) wave expected this morning around 7 - 7:30 am today, 15 Jan 2022.
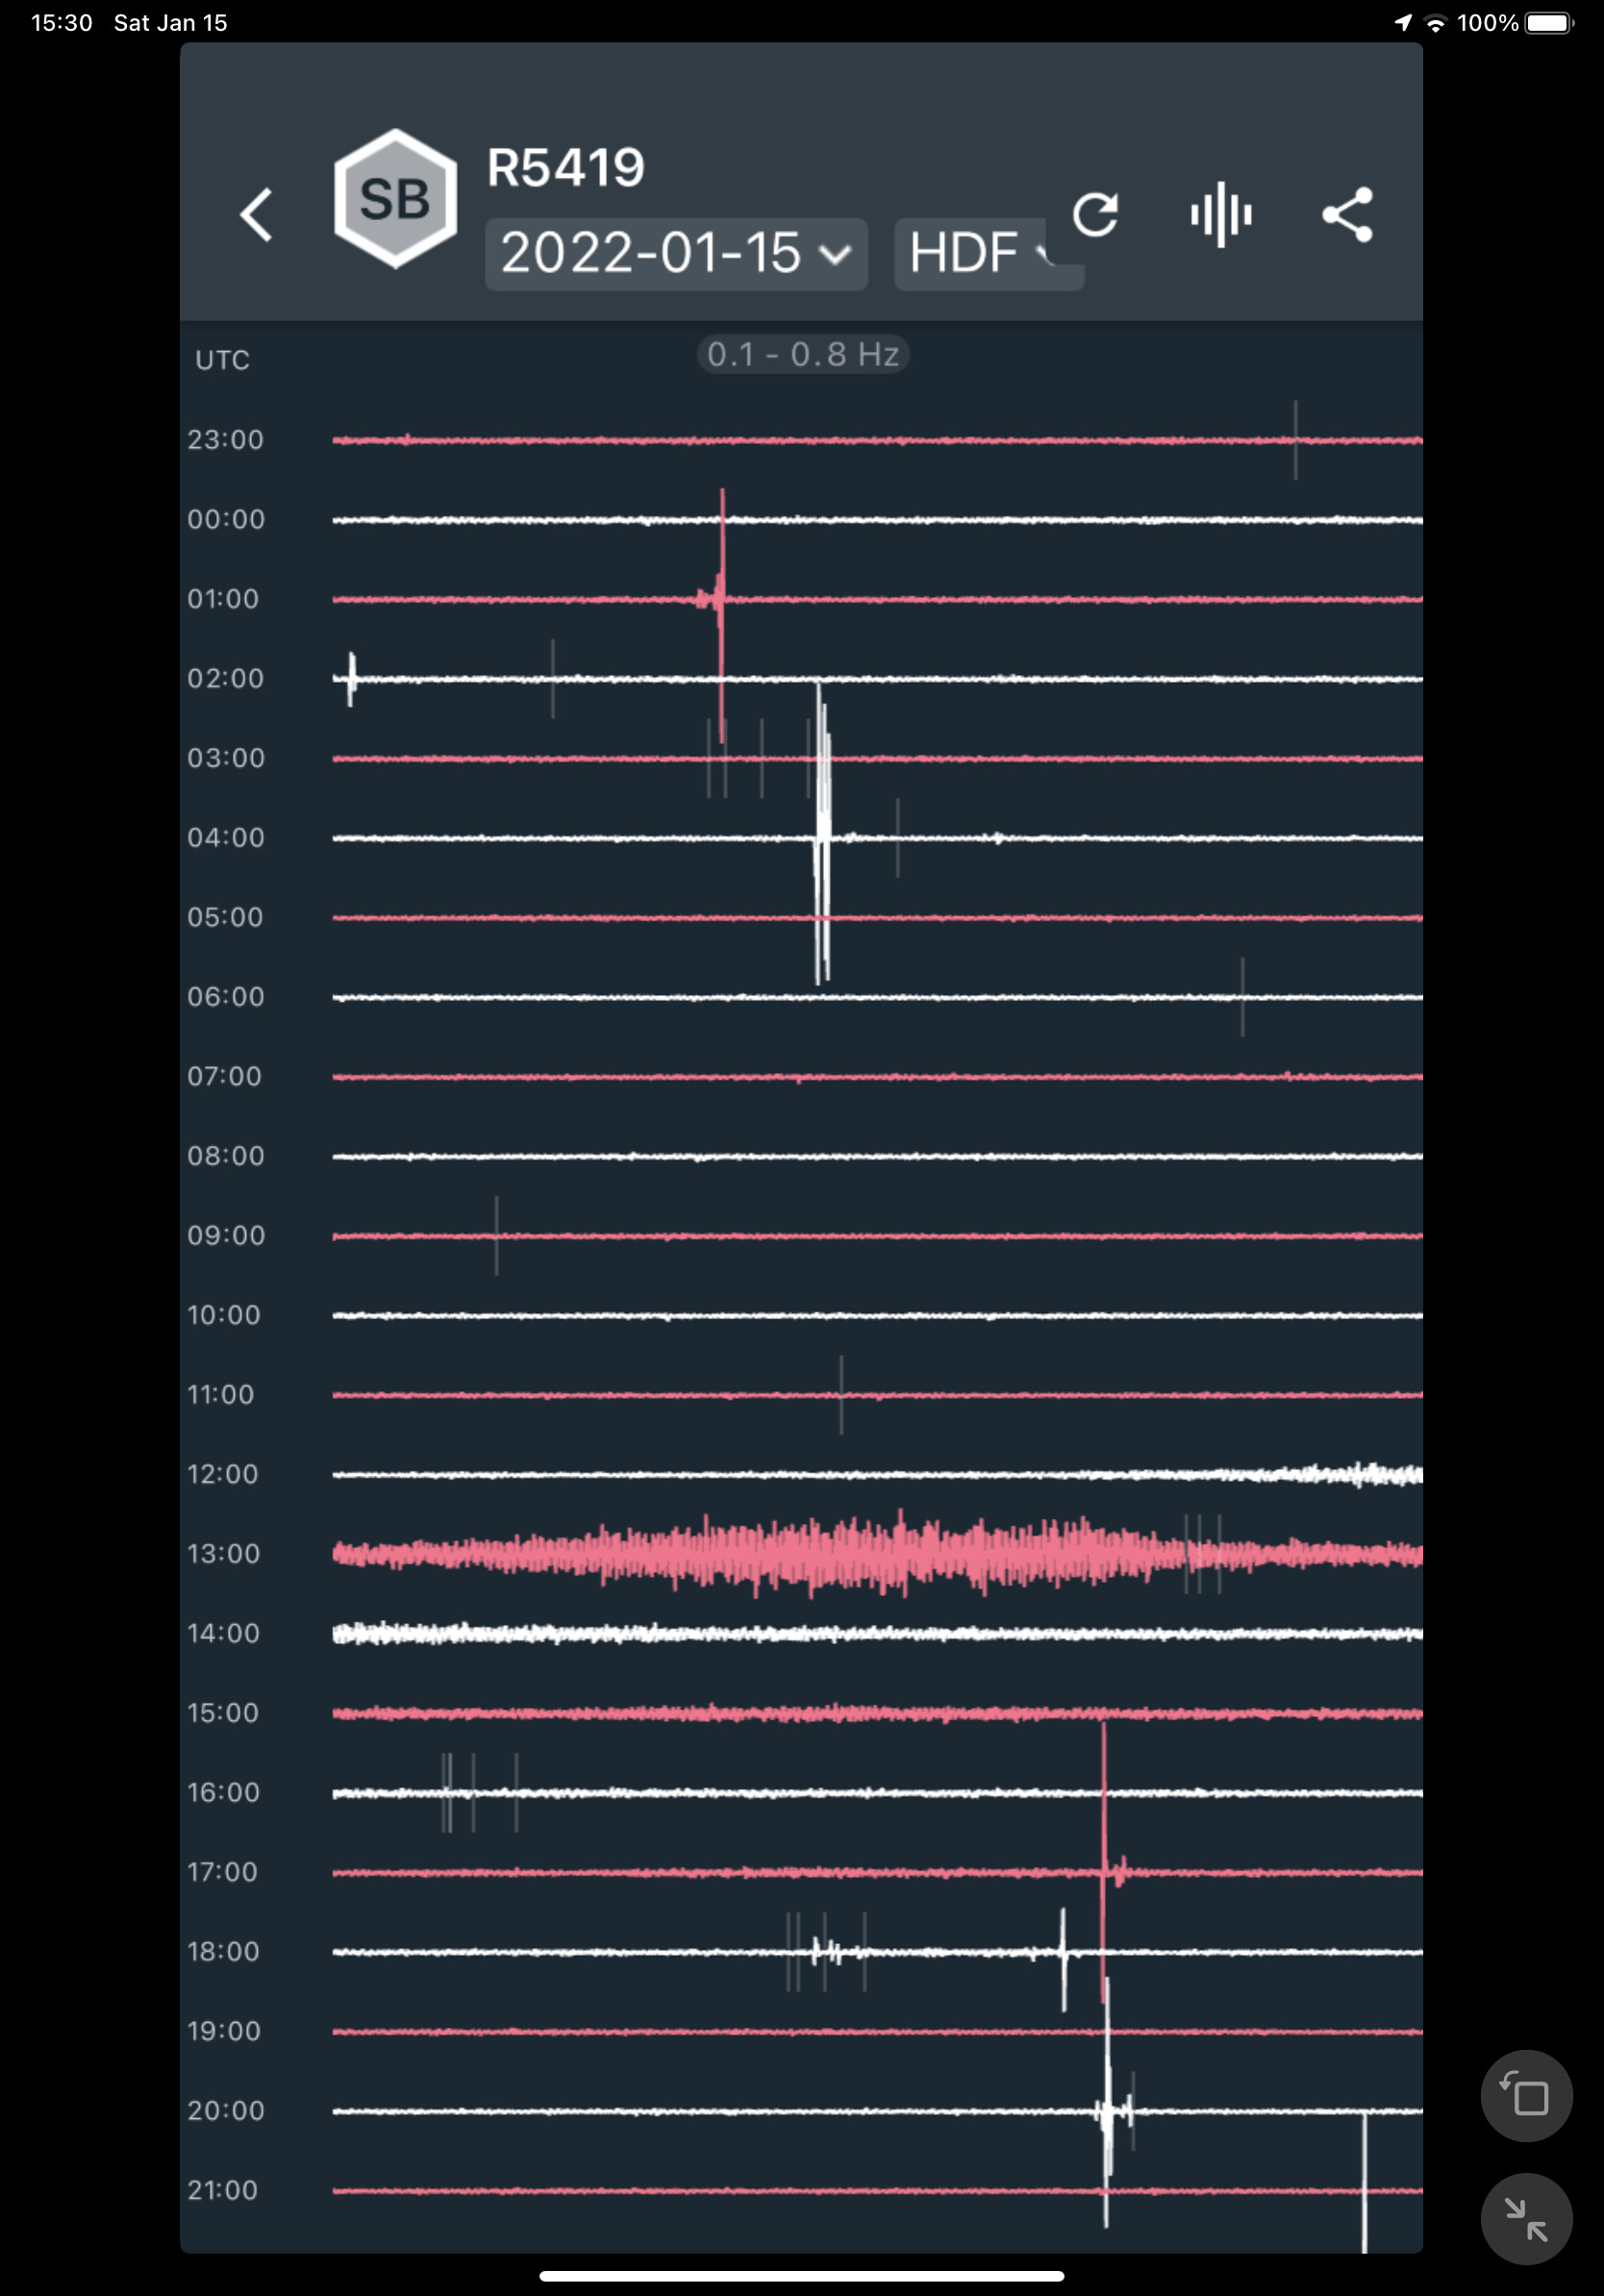
I’m wondering what the air pressure signal from this event would look like. There was clearly a lot of noise on my R-Boom starting around 5 am local time which is 1300 UTC 15-JAN-2022 but I don’t know if that was just from local wind, or something more distant. Being in Oregon, USA I’m obviously a long way away, maybe around 6000 miles. Data View: Raspberry Shake Data Visualization Tool
3 Likes
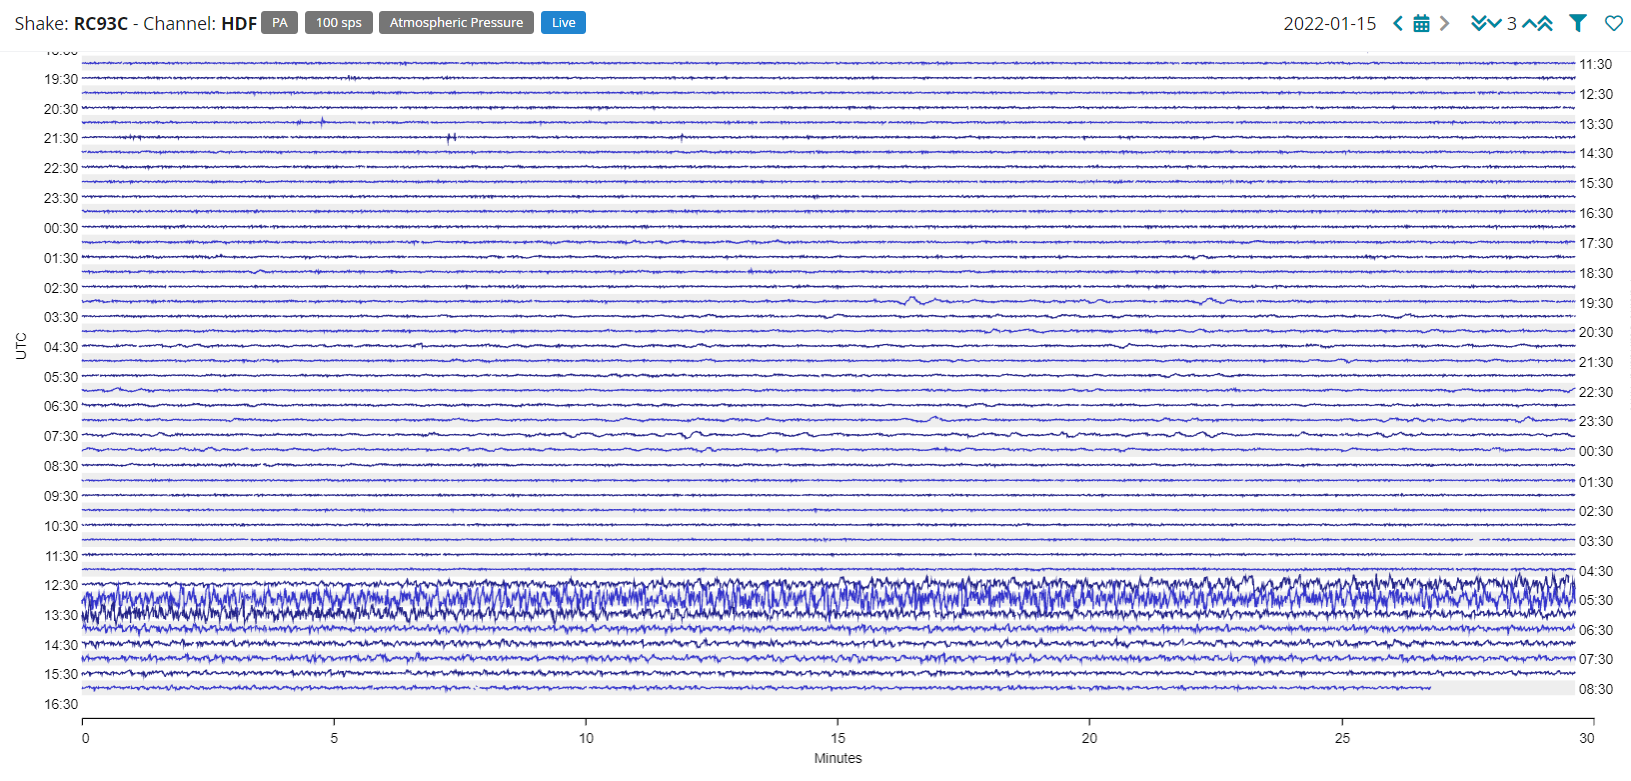
Thanks for posting. I was looking at my RBOOM data and thinking… maybe this was the volcano signature, but I was not sure. I was looking for more of a spike initially and it took a little time to notice the longer period signal. It starts at about 4a PT / 12 UTC.
So, I checked my data against two other booms in Socal. SoCal is about 5,400mi from Tonga. Here is what I found:

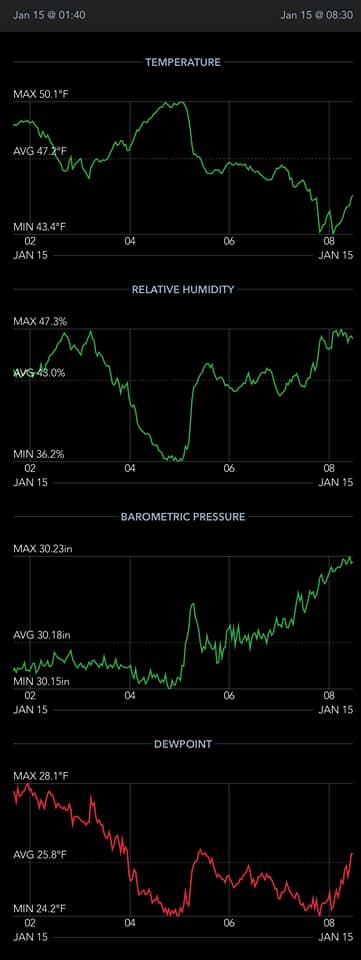
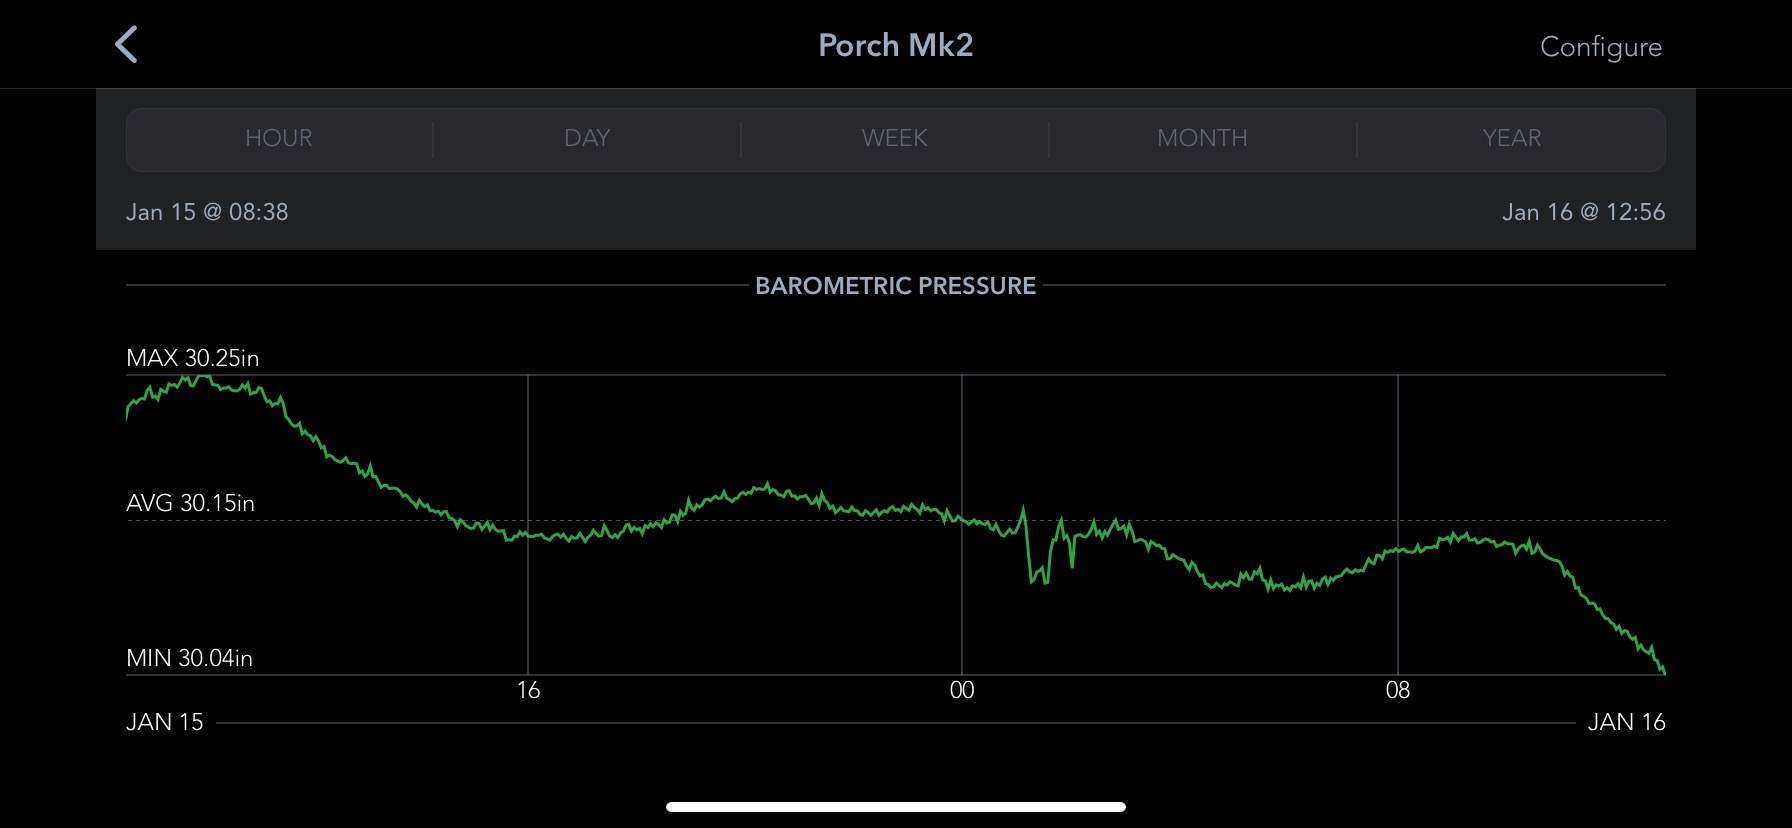
It appears they all picked up a similar signal around this time (as yours did). It also matches up to a pressure change I noticed on my weather station:
-Steve
RS4D RD29A
RBOOM R2BFC
Chino Hills, Ca
2 Likes
I’m in the UK and was just reading that it should ‘hit’ here shortly (1830-1930 UTC), so the timings seem about right?
2 Likes
Thank you for your very interesting contributions to this thread @scaron and @jbeale!
Those are indeed the tracks of the pressure wave that was released during the violent explosion of the Hunga Tonga-Hunga Ha’apai. I have seen the same tracks on more than 15 BOOMs and SBOOMs around the Shake network!
@Gareth70 welcome to our community!
Yes, the wave has now passed Iceland, and it should be detected in the coming hours in the UK too. It seems that its magnitude has decreased compared to the one that can be seen on closer weather stations, but we will see.
EDIT: Here’s the infrasound low-frequency signal incoming at my Shake&Boom!
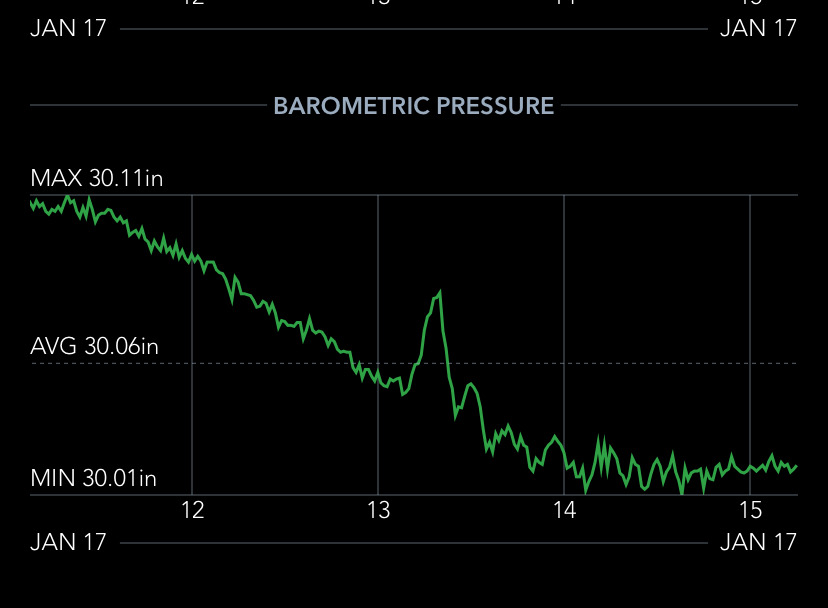
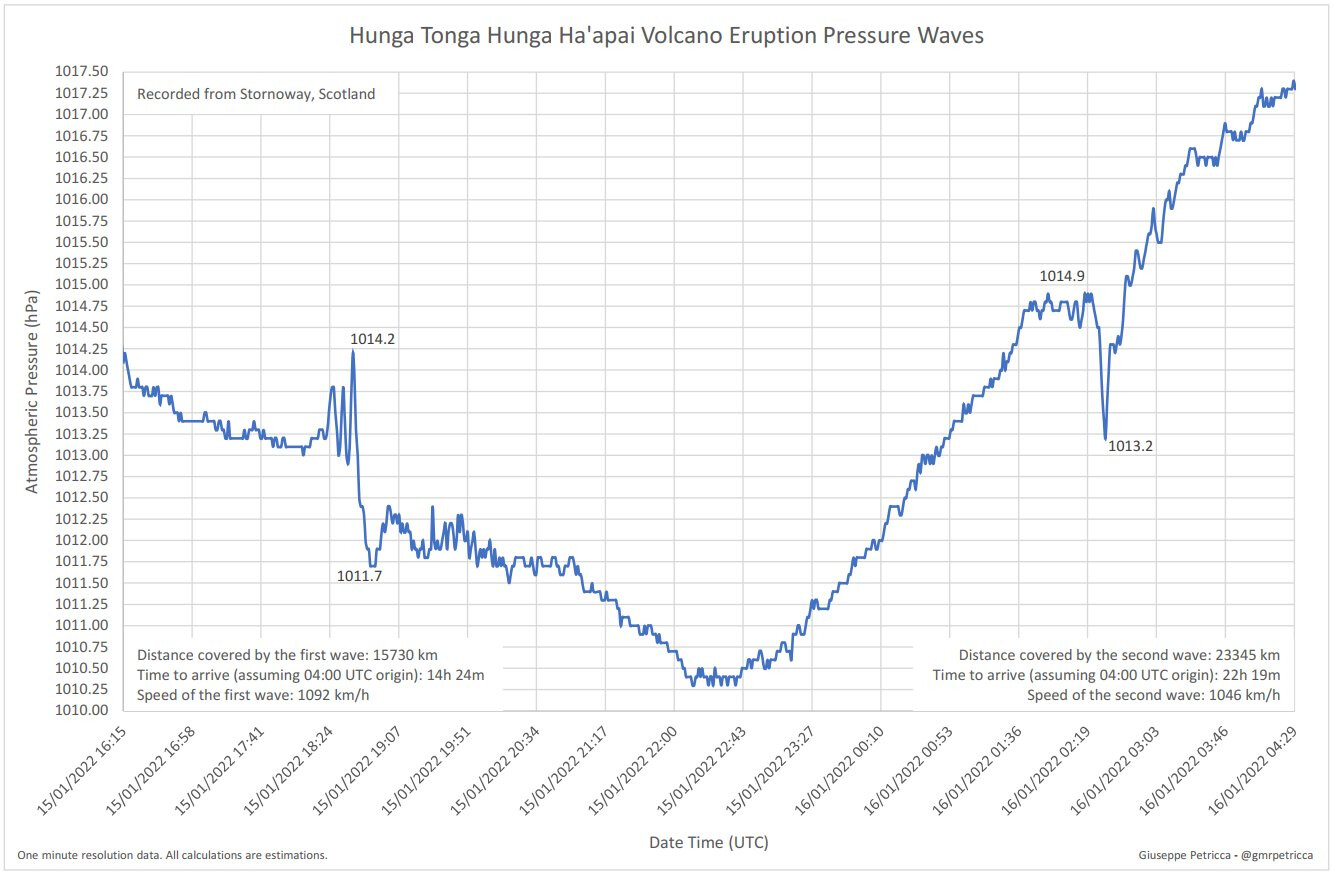
Here was the pressure recorded in the UK:
3 Likes
The USGS posted an image their infrasound reading from the Cascades on facebook-
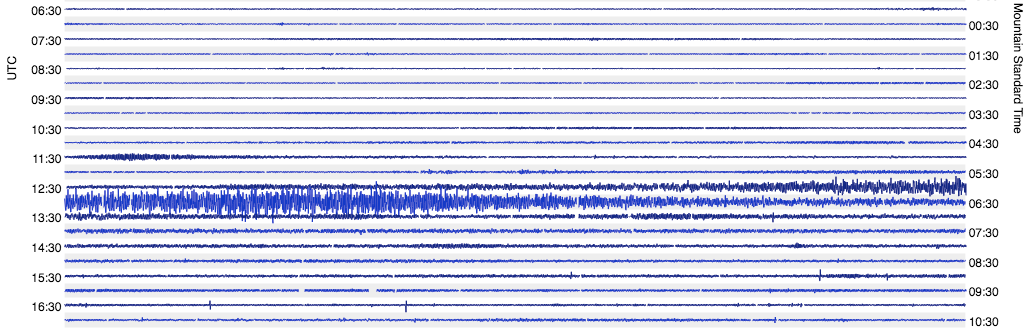
I’ve got the same rumble this morning on mine in Arizona, really low stuff for 40 minutes or so
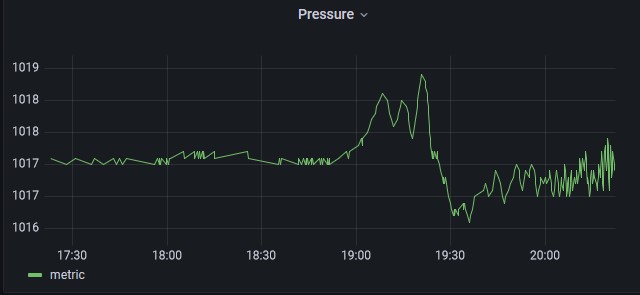
My little outdoor weather sensor caught the atmospheric pressure blip too, proceeded the infrasound roar by 30 minutes or so
3 Likes
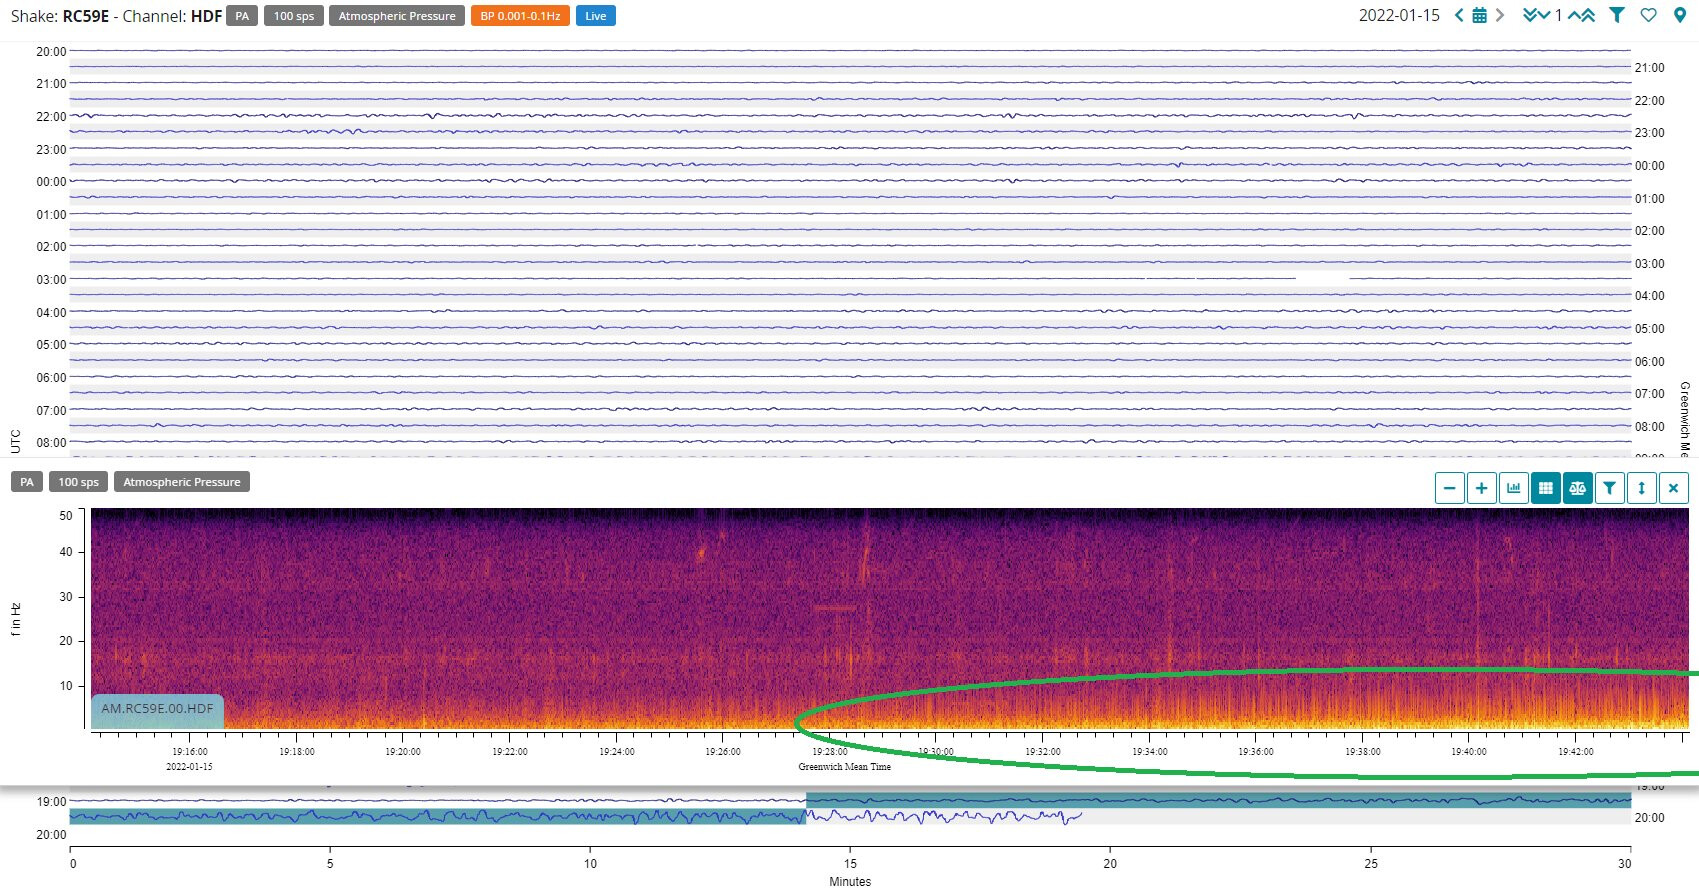
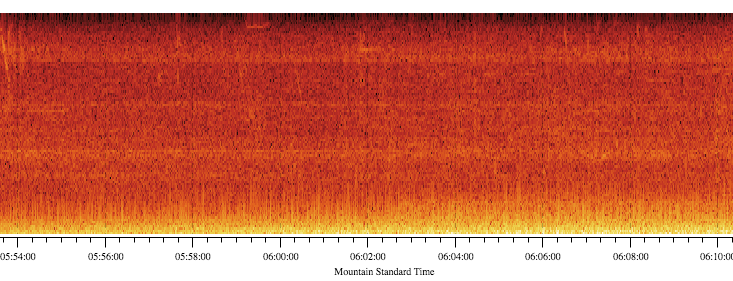
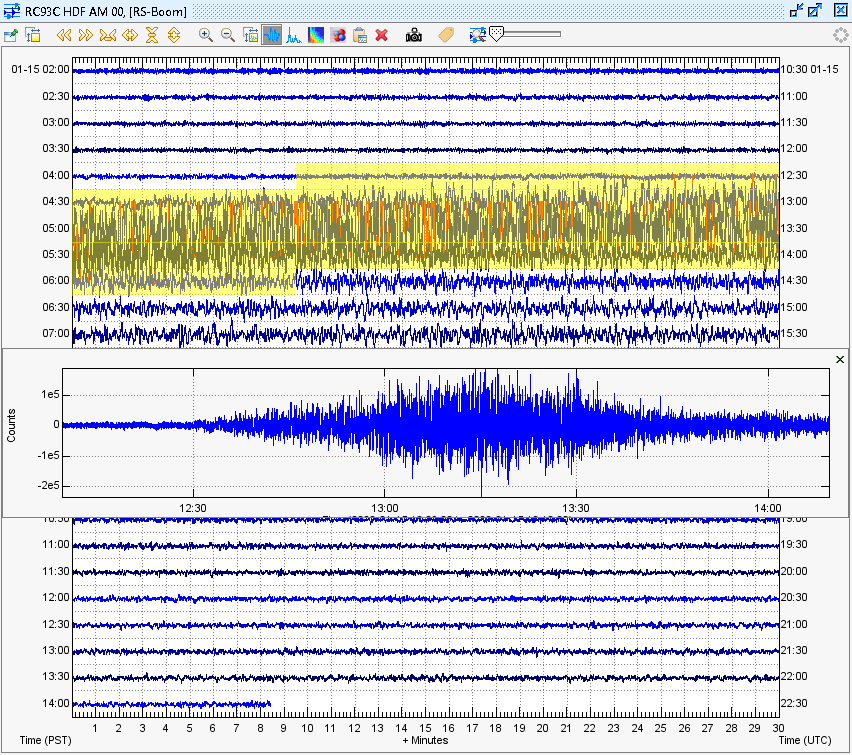
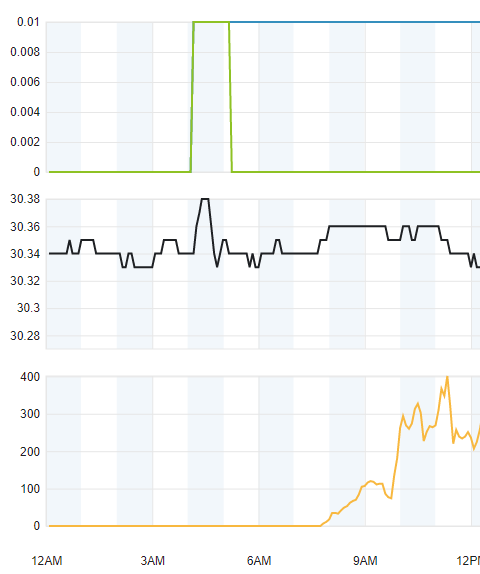
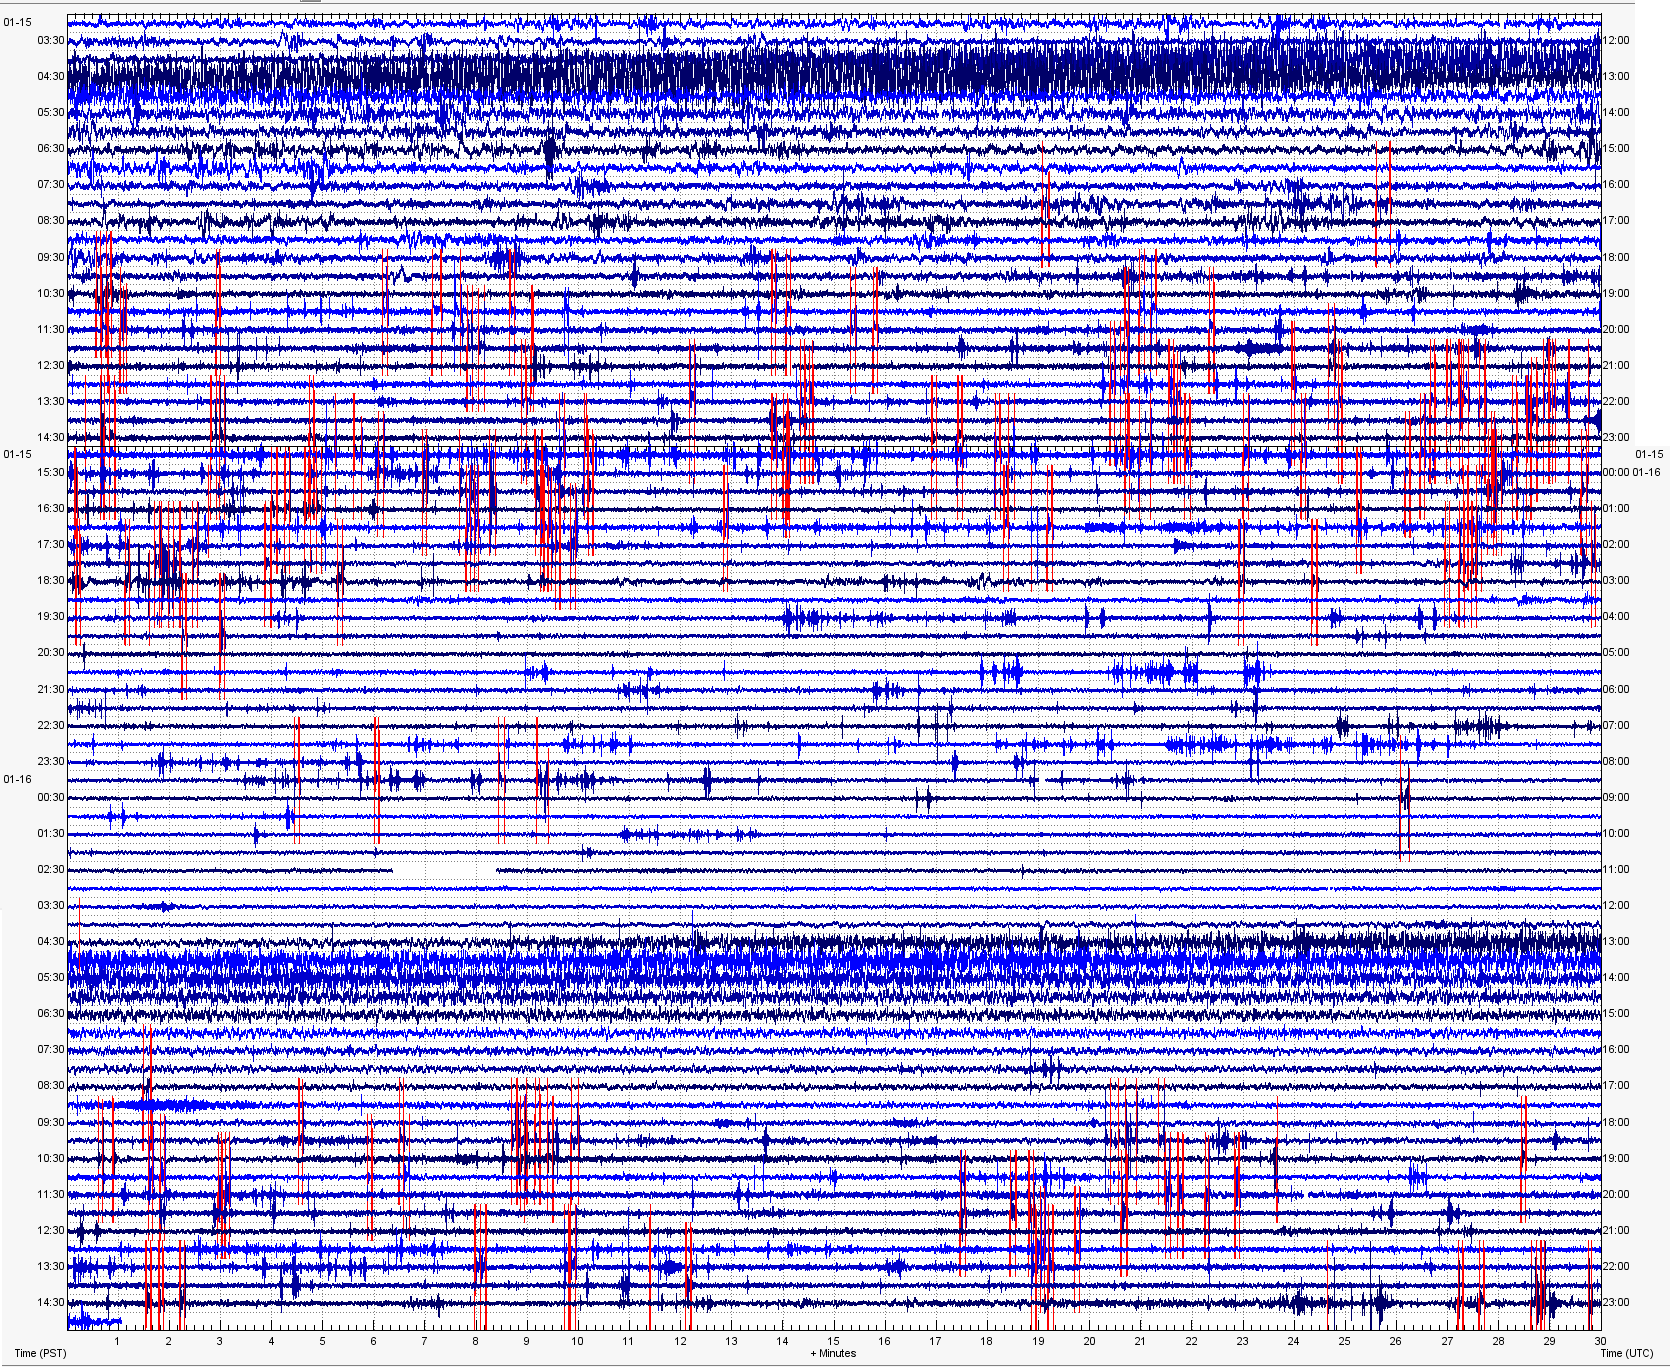
Same here, near Seattle, WA. On my RS&Boom, I got this irregular HDF signal, starting around 5am Pacific time, peaking around 5:15-5:45 lasting almost an hour, then less of a pronounced signal. Is this from the explosion, or the tsunami?
2 Likes
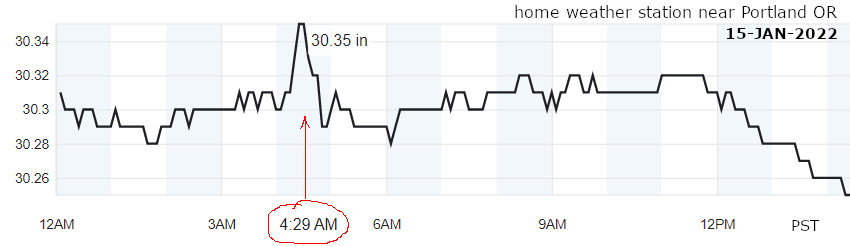
I was interested to see pressure peak on my weather station barometer around 4:30 PST happened about 45 minutes before the peak of the more spread-out infrasound noise at 5:15 PST or 1315 UTC. I wonder if the simple pressure peak is the only thing that really travelled from the volcano, but that drives local air turbulence around any local topography, that causes infrasound afterwards?
2 Likes
On my BOOM that sits rather suboptimally indoors in my basement, I see the infrasound hitting twice as would be expected after travelling almost halfway round the planet to my station in Germany.
Someone should do an animation of the wave propagating thru the BOOM network perhaps.
2 Likes
This turned out to be such an interesting thread! Thank you all for your detailed input, and a welcome to our community to @hbeggenstein!
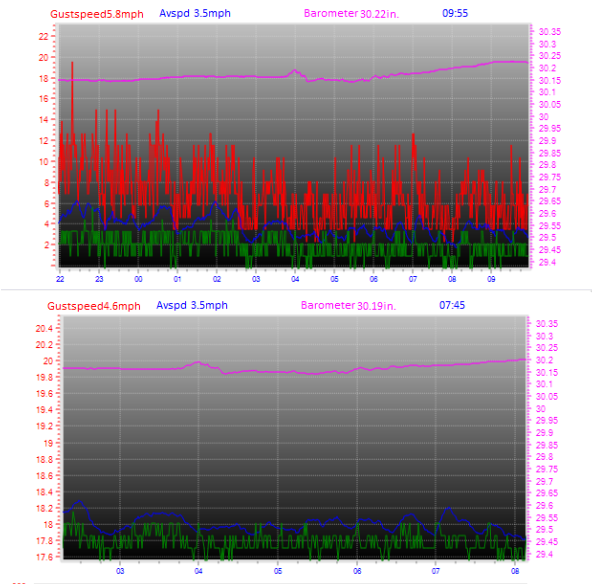
I’ll add my own sensor detections, both from my weather station (first image) and from my Shake&Boom infrasound data (second and third).
This was a historical event indeed.

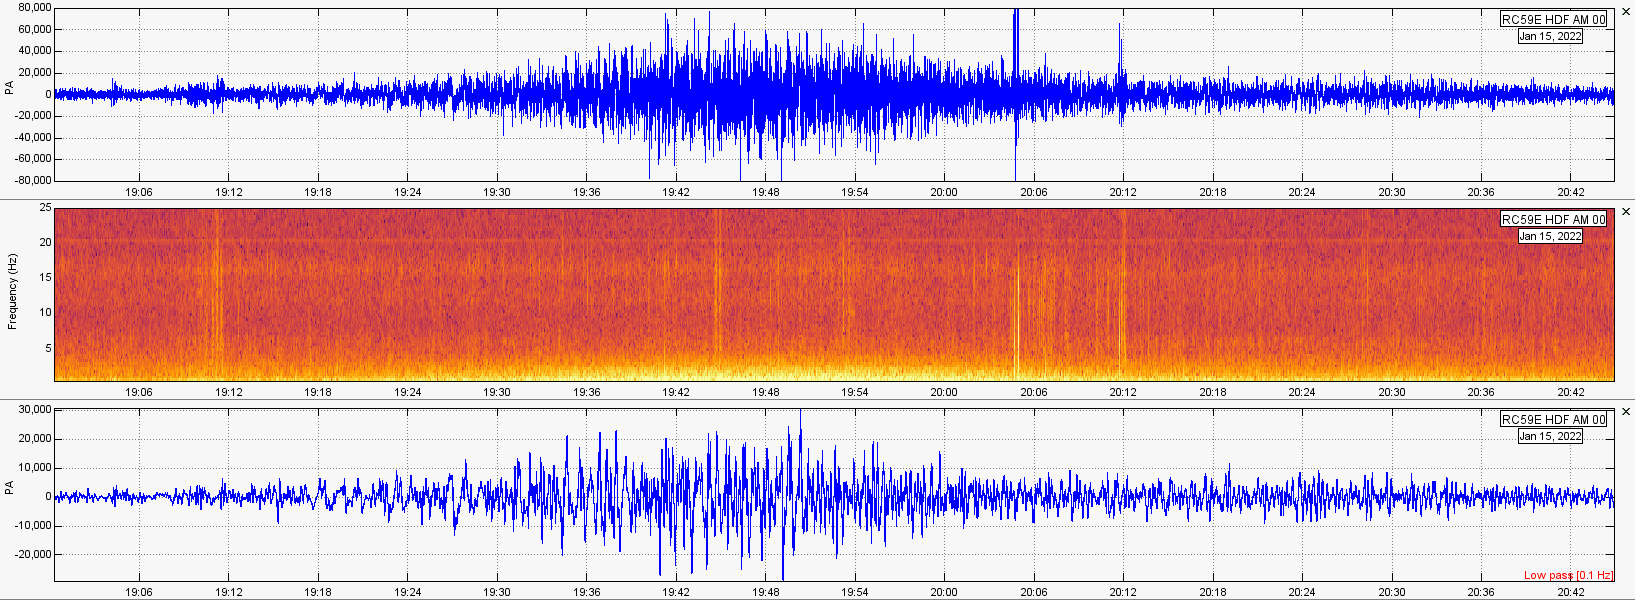
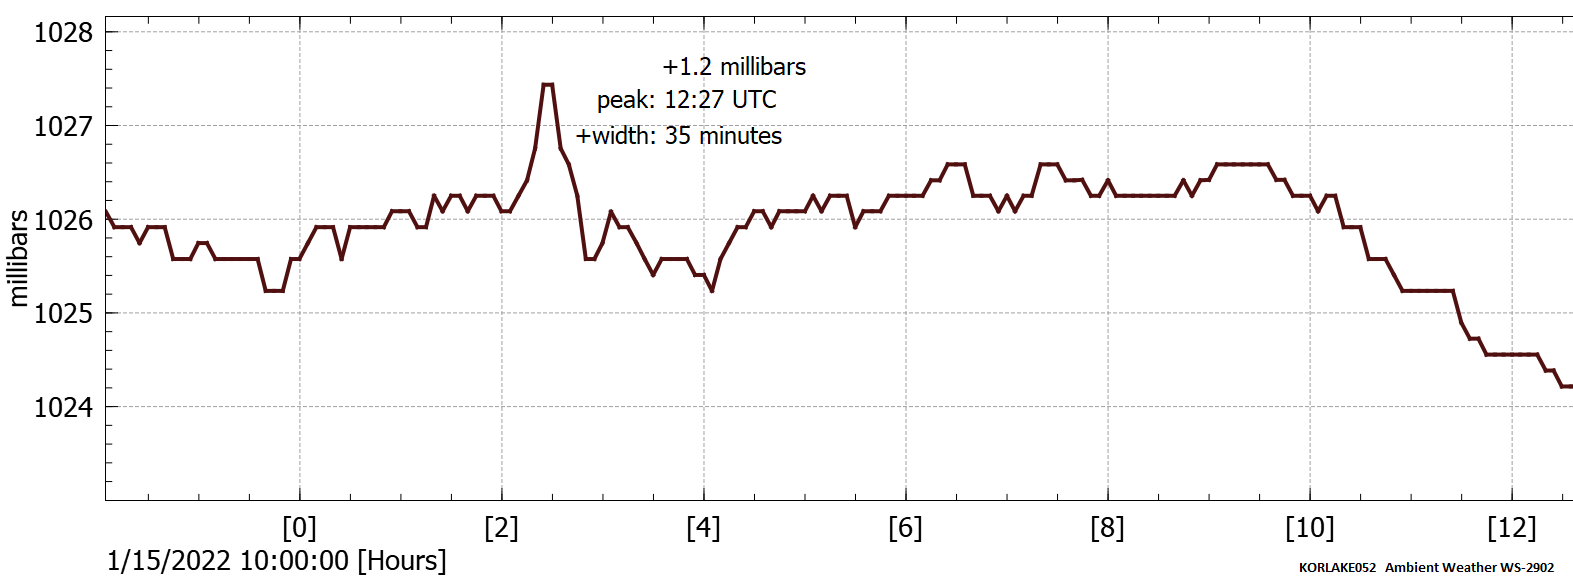
Looking at my home weather station, I saw a positive pressure spike of 1.2 mbar lasting 35 minutes, peaking at 12:27 UTC (4:27 am PST). Just at the rising edge of that spike (12:10 UTC), there was a 6 mph gust of wind from an unusual direction. My weather station only samples at 5 minute intervals. I note that this pressure peak was much shorter, and about 45 minutes before the infrasound peak measured at the same location (near Portland OR). I’m tempted to speculate the pressure pulse was more about the initial eruption total gas volume and temperature, while the infrasound was about convection cells and turbulence in the developing and more extended volcanic plume.

2 Likes
I saw the same pressure peak here in Sweet Home OR on my Davis weather station. Went back and looked for it after seeing that it was observed by others. I’m sampling at 5 minute intervals. Coincidence or not, with no other rain, my rain gauge bucket decided to tip at the same time. no other rain for ± 10 hrs.
August KG7BZ
2 Likes
The USGS shared this of the first and second waves from the Cascades:
It’s coming around for another pass!
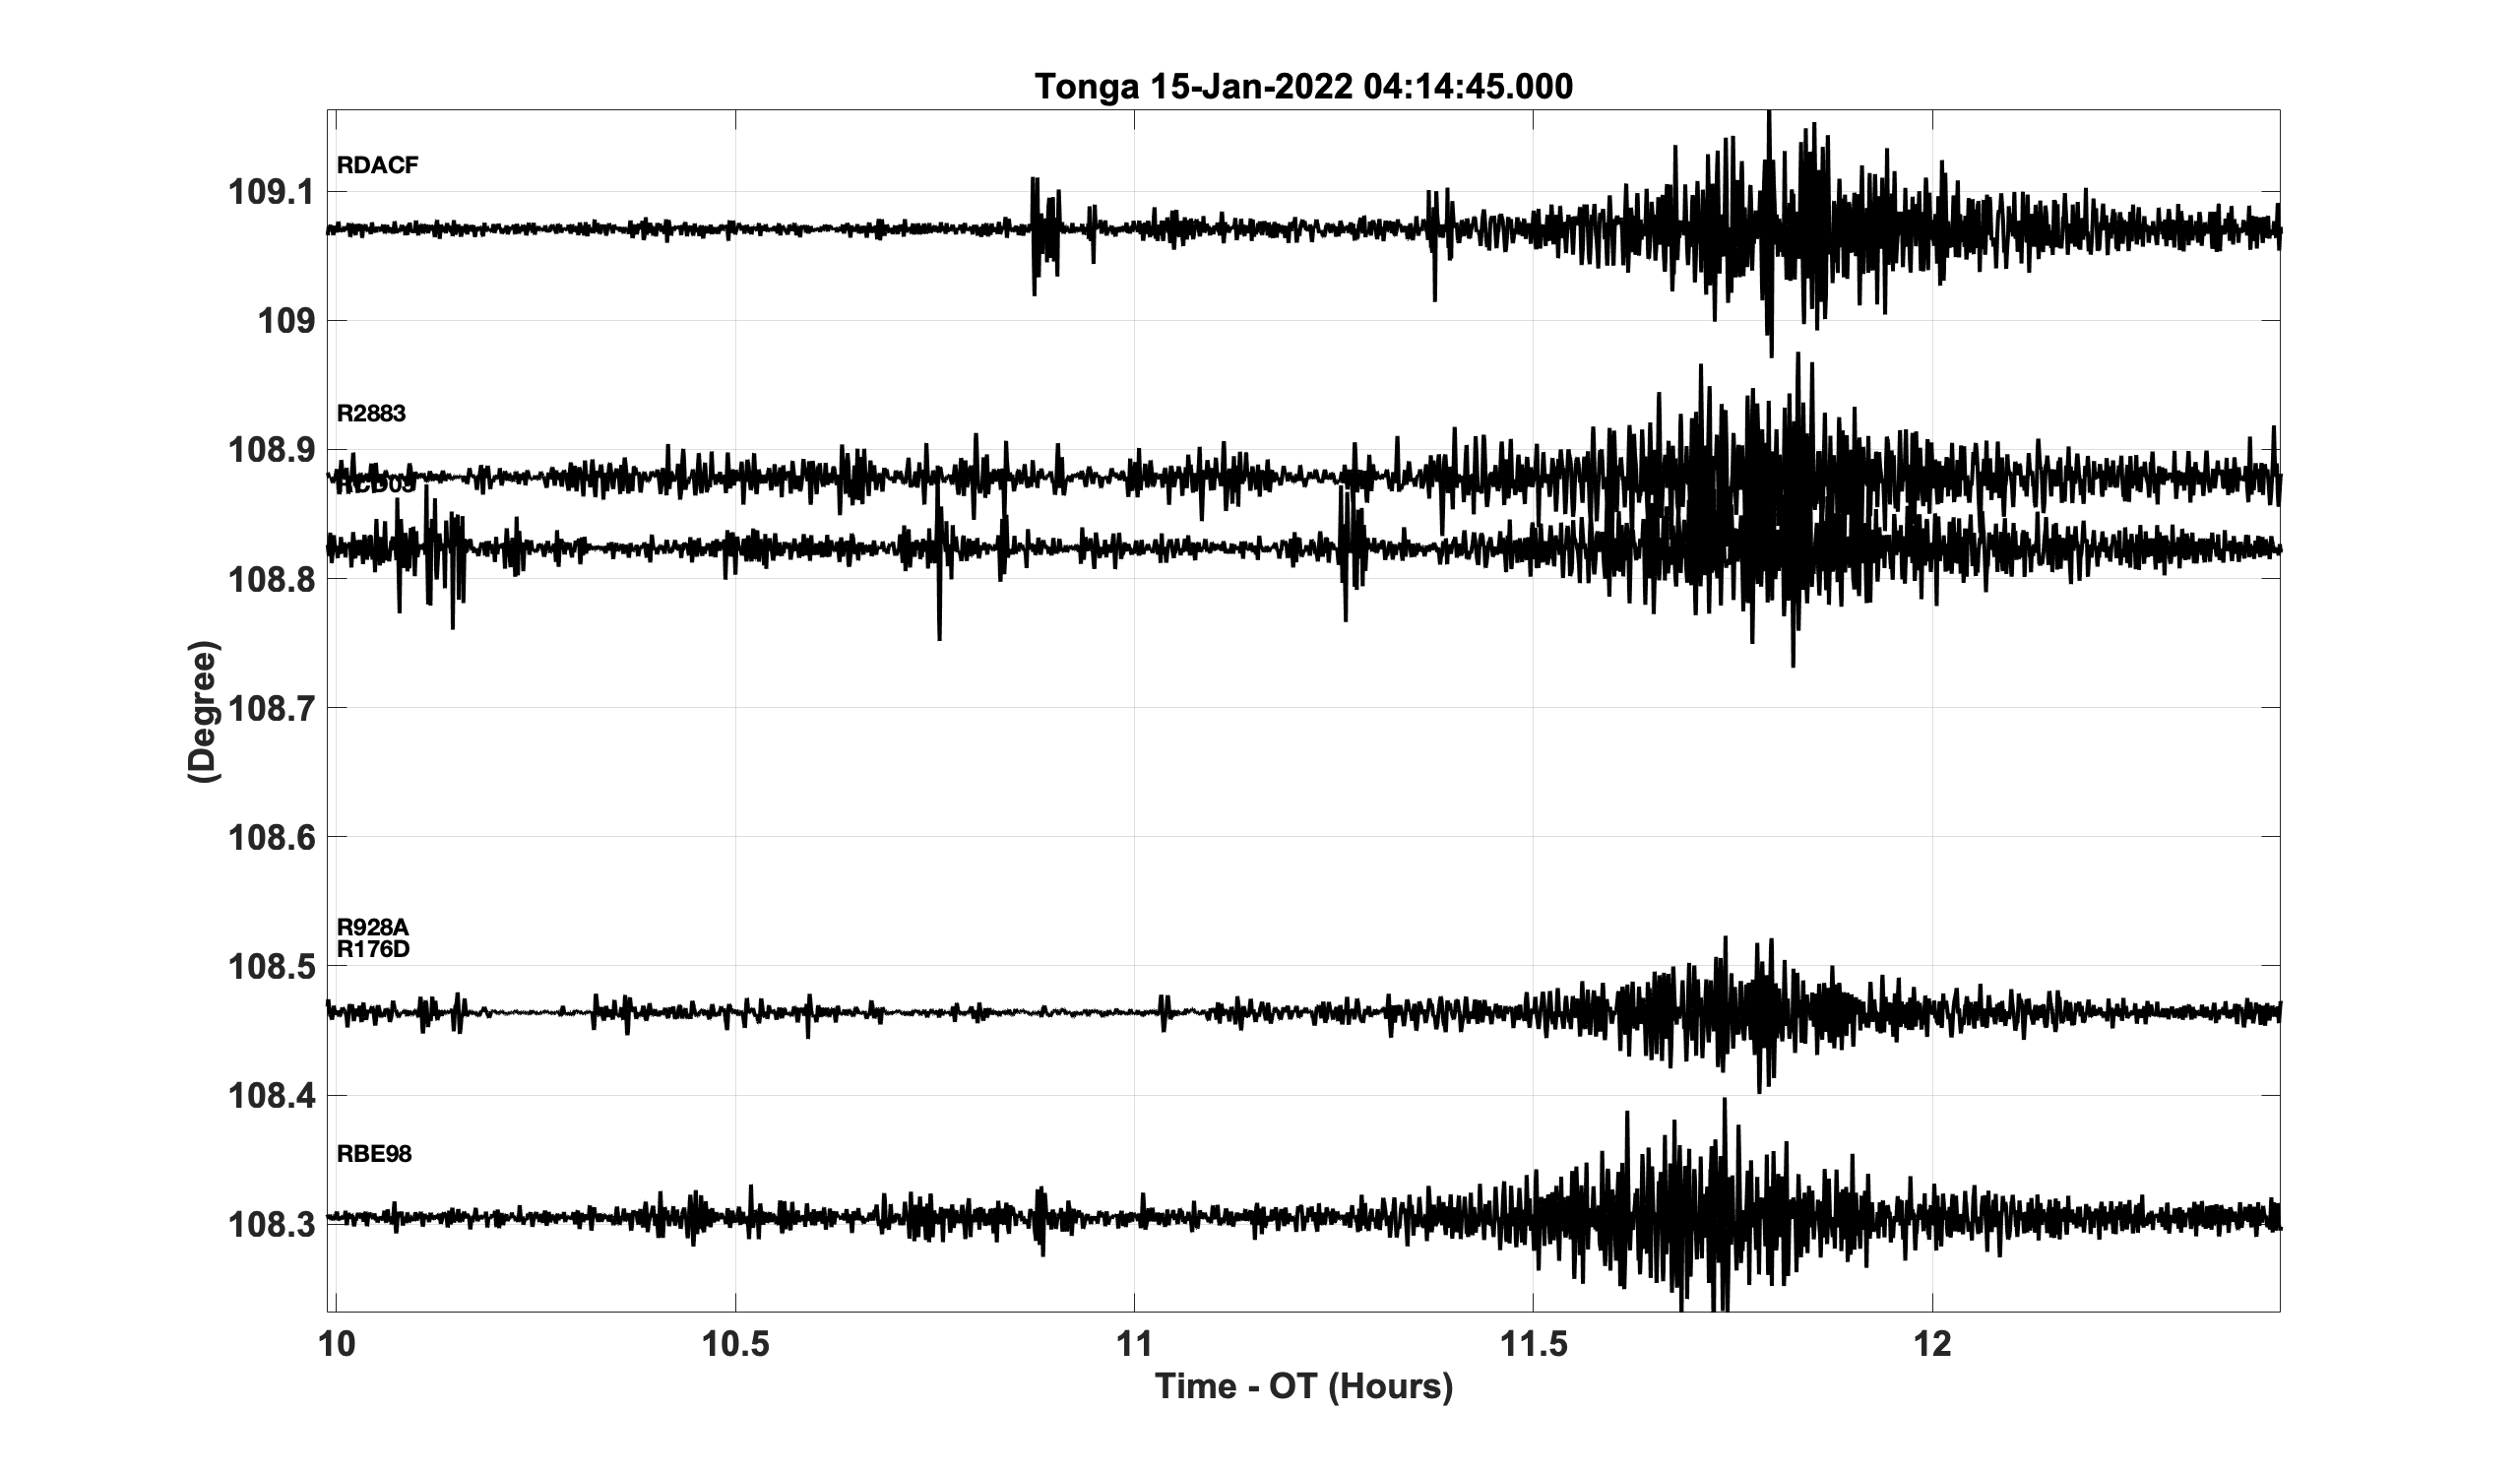
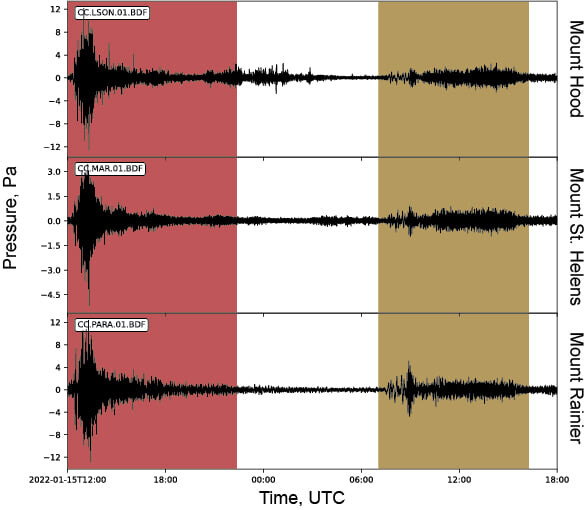
Shown are the unfiltered infrasound records from Mount Hood, Mount St. Helens, and Mount Rainier. The first signal, appearing at the start of the record (noted by the red box), is the initial airwave from yesterday’s eruption Hunga Tonga-Hunga Ha’apai volcano in Tonga. The second longer but lower-magnitude signal that shows up later in the plot (noted by the gold box) is the airwave passing by the station again! That’s right, the airwave is doing a second lap! The first wave traveled a distance of ~8500 km (~5300 miles). The second traveled ~32,500 km (20,200 miles)! The second pass contains some low frequencies, so might have been detected by barometers, just like the initial airwave.
I really had to zoom out to pick up the second wave in AZ, but it does look close to the USGS, which are at similar distances from the source as me
First and second wave, pressure reading from the start of the second, blip up then drop for about 1 hr

2 Likes
RBE98 is me! Woohoo. Thanks for posting.
1 Like
May have just caught the second lap of the pressure wave from the west in Arizona- The speed of the waves coming from both sides past me worked out to about 720mph, a full lap of the Earth at that speed is around 35 hours, and 4pm MST was about 35 hours since the first pulse hit here at 5am Jan 15th. Timing is right!
2 Likes
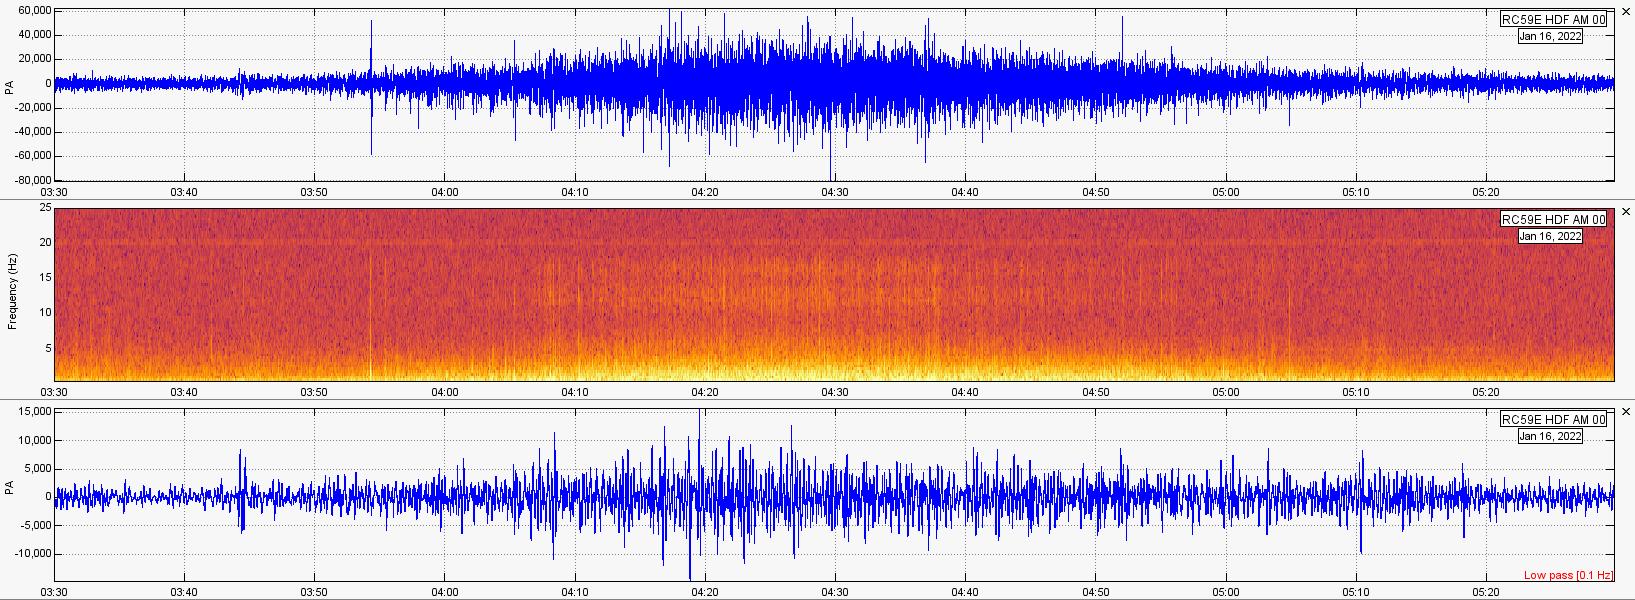
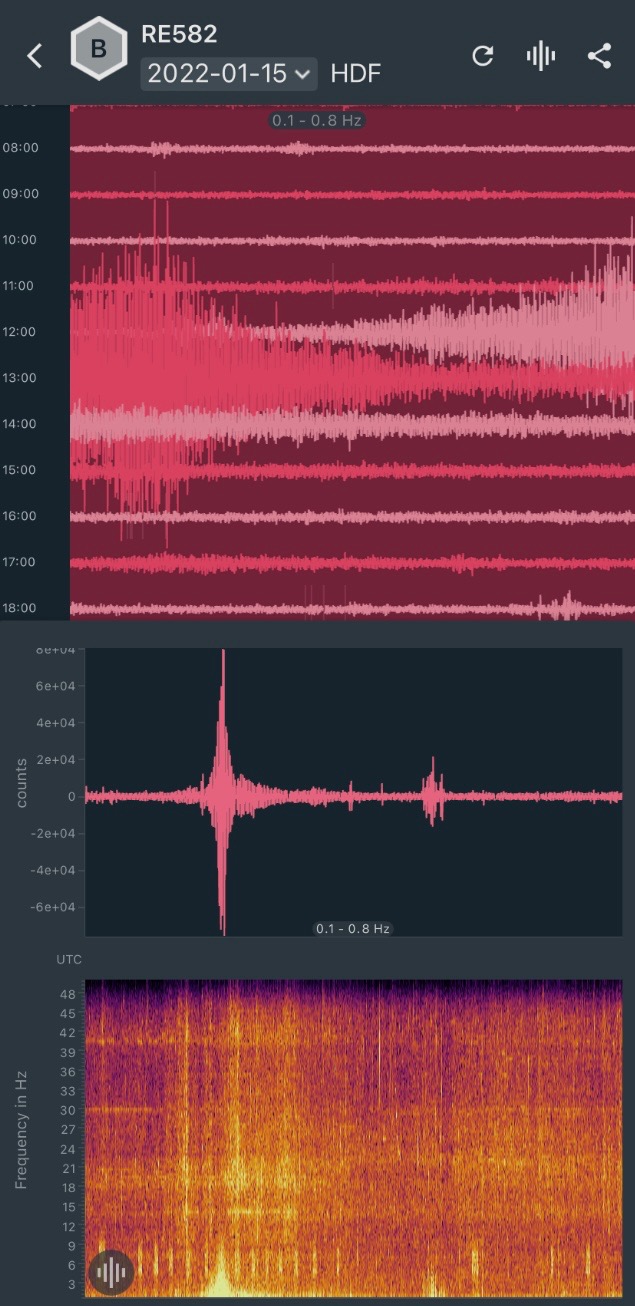
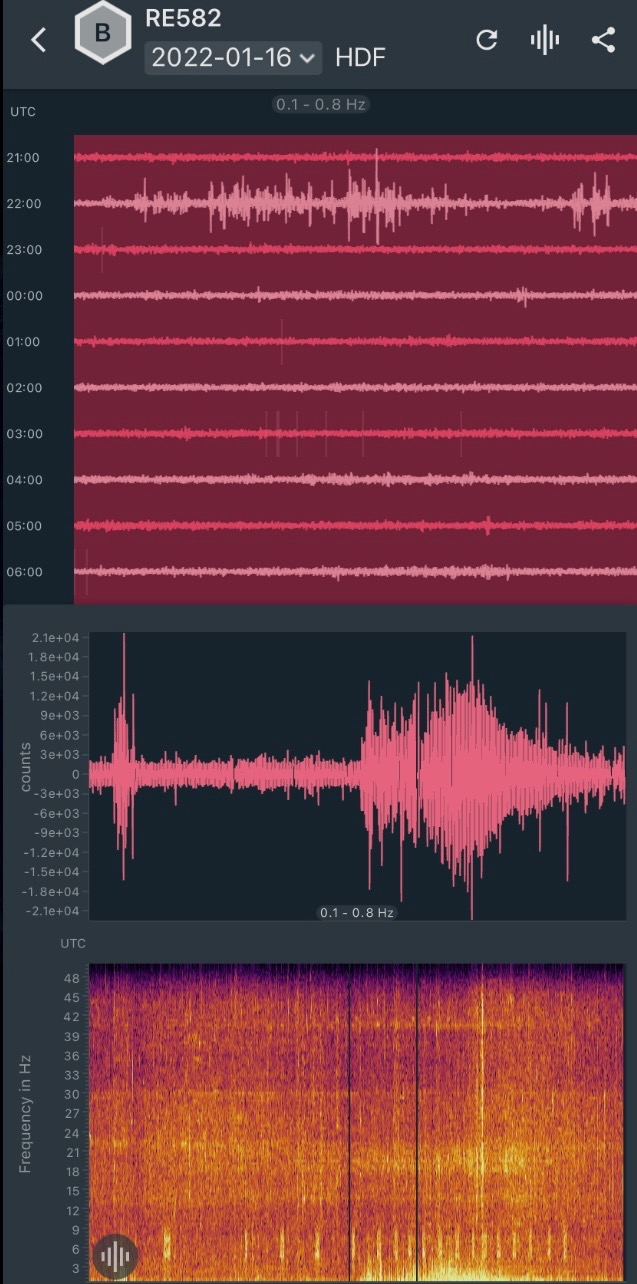
I seem to have recorded something again. It is also seen on two other Southern California Booms. No wind at the time. Possibly the opposite direction wave, but the timing does not seem to match up with this info: x.com
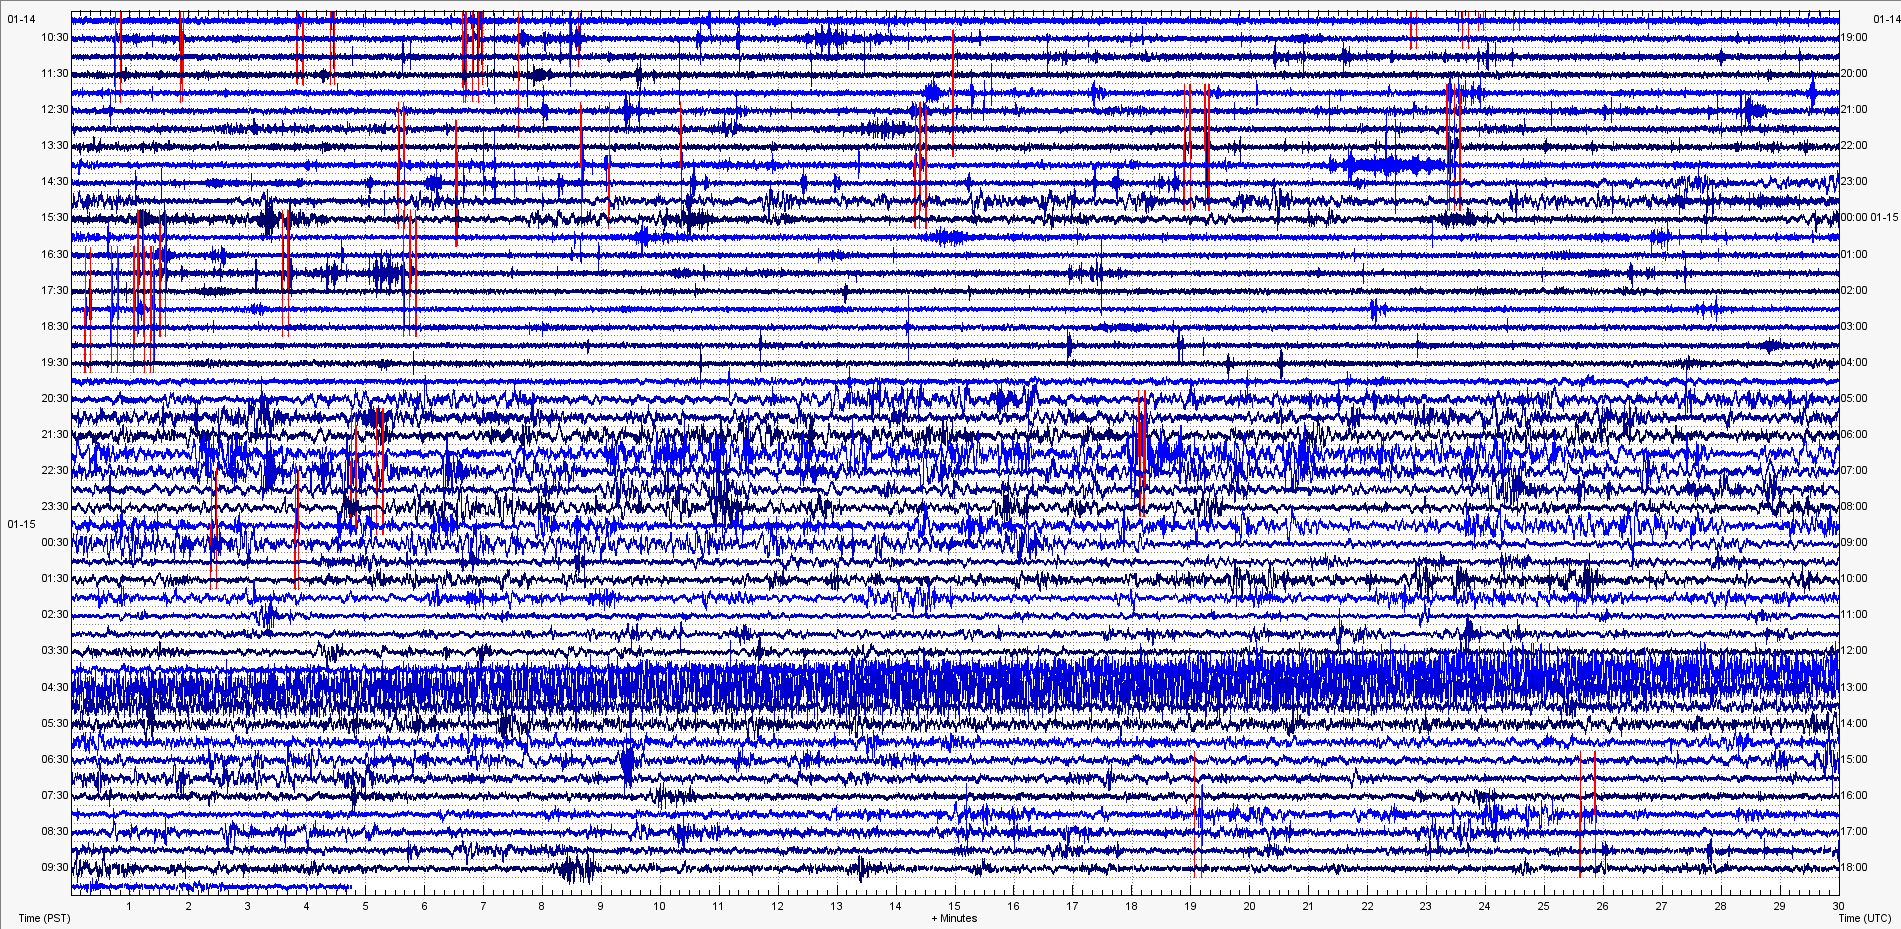
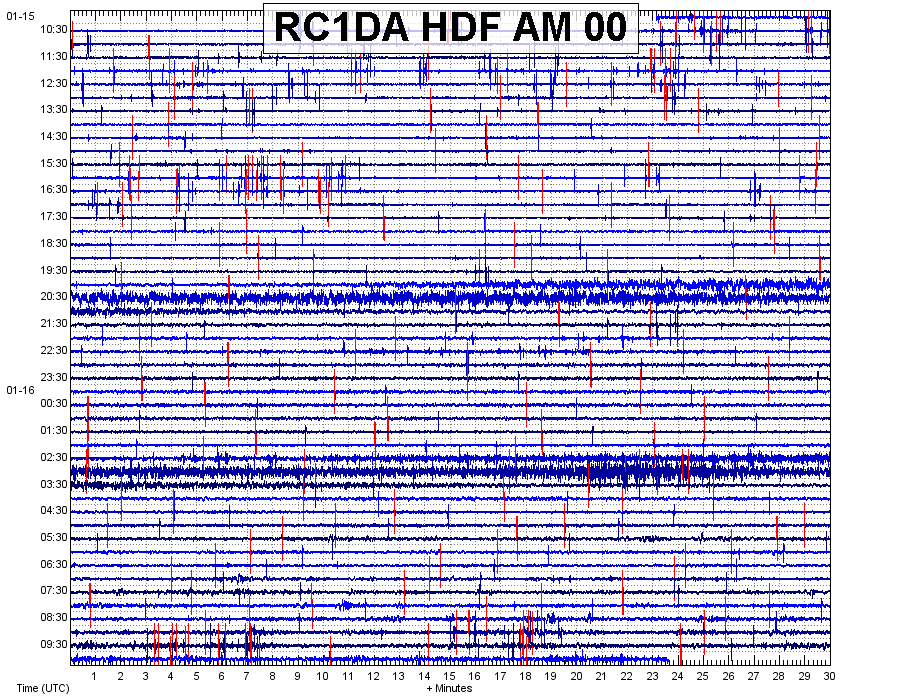
Here is a view of the 1/15 and 1/16:
And only the 1/16

-Steve
RS4D RD29A
RBOOM R2BFC
Chino Hills, Ca
2 Likes
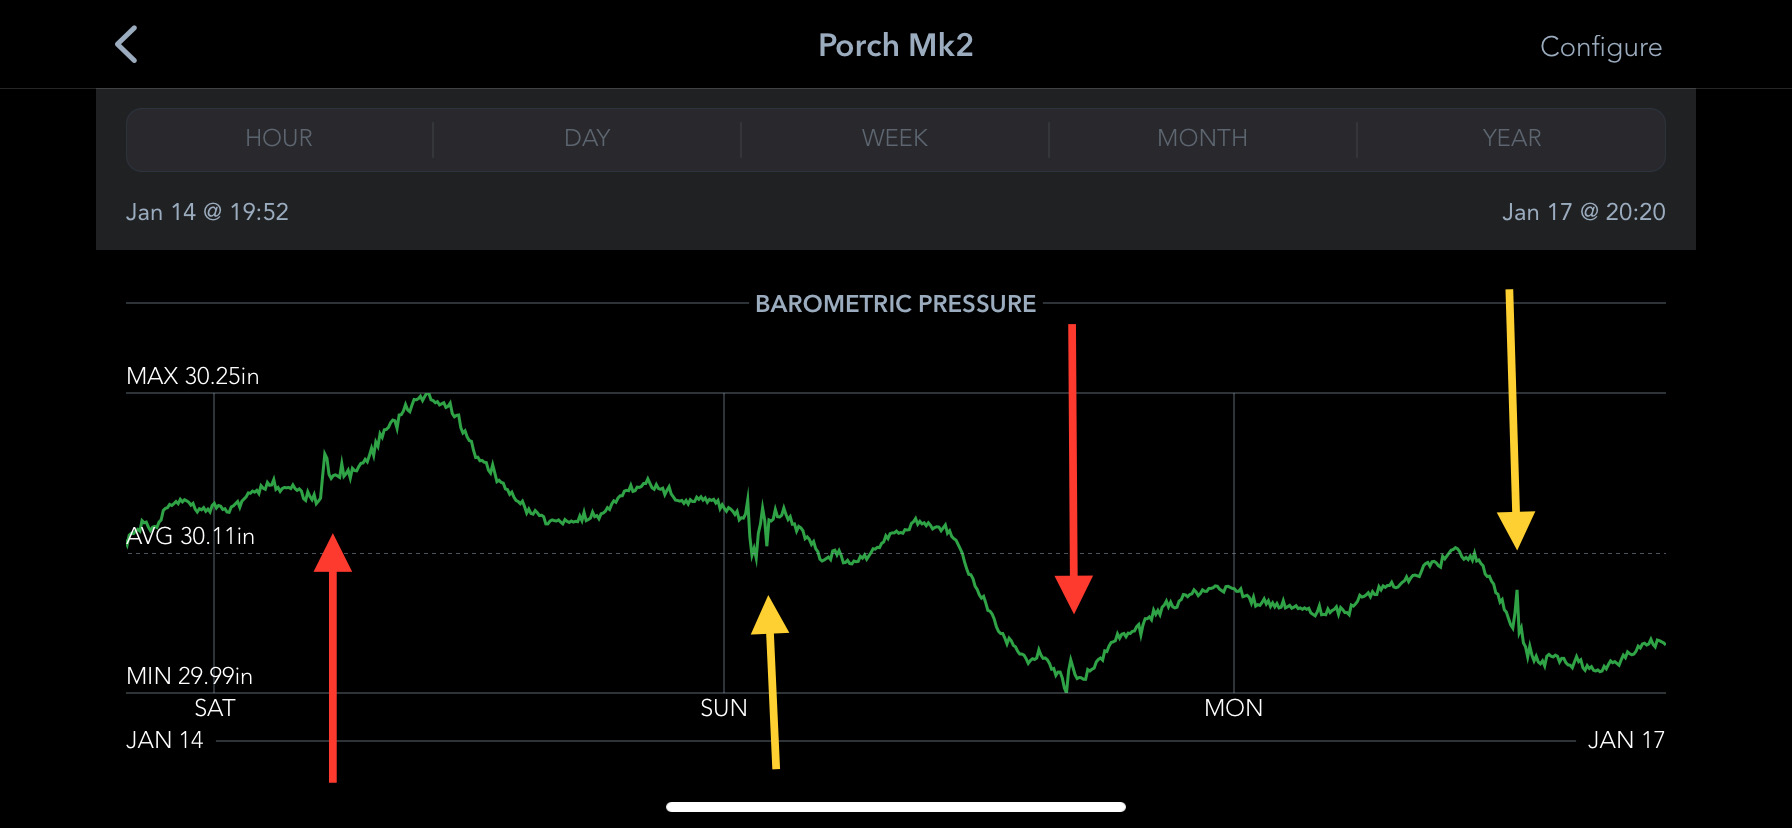
Haven’t seen any noticeable infrasound readings past the initial wave coming from the opposite direction, but the pressure bumps continue. The second lap of the wave from the west arrived in 35 hours, about 36 hours past the wave from the east there was another conspicuous blip- a bit slower but that would still be around 700 mph around the world. I was waiting for it too, it was dead calm and clear outside, nothing else changed
Red- West to East Wave, Yellow- East to West Wave
I’ve read they measured Krakatoa’s blast lapping the world 7 times (4 one way, 3 the other), that was with 1880’s gear. These modern readings are already tinier than I think you could sus out of a traditional barograph, but dunno
2 Likes
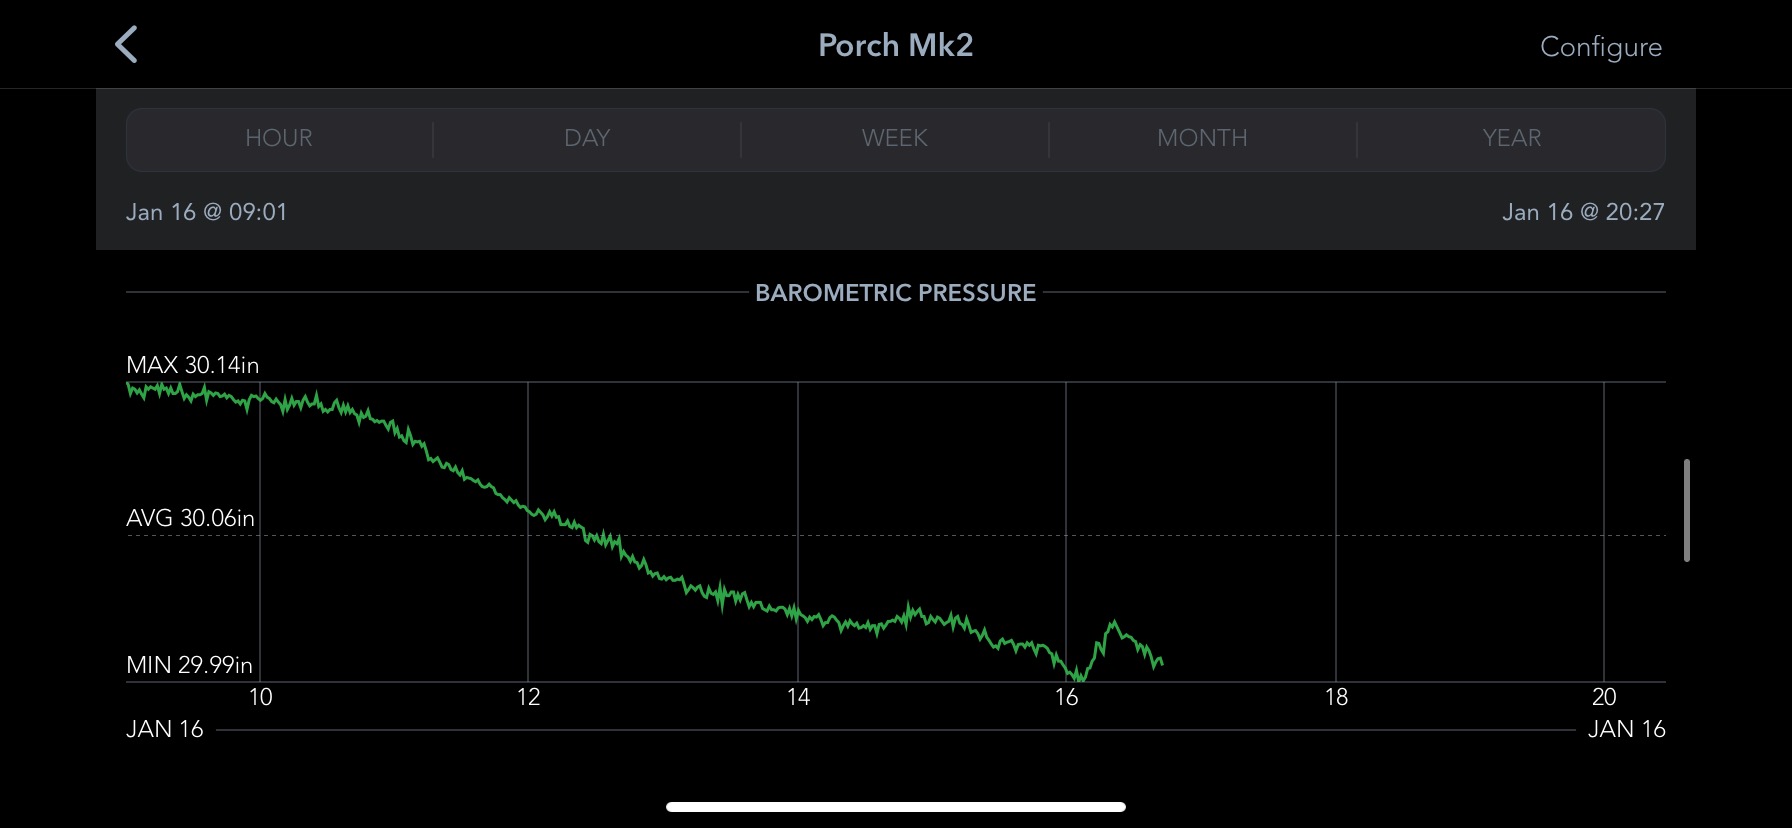
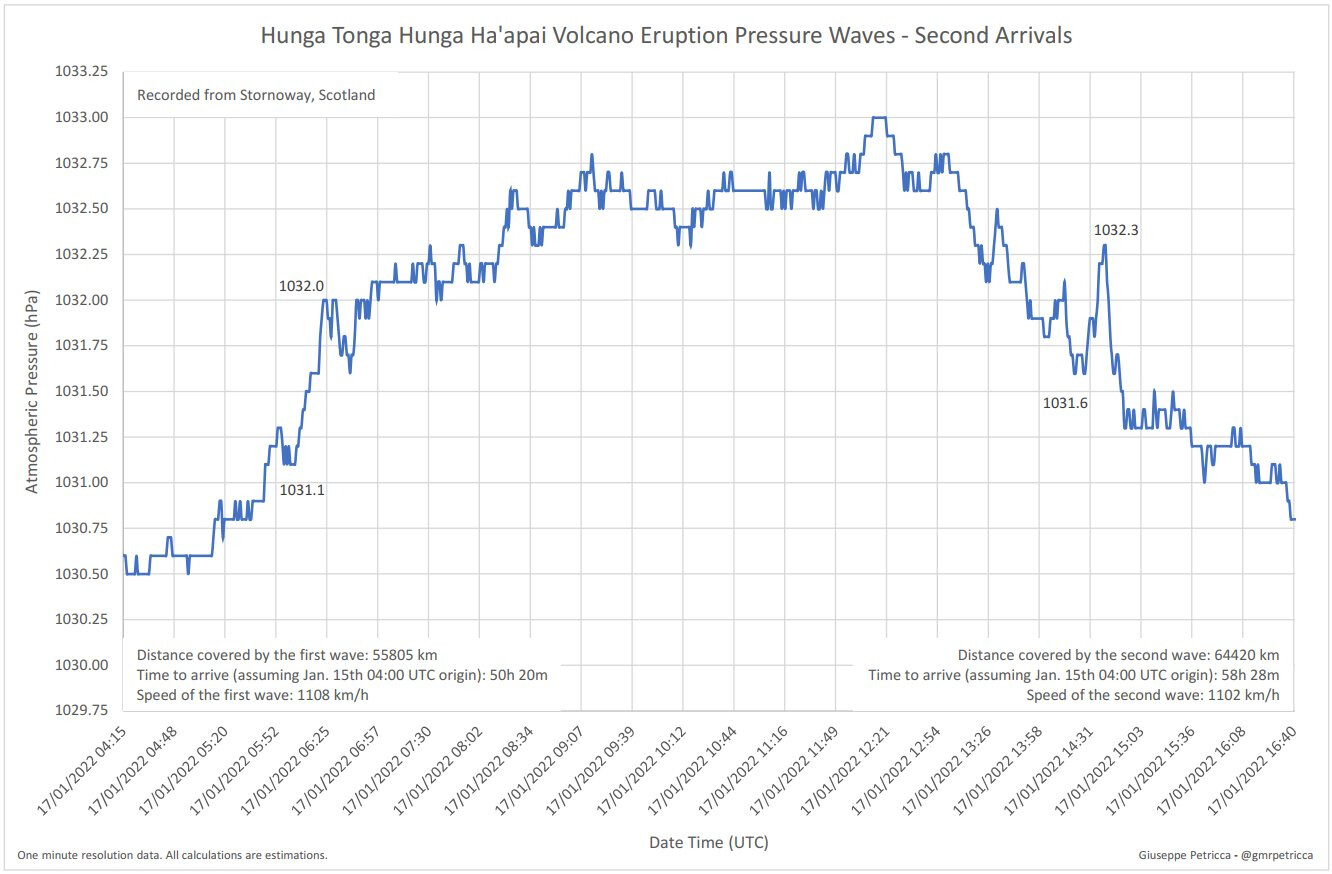
I was able to detect the second arrivals of the two waves too on my weather station barometer, but the infrasound data did not display relevant signals, especially if compared to the evident arrival of the first two waves.
Waiting for the fifth and sixth arrivals here around 6 pm this evening and during nighttime, but I feel that these should be harder to detect, since the original wave is dissipating. Curious to see what will be recorded anyway.
1 Like