Hi there!
I just wanted to know if data from the RS4D can provide any information on the shaking intensity experienced following earthquakes that are felt and recorded by the instrument.
Thank you!
Hi there!
I just wanted to know if data from the RS4D can provide any information on the shaking intensity experienced following earthquakes that are felt and recorded by the instrument.
Thank you!
Also, if a local minor earthquake is only recorded on the vertical component and not on the horizontal component does that have anything to do with it being felt or not?
Thanks.
Hi ![]() ,
,
Yes, the RS4D can provide data on shaking intensity during an earthquake, useful for assessing impact. If a minor earthquake is only recorded on the vertical component, it might be less noticeable, as humans are more sensitive to horizontal motion. Other factors, like depth, also play a role.
Hope this helps!
Hi!
Thank you, yes that makes sense. I have felt a few which were only recorded on the vertical component however they were very minor without a brief sound/rattle.
Regarding the intensity, how would I be able to determine intensities from my data?
Thank you
Our @sheeny has created some very useful Python programs (that you can find here: GitHub - sheeny72/RPiSandB: Python programs for Raspberry Shake and Boom seismometers and infrasound detectors.), and there is one to estimate the magnitude of earthquakes that may be very small and thus not reported by agencies.
It may be what you are looking for.
P.s. Welcome to the community elijahross!
Hi!
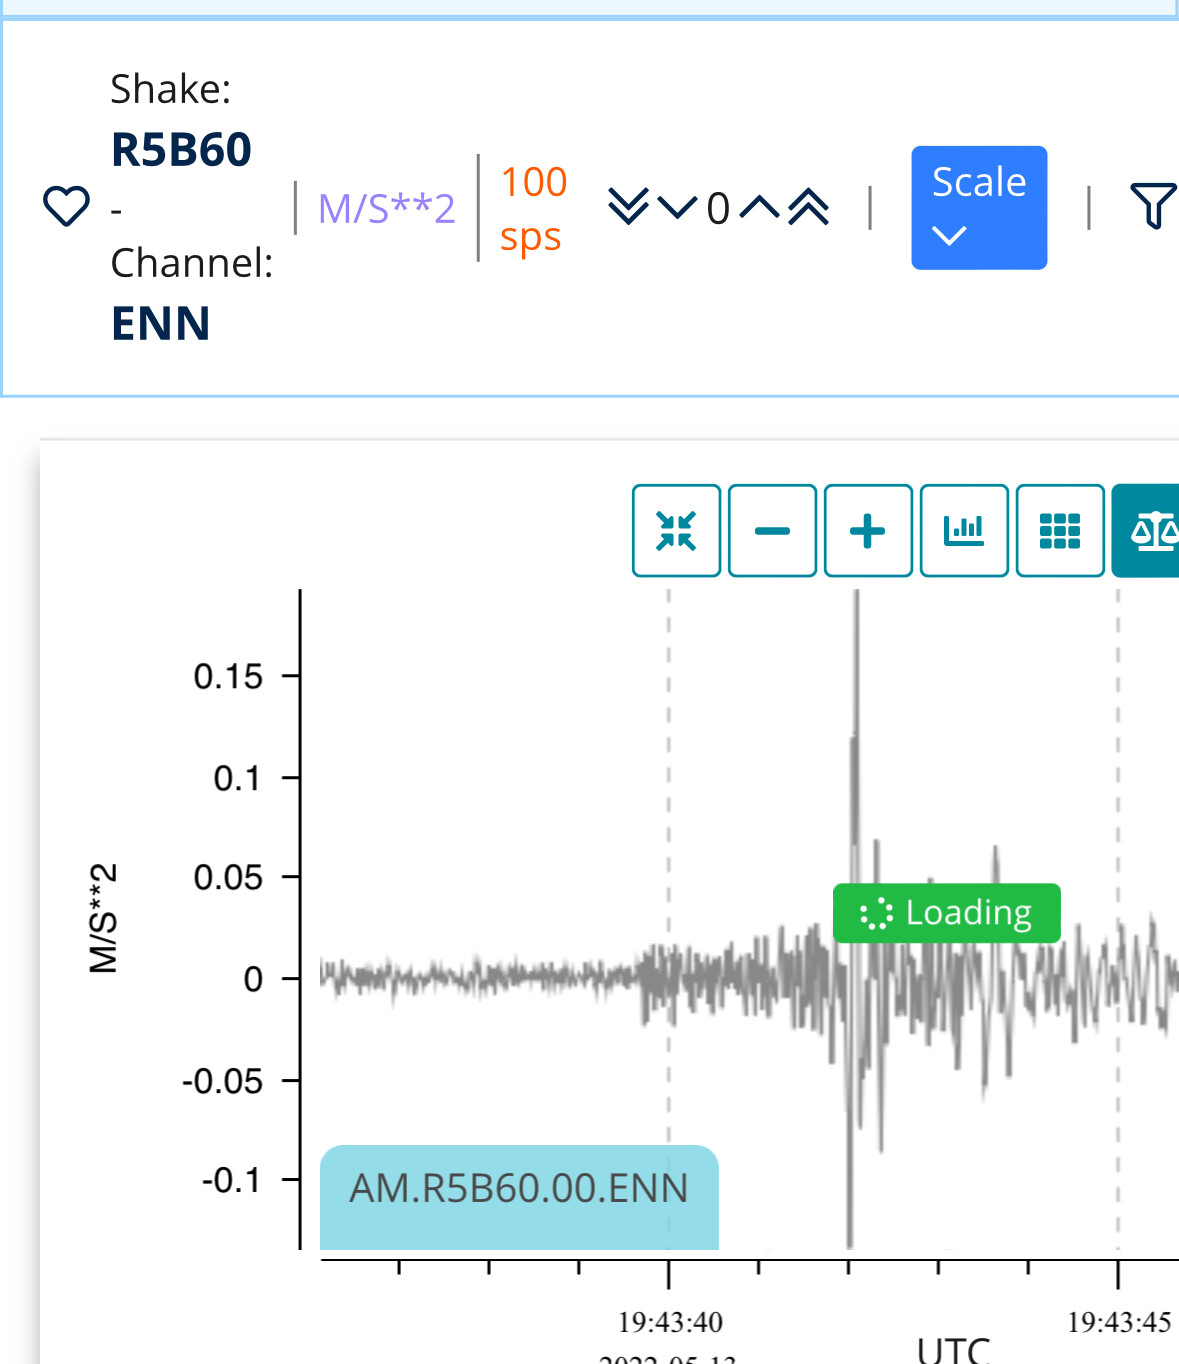
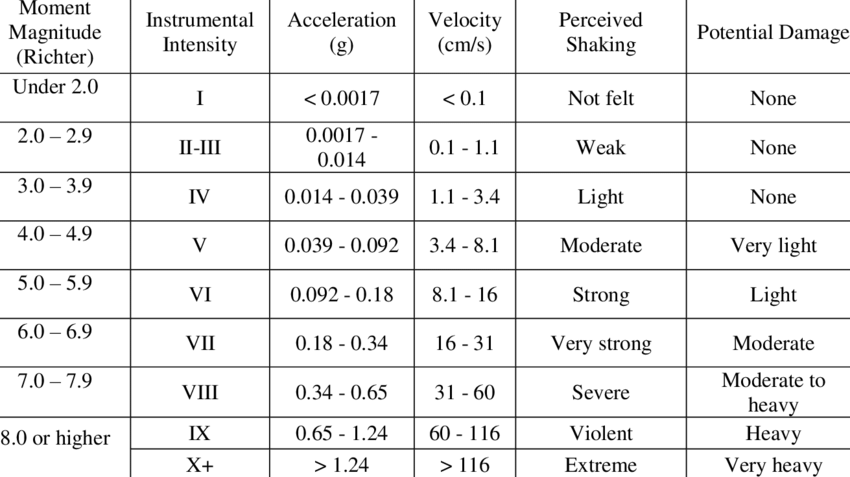
Thanks for that. I was more after how to interpret MMI intensity of a felt event. I think I understand now, correct me if I am wrong. I have attached an image of an earthquake that was felt by me and from the ENN channel we see the displacement was around 0.15m/s^2. So if we convert this to g unit that’s about 0.015g. By looking at the MMI scale and its corresponding acceleration values this would represent an intensity of MMI 4. So is this an accurate method of using data from the horizontal channels to understand the intensity of shaking experienced?
Thank you very much for all the help.
No trouble at all.
Yes, this could be right as a general estimation. Horizontal channels are more receptive to the lateral shaking that people feel during an earthquake, which makes them useful for studying the intensity and impact of ground shaking at the surface rather than directly estimating magnitude.
Horizontal components often exhibit larger amplitudes for surface waves (S-waves and Rayleigh waves), which are more relevant for evaluating the effects of an earthquake on structures and populations.
However, to obtain a more precise magnitude value, it’s recommended to use vertical channels (https://web.ics.purdue.edu/braile/edumod/as1lessons/magnitude/CalcMagnElect.pdf). These channels are generally preferred, as they are typically less affected by near-surface conditions and provide a clearer record of P-wave arrivals.
For more precise calculations, integrating the three-component displacement time series of that specific earthquake using data from all three channels (Earthquake Magnitude Estimation from High-Rate GNSS Data: A Case Study of the 2021 Mw 7.3 Maduo Earthquake) is also recommended.
I think there was something about this on the IRIS website, but I couldn’t find it again. I’ll leave the links below in case you want to try a search yourself:
Thank you for this!
For these events I know the magnitude, so I was just more interested in knowing a bit more about the intensity. Is there a way I can get a more precise reading on the M/S^2 value? For example, in the image from the first post it shows 0.15 on the y-axis but it seems to go a bit above this - how can I find out the exact value?
Thank you.
Hello VS1, you’re more than welcome!
Finding the max value on the zoomed helicorder plot is not (yet) available as a feature, but it’s an excellent suggestion! I’ll pass it on to our software team so they can see if it can be added.
For now, you could reanalyze that trace portion using software allowing you to zoom more or adjust the resolution of the y-axis (I don’t remember if SWARM could do so). Or, you could use a simple code like the one below to read data from your Shake in Python (using ObsPy) and then plot the min/max values for a specific channel (ENN in this case) in a specific timeframe:
from obspy import UTCDateTime
from obspy.clients.fdsn import Client

network = "AM"
station = "R5B60"
location = "00"
channels = ["ENN"]

start_time = UTCDateTime("2022-05-13T19:43:00")
end_time = UTCDateTime("2022-05-13T19:44:00")

client = Client("RASPISHAKE")

min_max_values = {}

for channel in channels:
    try:
        st = client.get_waveforms(network, station, location, channel, start_time, end_time)

        st.attach_response(client.get_stations(network=network, station=station, location=location, channel=channel,
                                               starttime=start_time, endtime=end_time, level="response"))

        st.remove_response(output="ACC")

        min_val = float("inf")
        max_val = float("-inf")

        for tr in st:
            data_min = tr.data.min()
            data_max = tr.data.max()
            min_val = min(min_val, data_min)
            max_val = max(max_val, data_max)

        units = "m/s" if "VEL" in st[0].stats.processing[-1] else "m/s²"
        min_max_values[channel] = {
            'min': round(min_val, 3),
            'max': round(max_val, 3),
            'units': units
        }

    except Exception as e:
        print(f"Error retrieving data for channel {channel}: {e}")

for channel, values in min_max_values.items():
    print(f"Channel {channel}: Min = {values['min']} {values['units']}, Max = {values['max']} {values['units']}")
In your case, the code outputs:
Channel ENN: Min = -0.136 m/s², Max = 0.202 m/s²
If I can help with anything else, let me know.
Thank you so much! This helps a lot.
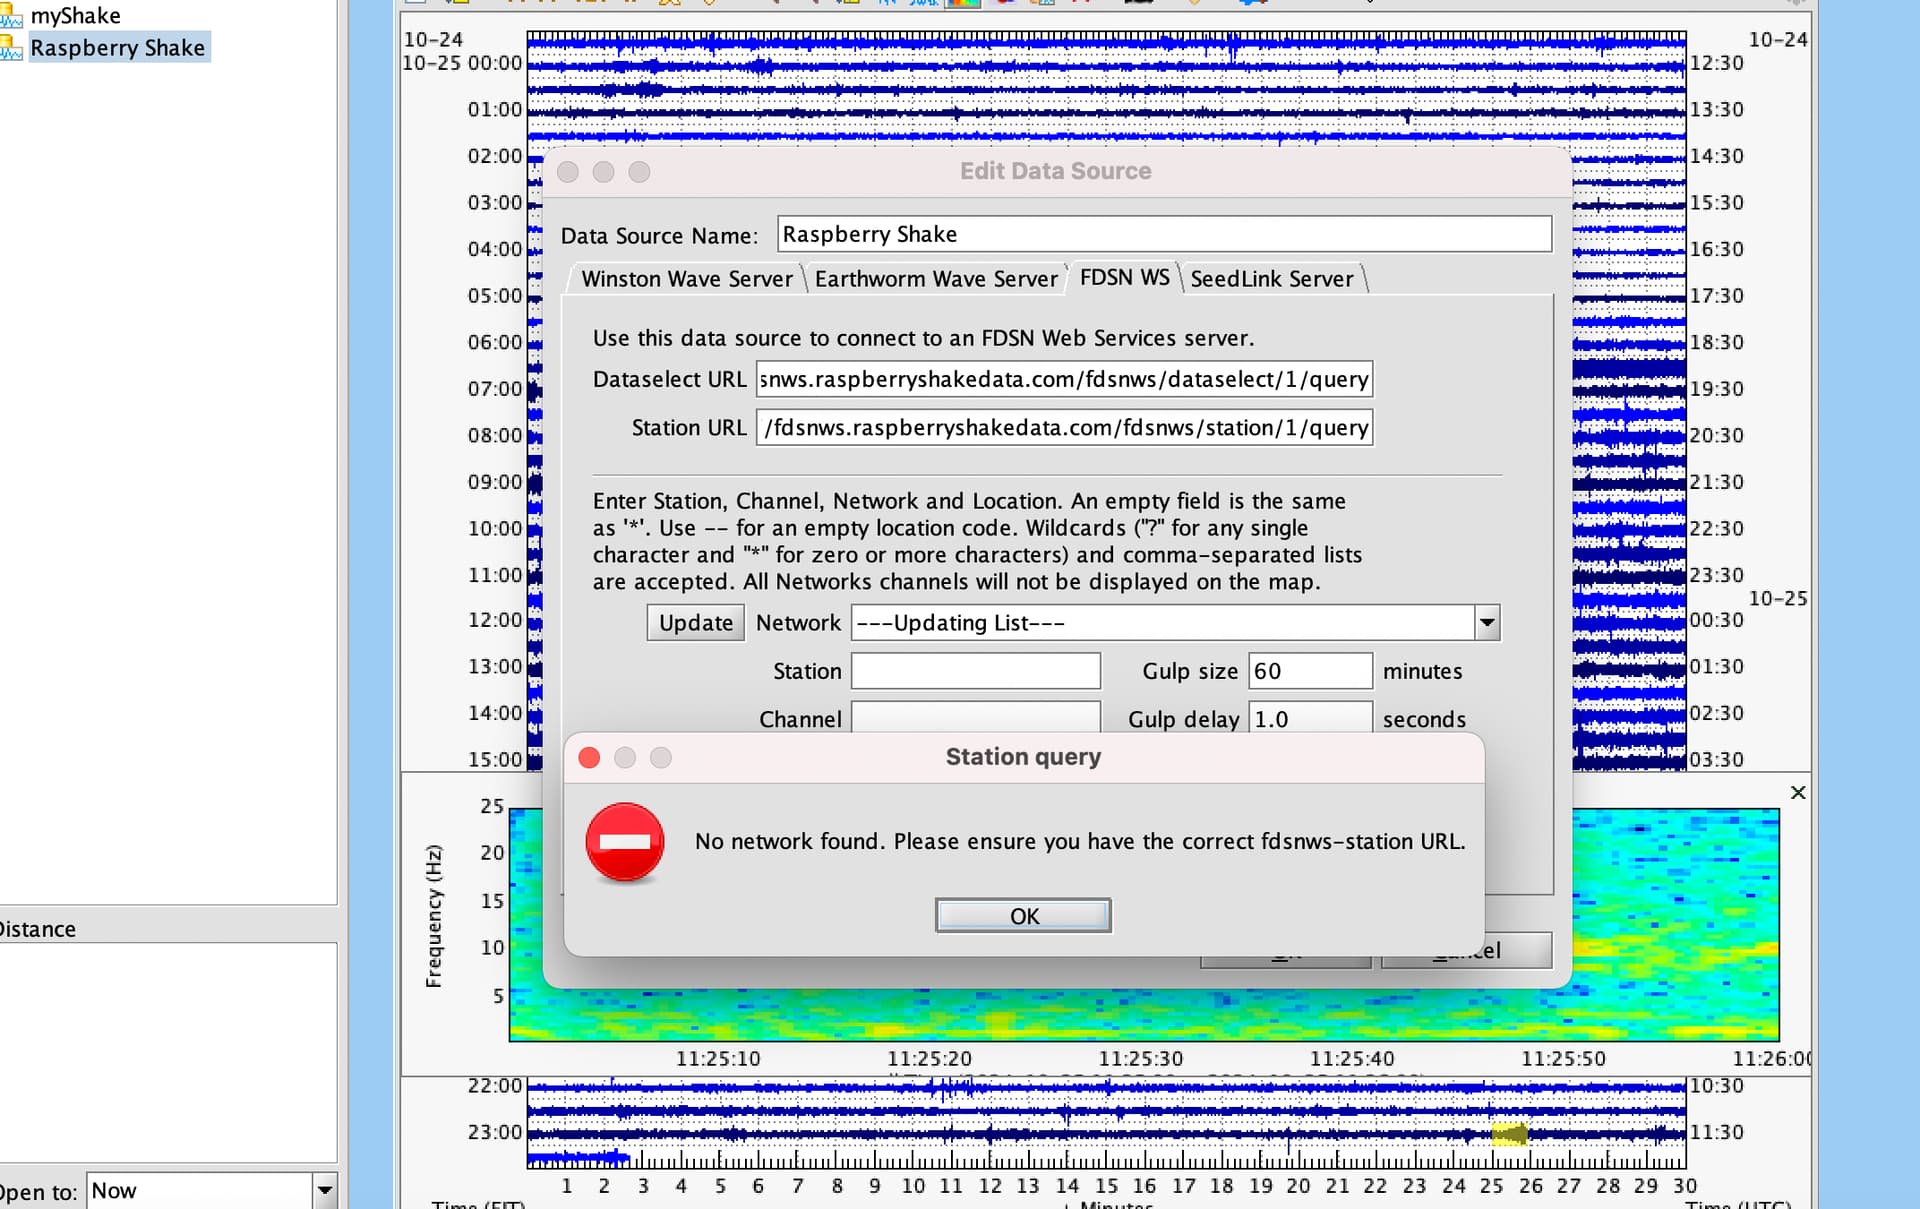
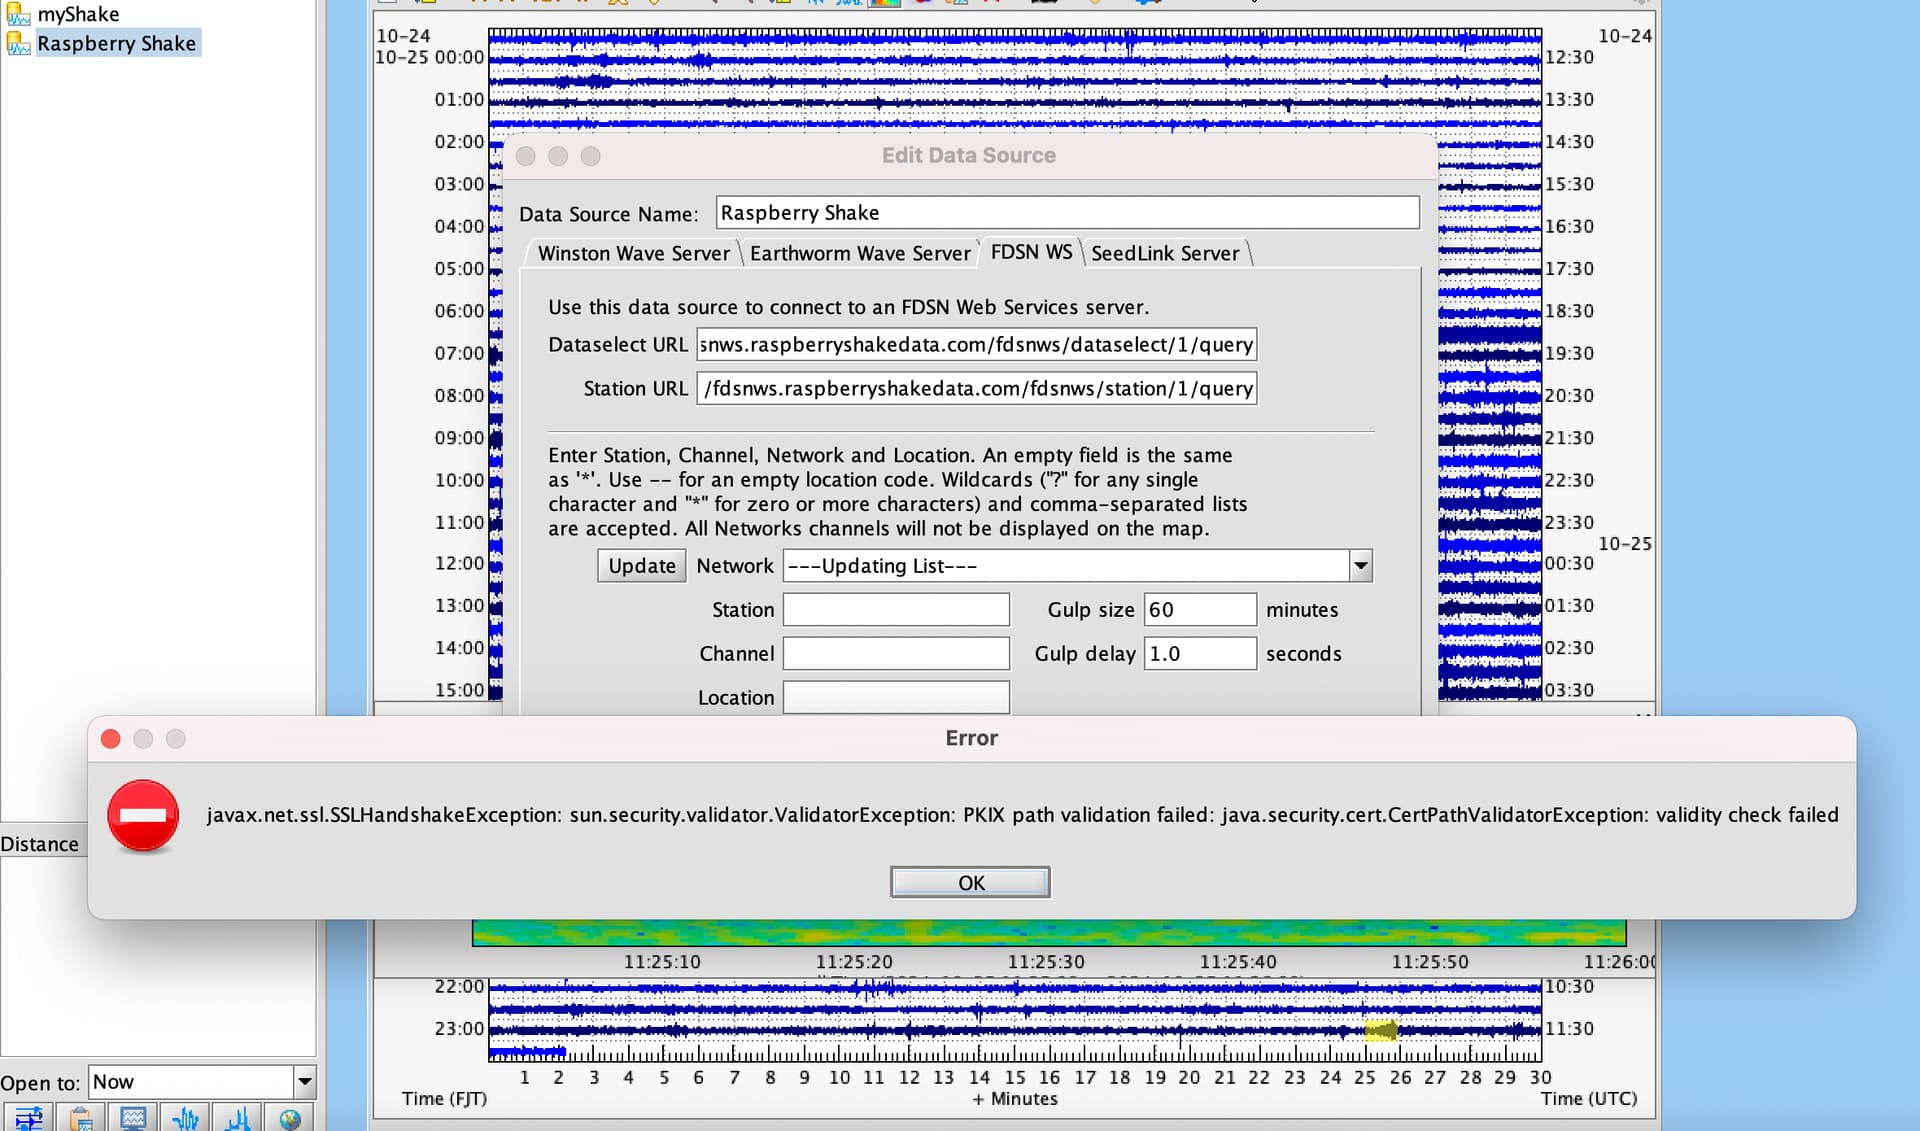
One more thing, on SWARM I am not able to access other Raspberry Shakes, so as per your instructions in another thread, I edited data source and followed the instructions under FDSN WS tab but it still does not work when I press update. I have attached the message I receive. Once I press “OK” it says no network found.
You’re very welcome!
Ah yes, this is related to our server upgrades that we did some months ago. You can find all the details on how to update your SWARM configuration here: Raspberry Shake Data Access
After this, you should not see that error anymore. In case you do, let me know.
Hi there, I am still having this issue. When I click ‘edit data source’, which tab do I select? Is it FDSN WS? Would you be able to guide me please?
Thank you.
Hello VS1, no trouble at all!
You can configure your Winston Wave Server on SWARM in this way:
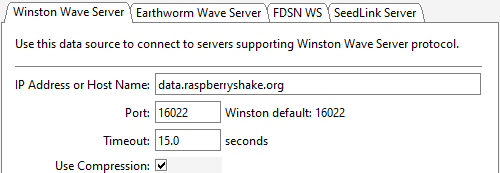
And you’ll get much faster responses than FDSNWS, accessing the same list of stations (all our online network).