I am starting in the world of programming and I would love to turn on an LED when the sensor exceeds the limit, what I have seen is that I need a library for the sensors, however I cannot find it.
Does anyone know how to get that data and print it?
Well, I was able to print the data of each channel from the RS4D, however what I want to do is make that data be as the final data of STA/LTA, as RSUDP does, however I don’t know how to convert the data of the channels.
import socket as s
with open('/opt/settings/sys/ip.txt', 'r') as file:
    host = file.read().strip()

port = 8888                             # Port to bind to
sock = s.socket(s.AF_INET, s.SOCK_DGRAM | s.SO_REUSEADDR)
sock.bind((host, port))
print "Waiting for data on Port:", port
while 1:                                # loop forever
    data, addr = sock.recvfrom(1024)    # wait to receive data
    print data
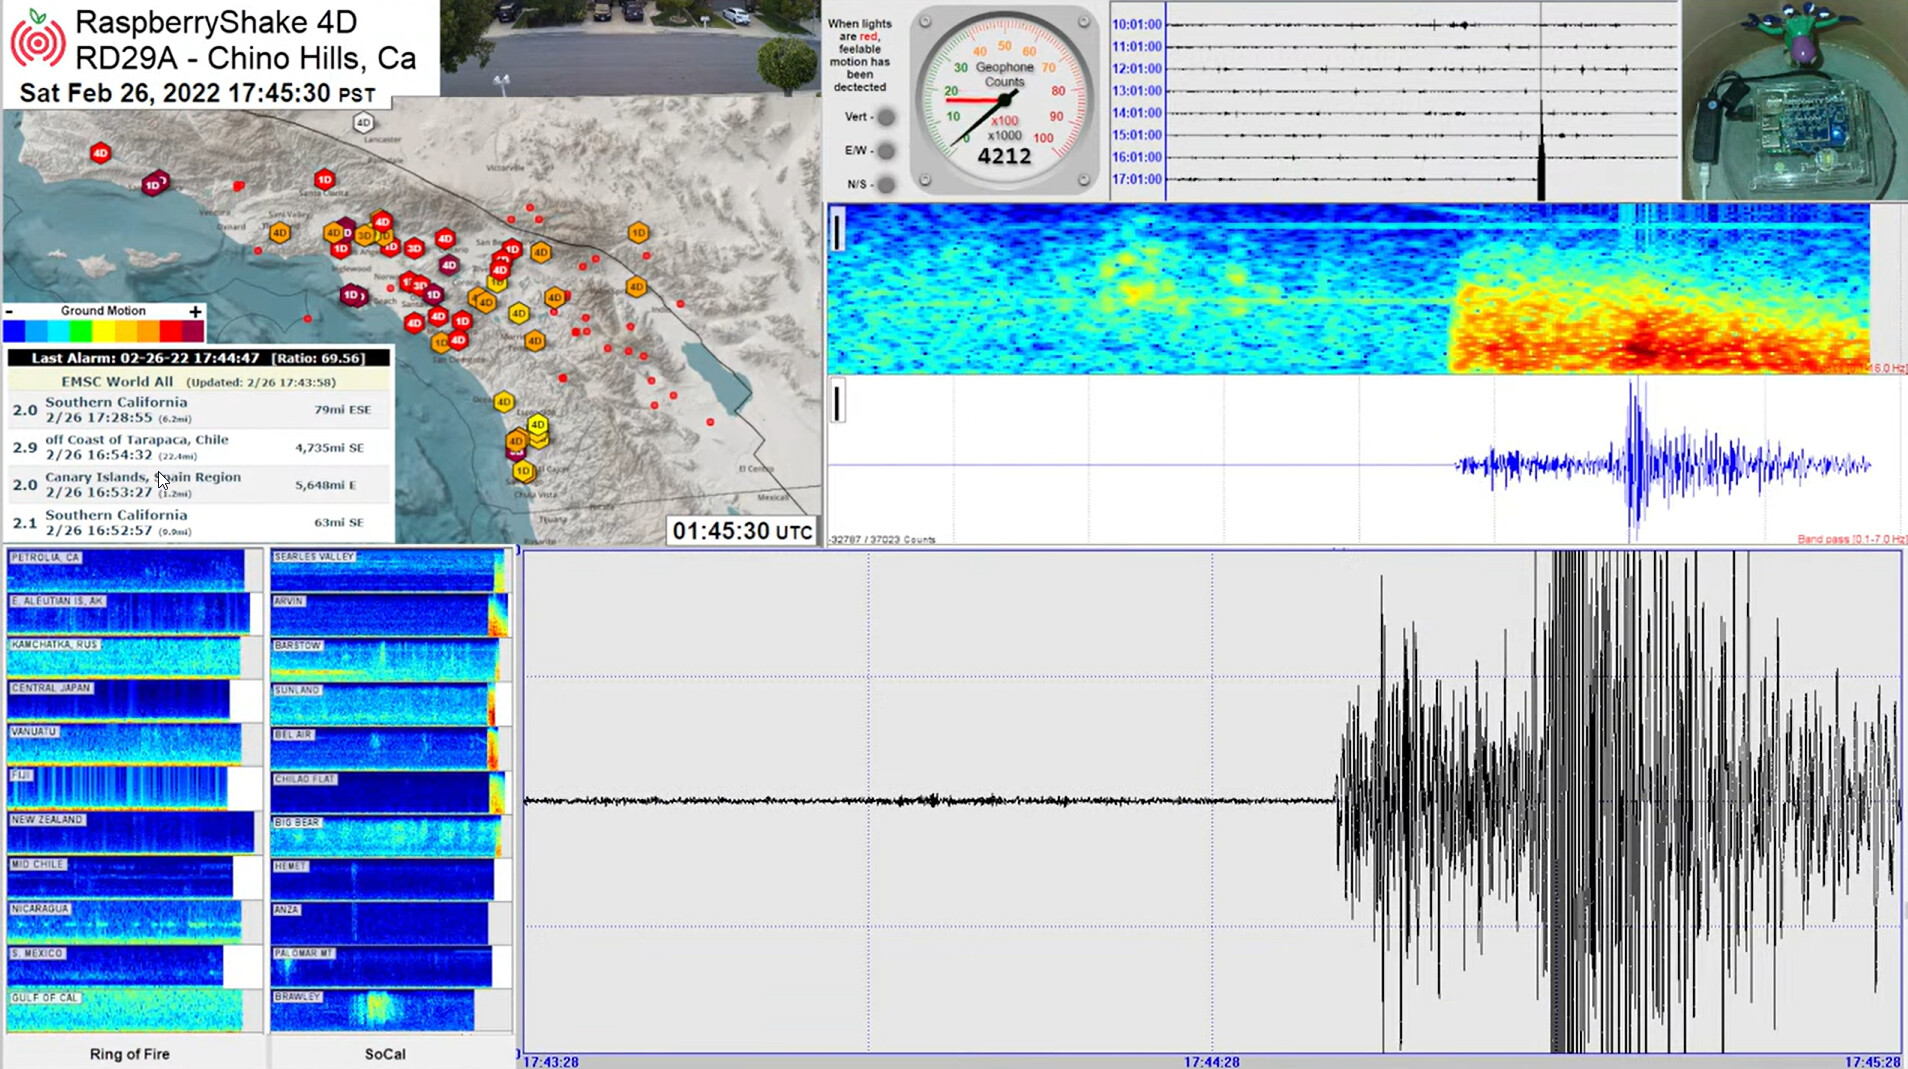
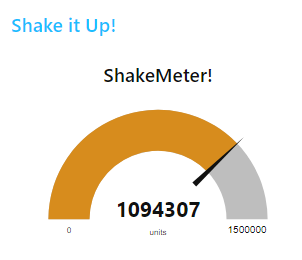
As Stormchaser mentioned I do have led lights. They are all virtual LEDs, however. The Led’s light when a certain value is reached on each of the accelerometers. I have a gauge displaying the current values from the geophone. The code is based on the Node-Red code Stormchaser mentioned from T3 Alliance using the udp output of the Shake.
Thank you for your input Steve, and your new gauges are looking really good!
You can use these two pages on our manual to remove the response of the instrument and to convert the raw counts coming from the Shake to metric units.
hello scaron
I have followed your project and also tried to do the same, only that I had problems when trying to follow the tutorials, and installing node-red in RS4D has been a headache.
A little before posting here, I tried the same thing to do the calculation, I see that it uses the c_alert.py and raspberrysahke.py files, however the code also confused me a lot.
Could you help me a little in the part you did about the part you commented on the matrices and your calculation, please?
In node-red I already did the dashboard thing, with the gauge, but it gives me quite high values.
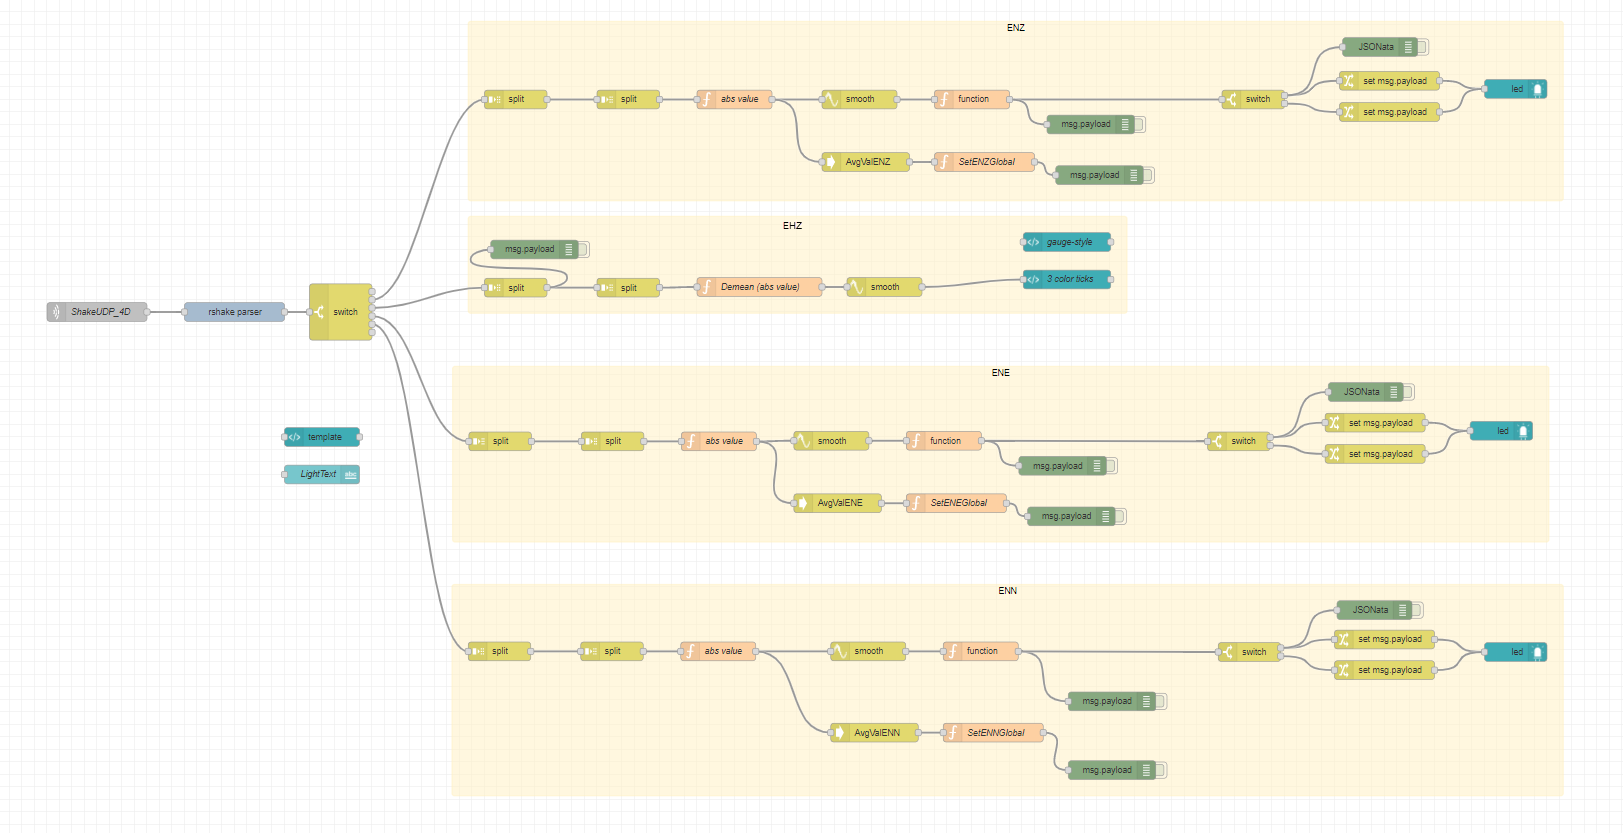
I am not sure what matrices calculations you are referring to. I will attach my node-red flow. Maybe you can take look and see the calculations I used. The EHZ potion is the part to look at.
Good evening scaron, thank you very much for the info, to a certain extent it did help me.
In the end, what I will try is to change the digital lights to activate the GPIOs of the raspberry, even so I have another detail, I would also love to send an audio, do you think you can help me with that?, maybe in a more local way, maybe some programming so that it can be executed from the raspberry, do you have an email so I can communicate with you and give you more details?
Is there also a node-red flow available for the RS&BOOM? I like to extend that existing flow with the infrasound monitor. Does somebody have some examples?
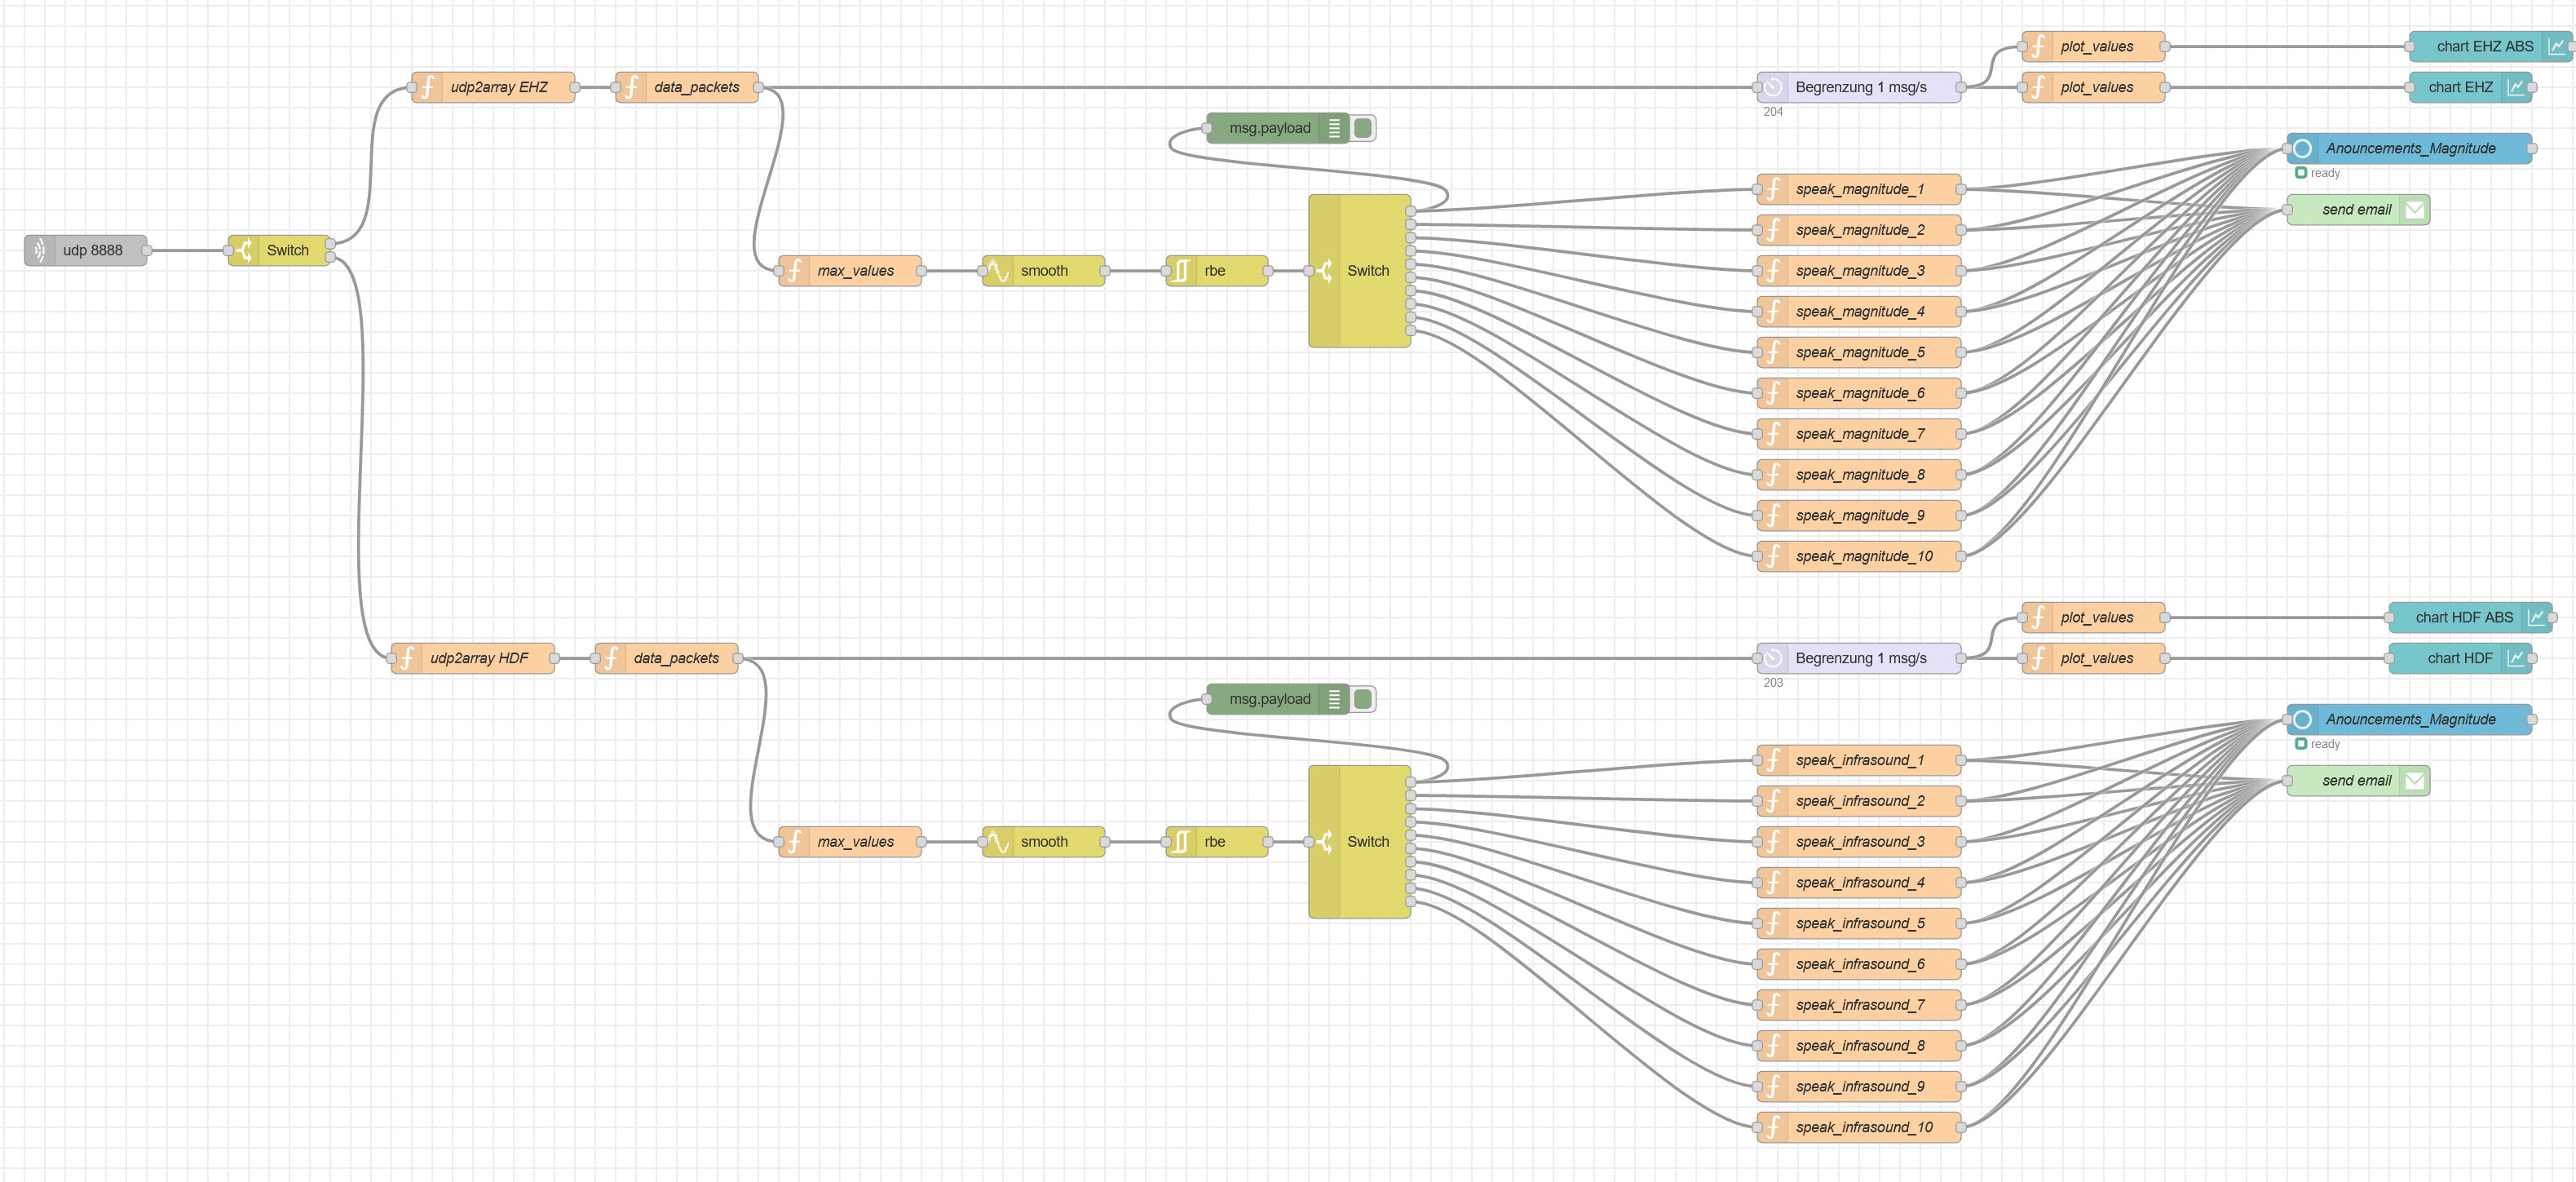
I just did a node-red workflow for the RS&BOOM also integrated with Amazon Alexa voice announcements if an earthquake is occuring. node-red-RSBOOM.txt (20.4 KB)
Does somebody knowing the exact calculation of m/s to magnitude? On the swich I added some example values for testing.
Thank you for sharing your NodeRED flow chart and code with the community!
Well, you can try to get an estimation using the old Richter magnitude formulae, of which you can find a collection here: Richter magnitude scale - Wikipedia