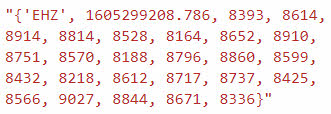
If I understand correctly, the UDP outputs counts. However, it seems like the counts value is too high. The UDP value is around 8,600 when I am seing around 600 to 1,000 in SWARM.
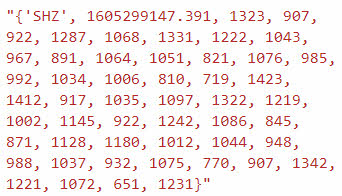
Strangely, if the same UDP feed is used with RSUDP, RSUDP shows a count value in line with SWARM (approx 1,000). I also did a test reading the datacast from my first gen shake1D with Node-Red and values were in the expected range of 800 to 1,200 counts.
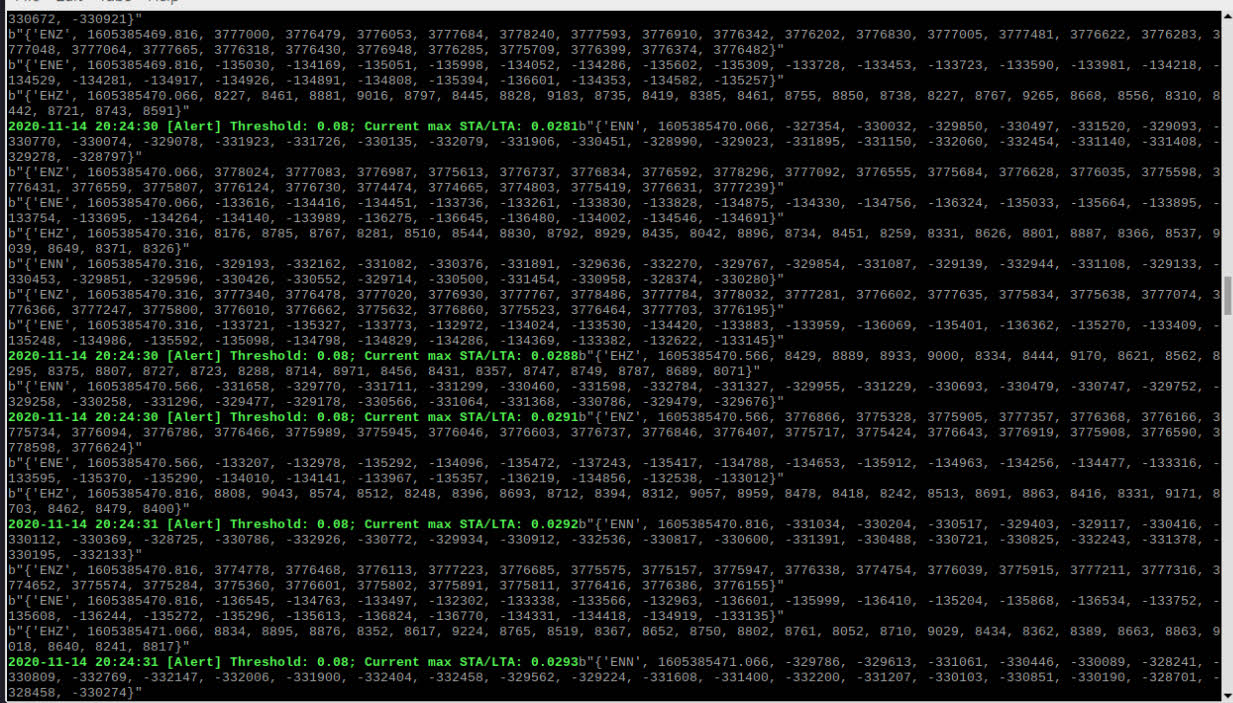
I checked the output before and after rshake parser. Both times counts were around 8,600.
Is this expected or is Nose-Red reading the 4D’s UDP output incorrectly?
Thanks,
Steve
RD29A
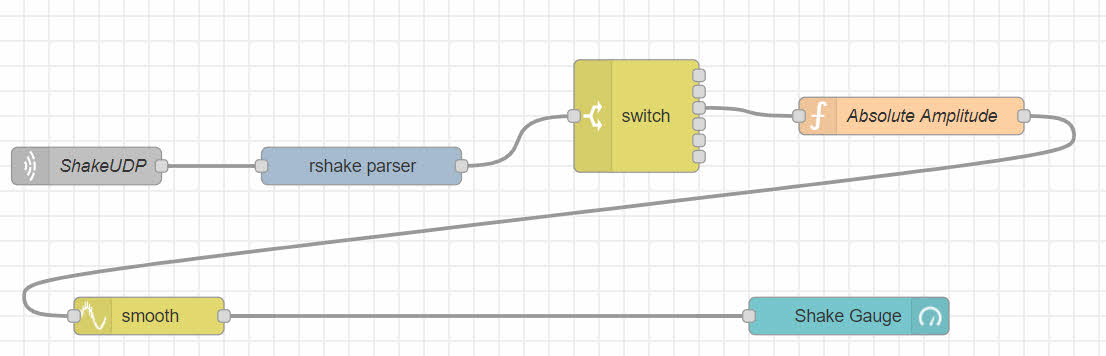
Attaching images of RSUDP, Node-Red UDP debug output for the 4D and 1D, and the Nose-Red flow am using.
To confirm, yes, the output is in counts, which is (as I am sure you already know) a unitless number that is essentially an analogue for the amount of voltage on the circuit of the given channel at the given time.
Furthermore, the geophone for the EHZ channel in the RS4D is the same model of the RS1D, so I don’t think that that could be the cause of the high values:
Single-component 4.5 Hz 395 Ohm vertical Racotech RGI-20DX geophone with electronic extension to lower frequencies (<1 Hz)
as it is possible to see from both our Technical Sheets:
Thus, I think that since your RS1D is working fine with this addon, the issue could be in their coding interpretation of the UDP datacast. Evidently, the 4D is read in a somewhat different manner compared to the 1D (which is also the one they used in the examples on their website) since, both in RSUDP and SWARM, the count value shows more realistic values.
I encourage you to write to them, if you haven’t already done this, asking if they have tested it for a 4D (or even a 3D, to see if there are discrepancies there too), and see what they say on the matter.
Thanks for the quick response and information. I am still confused on this one issue, however. Look at the problem without any Node-Red pieces.
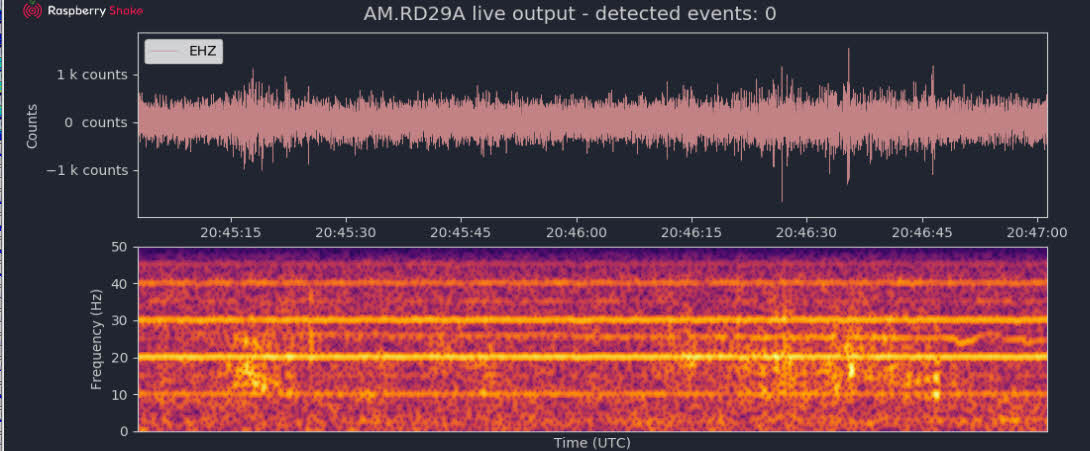
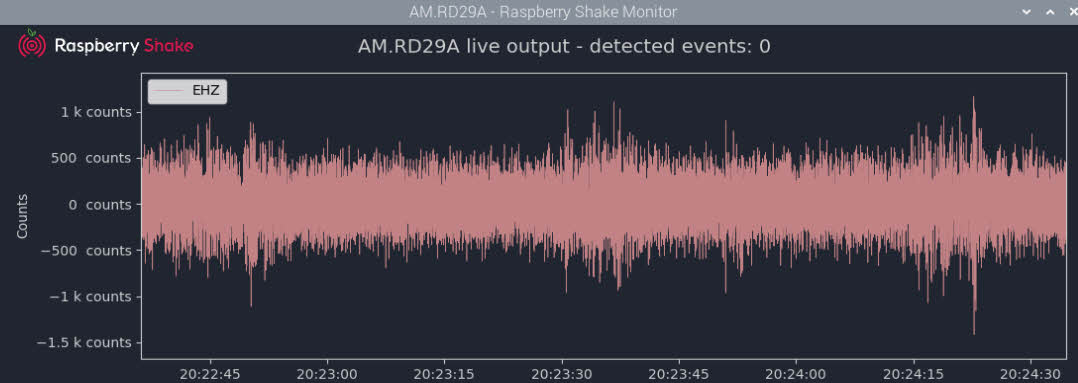
In RSUDP I set Printdata to ‘True’ to output the data RSUDP is consuming. Notice, the 8,000 range values for EHZ. However, the plot displayed by RSUPD is showing the expected count values in the 500 to 1,000 range.
Is RSUDP doing a calculation on the packets received to produce the counts that are displayed on the RSUDP plot?
Yes, I had noticed it too. This happens because the raw data flowing from the RS4D Shake has not been demeaned yet, which is part of the calculations that RSUPD does before showing the live output.
Now, for the differences between the RS4D and the RS1D outputs, I am not 100% sure, but I can say that they are probably related to the fact that the geophone of the first works at a different sampling rate (100 sps) compared to the one of the second (50 sps).
That is too bad the raw values can not be used without being processed. I tried to figure out what calculation was being applied in RSUDP, but I was getting lost in the code
Is there a possibility, the calculation can be provided to see if I can apply it to my Node-Red project?
Well, even in Obspy or SWARM processing is needed, otherwise we have an amount of data that is difficult to understand. And we didn’t even touch filtering them
I don’t think that we have it clear on the documentation. However, I’ll look into it tomorrow, and if I’ll find it I’ll send a message to you.
I had a ‘light bulb’ moment tonight. I was looking my Shake’s recording of the Mina, NV 5.3 in SWARM. By clicking and unclicking the ‘remove bias’ option, I realized how the 8600 value was being added and removed from the waveform.
The 8600 appears to be the mean. As you mentioned earlier, I demeaned the values and I see values I expect now. I am actually taking the absolute value when removing the mean so the needle always moves in a positive direction.
I am not sure this is the best way to do it, but for what I need it appears to be working. I need to see how it performs when a quake comes thru to confirm. Even if the counts are not exact, it should be good enough for what I am looking to display. You can see the current values here: https://www.youtube.com/channel/UCAhqlmltCW94ipicG8X-oLw/live
I have a feeling RSUDP must be doing something similar.
I took me a little while, but thanks for guiding me to my discovery
It is no problem at all Steve, glad that you managed to work out a possible solution!
Maybe, after a testing period, you could rescale the circular gauge, since I think that now the max @ 100000 can be quite big to show the fainter movements detected by the Shake.
Nonetheless, I think that it is, as you say, good for what you want to display.
It performed pretty well. However, the values were lower than expected. This was because the calculation was taking the average value over 25 data points that were contained in an array. I split out the array and now it displays the actual value and not the average. So, I need another test now
Yeah, the scale is a bit high. I left it that way to show how high it has to be to start feeling motion. I probably need to lower it so the needle does not look stuck.
My next piece to add… I want to use accel channels data to trigger a motion indicator when they detect motion.
I would say that this is fantastic progress, congratulations Steve!
When all is completed, maybe (if you like to) you can write a good blog post for us describing how to set up such a display/streaming for Shake users who want to try the same! I think that many may be interested!
I finally recorded a quake that moved the meter to the red and turned on the acceleration channel lights (movement detected on the acceleration channels). It was not a lot of motion. I felt it just a little bit. So, the lights did not stay on long.
I will add the node-red code to this later this weekend for those interested. I need to clean up a little.