Hi,
Good to see that you have got everything up and running. The shakenet and swarm apps are both excellent for monitoring seismic activity. I have also started using the Dataview web app, which you can run from the Shaknet website (under web apps tab).
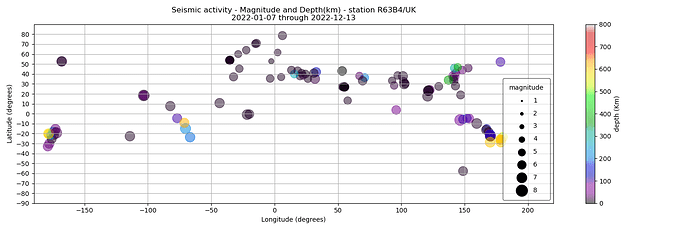
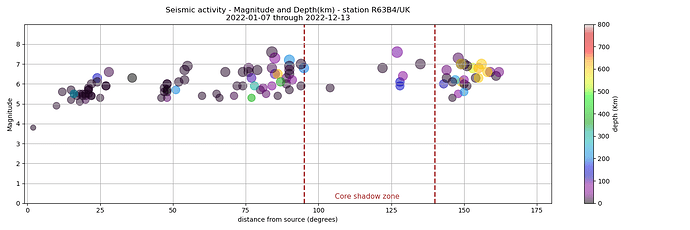
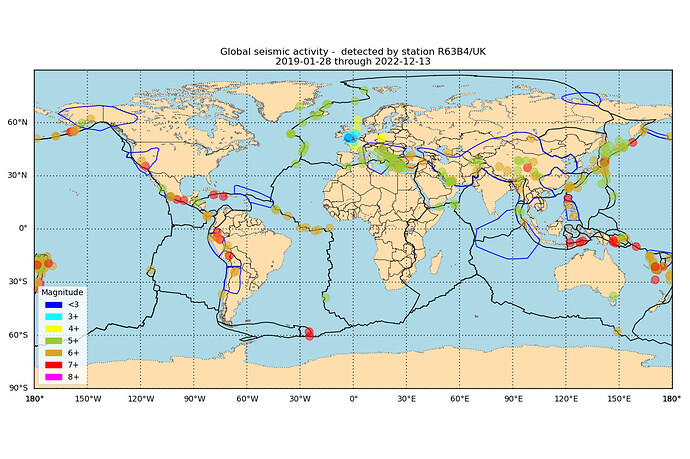
I have a geophysics background, although not in earthquake seismology. I’m afraid I don’t know of any specific books that I could recommend on the subject that are not technical. However, I would suggest that python might be a better option than Java for coding to view and analyse data files, as there are already python modules for doing this. I use ‘obspy’ for plotting dayplots and waveforms etc. The charts I posted previously were made using ‘matplotlib’. The global map was also generated using python.
It can be a little daunting to understand what the shaknet and other apps are showing you at first and how to discriminate between the various types of energy you are seeing. However, the various apps provide most of the tools you need to start to do this.
The ability to detect signs of earthquakes amongst all the other signals and noise, depends largely on where you are located in the world and how seismically active the region is. However, as I mentioned in my previous post, even for somewhere seismically quiet, it is still possible to detect their telltale characteristics. However, they maybe very small and seemingly insignificant against the background noise if arriving from a large distance.
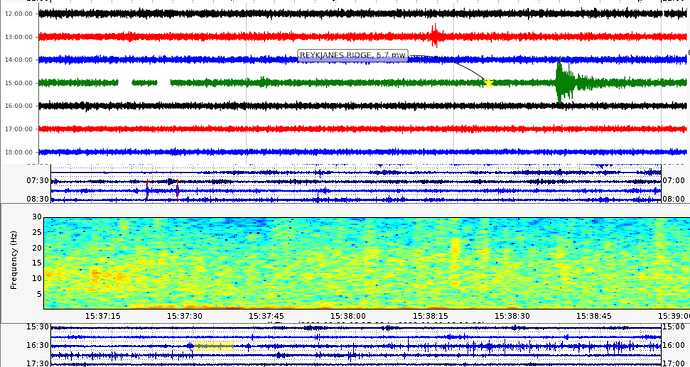
The example ‘obspy’ dayplot traces I posted previously (filtered to remove noise above 2Hz and annotated with the earthquake location and magnitude) had a very obvious signature. A sudden large kick as the P, S and surface waves arrived. The same event is shown on the spectra plot as a band of energy running along the base of the display, before gradually diminishing. The other more random features are local background noise. The small zone highlighted in yellow on the smaller scale ‘swarm’ dayplot traces, beneath the spectra, shows how insignificant the arrival was when compared to the background noise. The spectrum includes frequencies up to 30Hz.
I should mention that earthquake waves that arrive after travelling a large distance will be detected at very low frequencies, below 2 Hz. However, earthquakes originating from closer locations will include a much broader range of frequencies. See the the first example below.
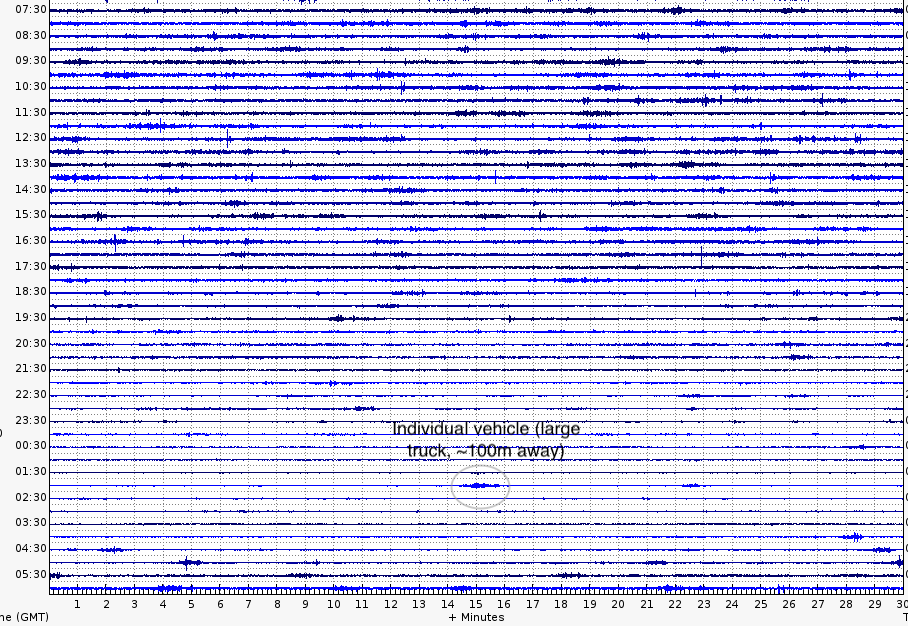
The second example highlights a difference in the level of local infrastructure/ human generated noise between daylight hours and night, which is often present close to more urban areas. Most of the features are cause by local road traffic. Individual vehicles can even be identified in the quieter periods.
Use the station view web app to see where earthquakes have occurred around the world. Generally the larger ones in my case. You can then use the other apps to scan through the trace and spectra displays for the event arriving at your Raspberry-shake. This may not occur for many minutes depending on how far away it occurred. A suitable candidate should hopefully appear as a higher amplitude band of energy or perhaps several pulses.
If you are located somewhere seismically active, then even mild tremors will likely stand out strongly against the background noise. Very strong events can even swamp the displays.
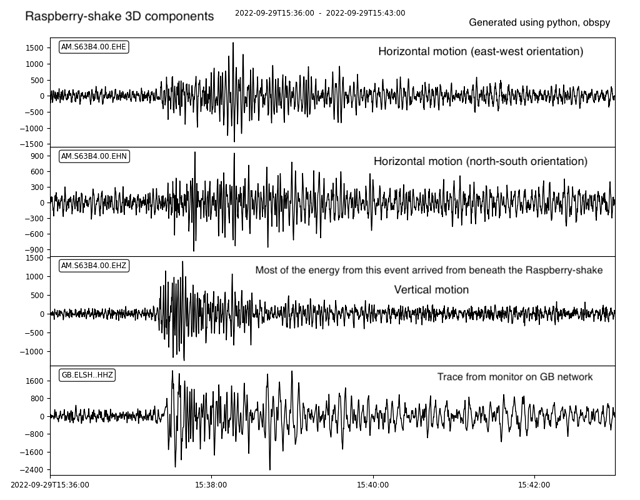
The Raspberry-shake 3D shows energy that arrives with vertical motion (Z), which may have even travelled down to the planets core on its path to your location. Surface waves from events that are closer, will be detected along either a north-south (N) or east-west (E) orientation. See third example.
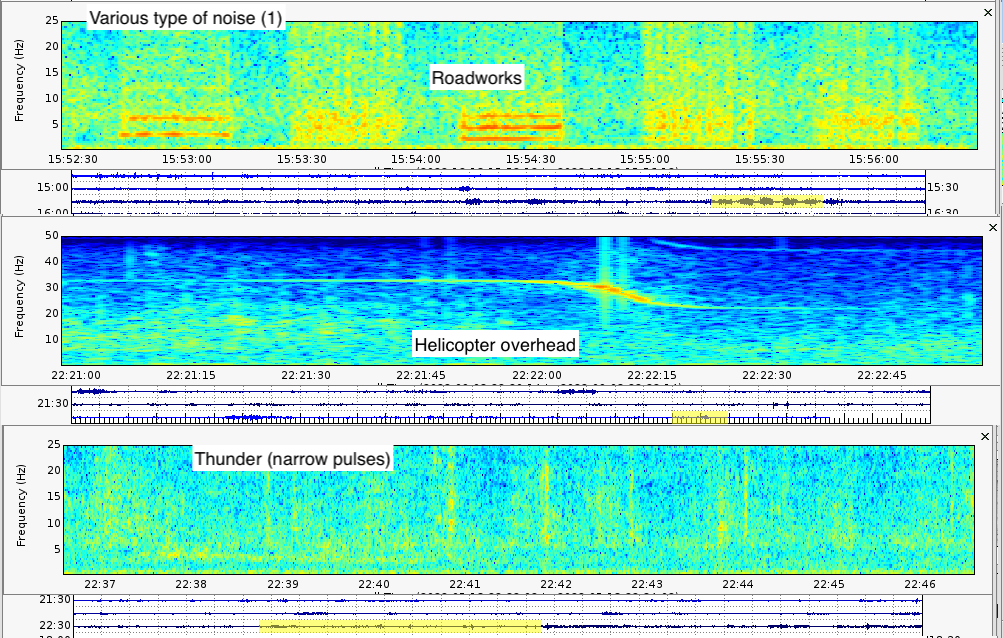
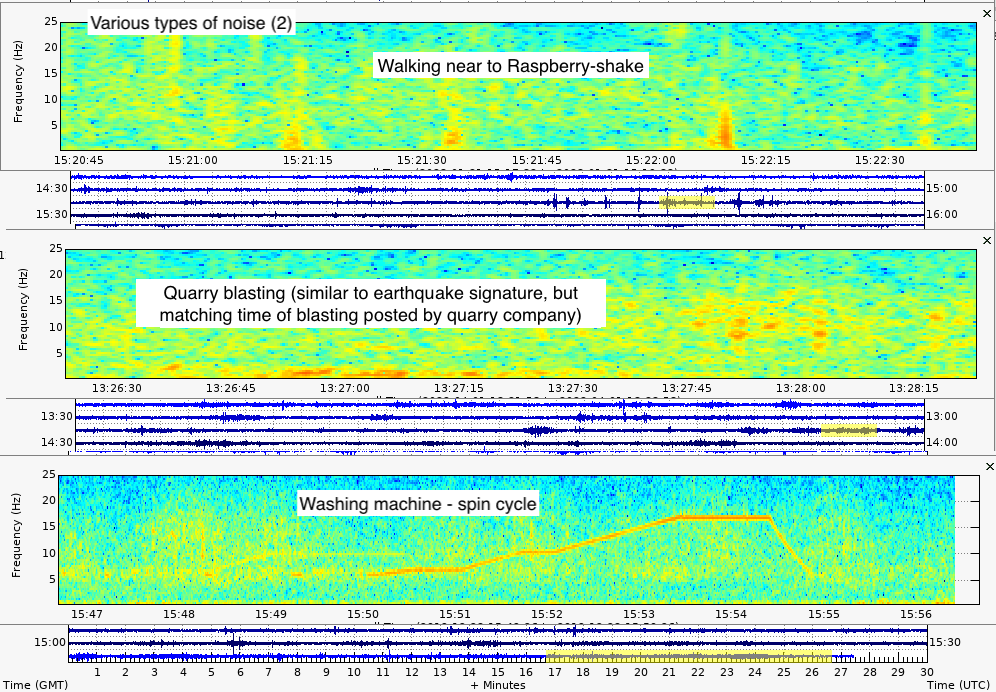
Lastly, it is also useful to try to identify the origin of other types of features in your data, such as those I mentioned in my previous post. I have included a few example traces/spectra at the bottom of this post.
I hope that some of this is of use.
