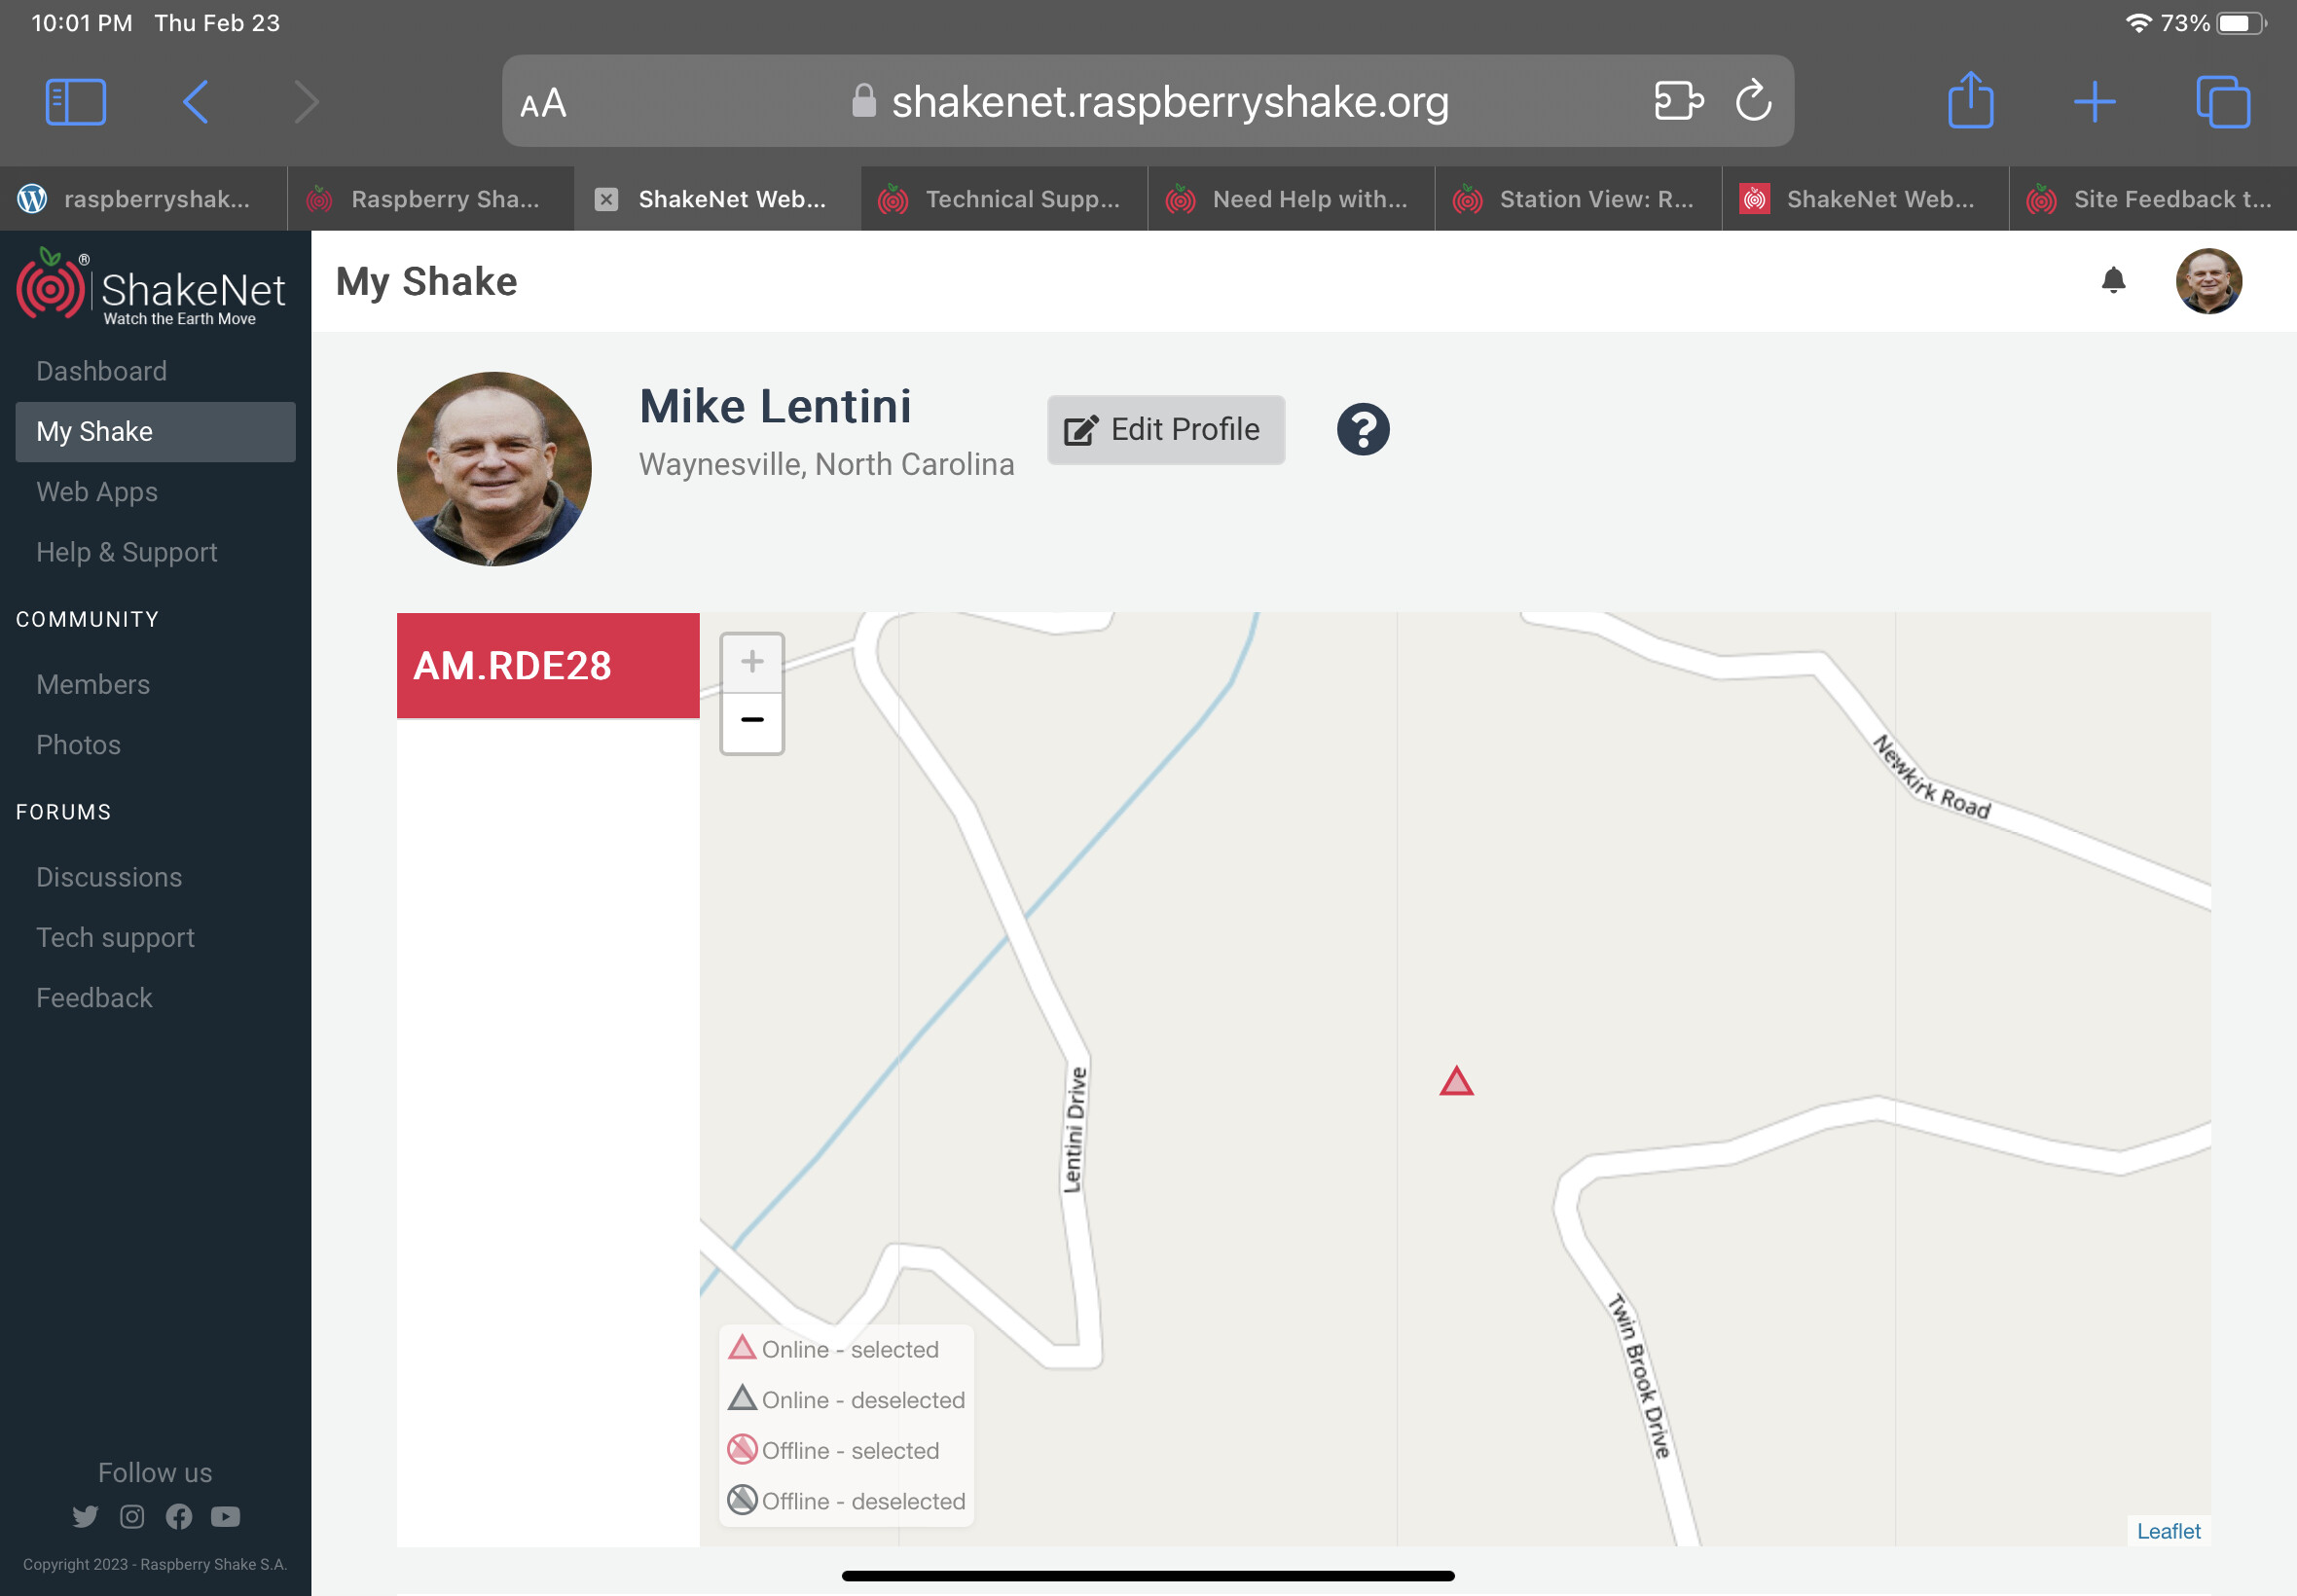
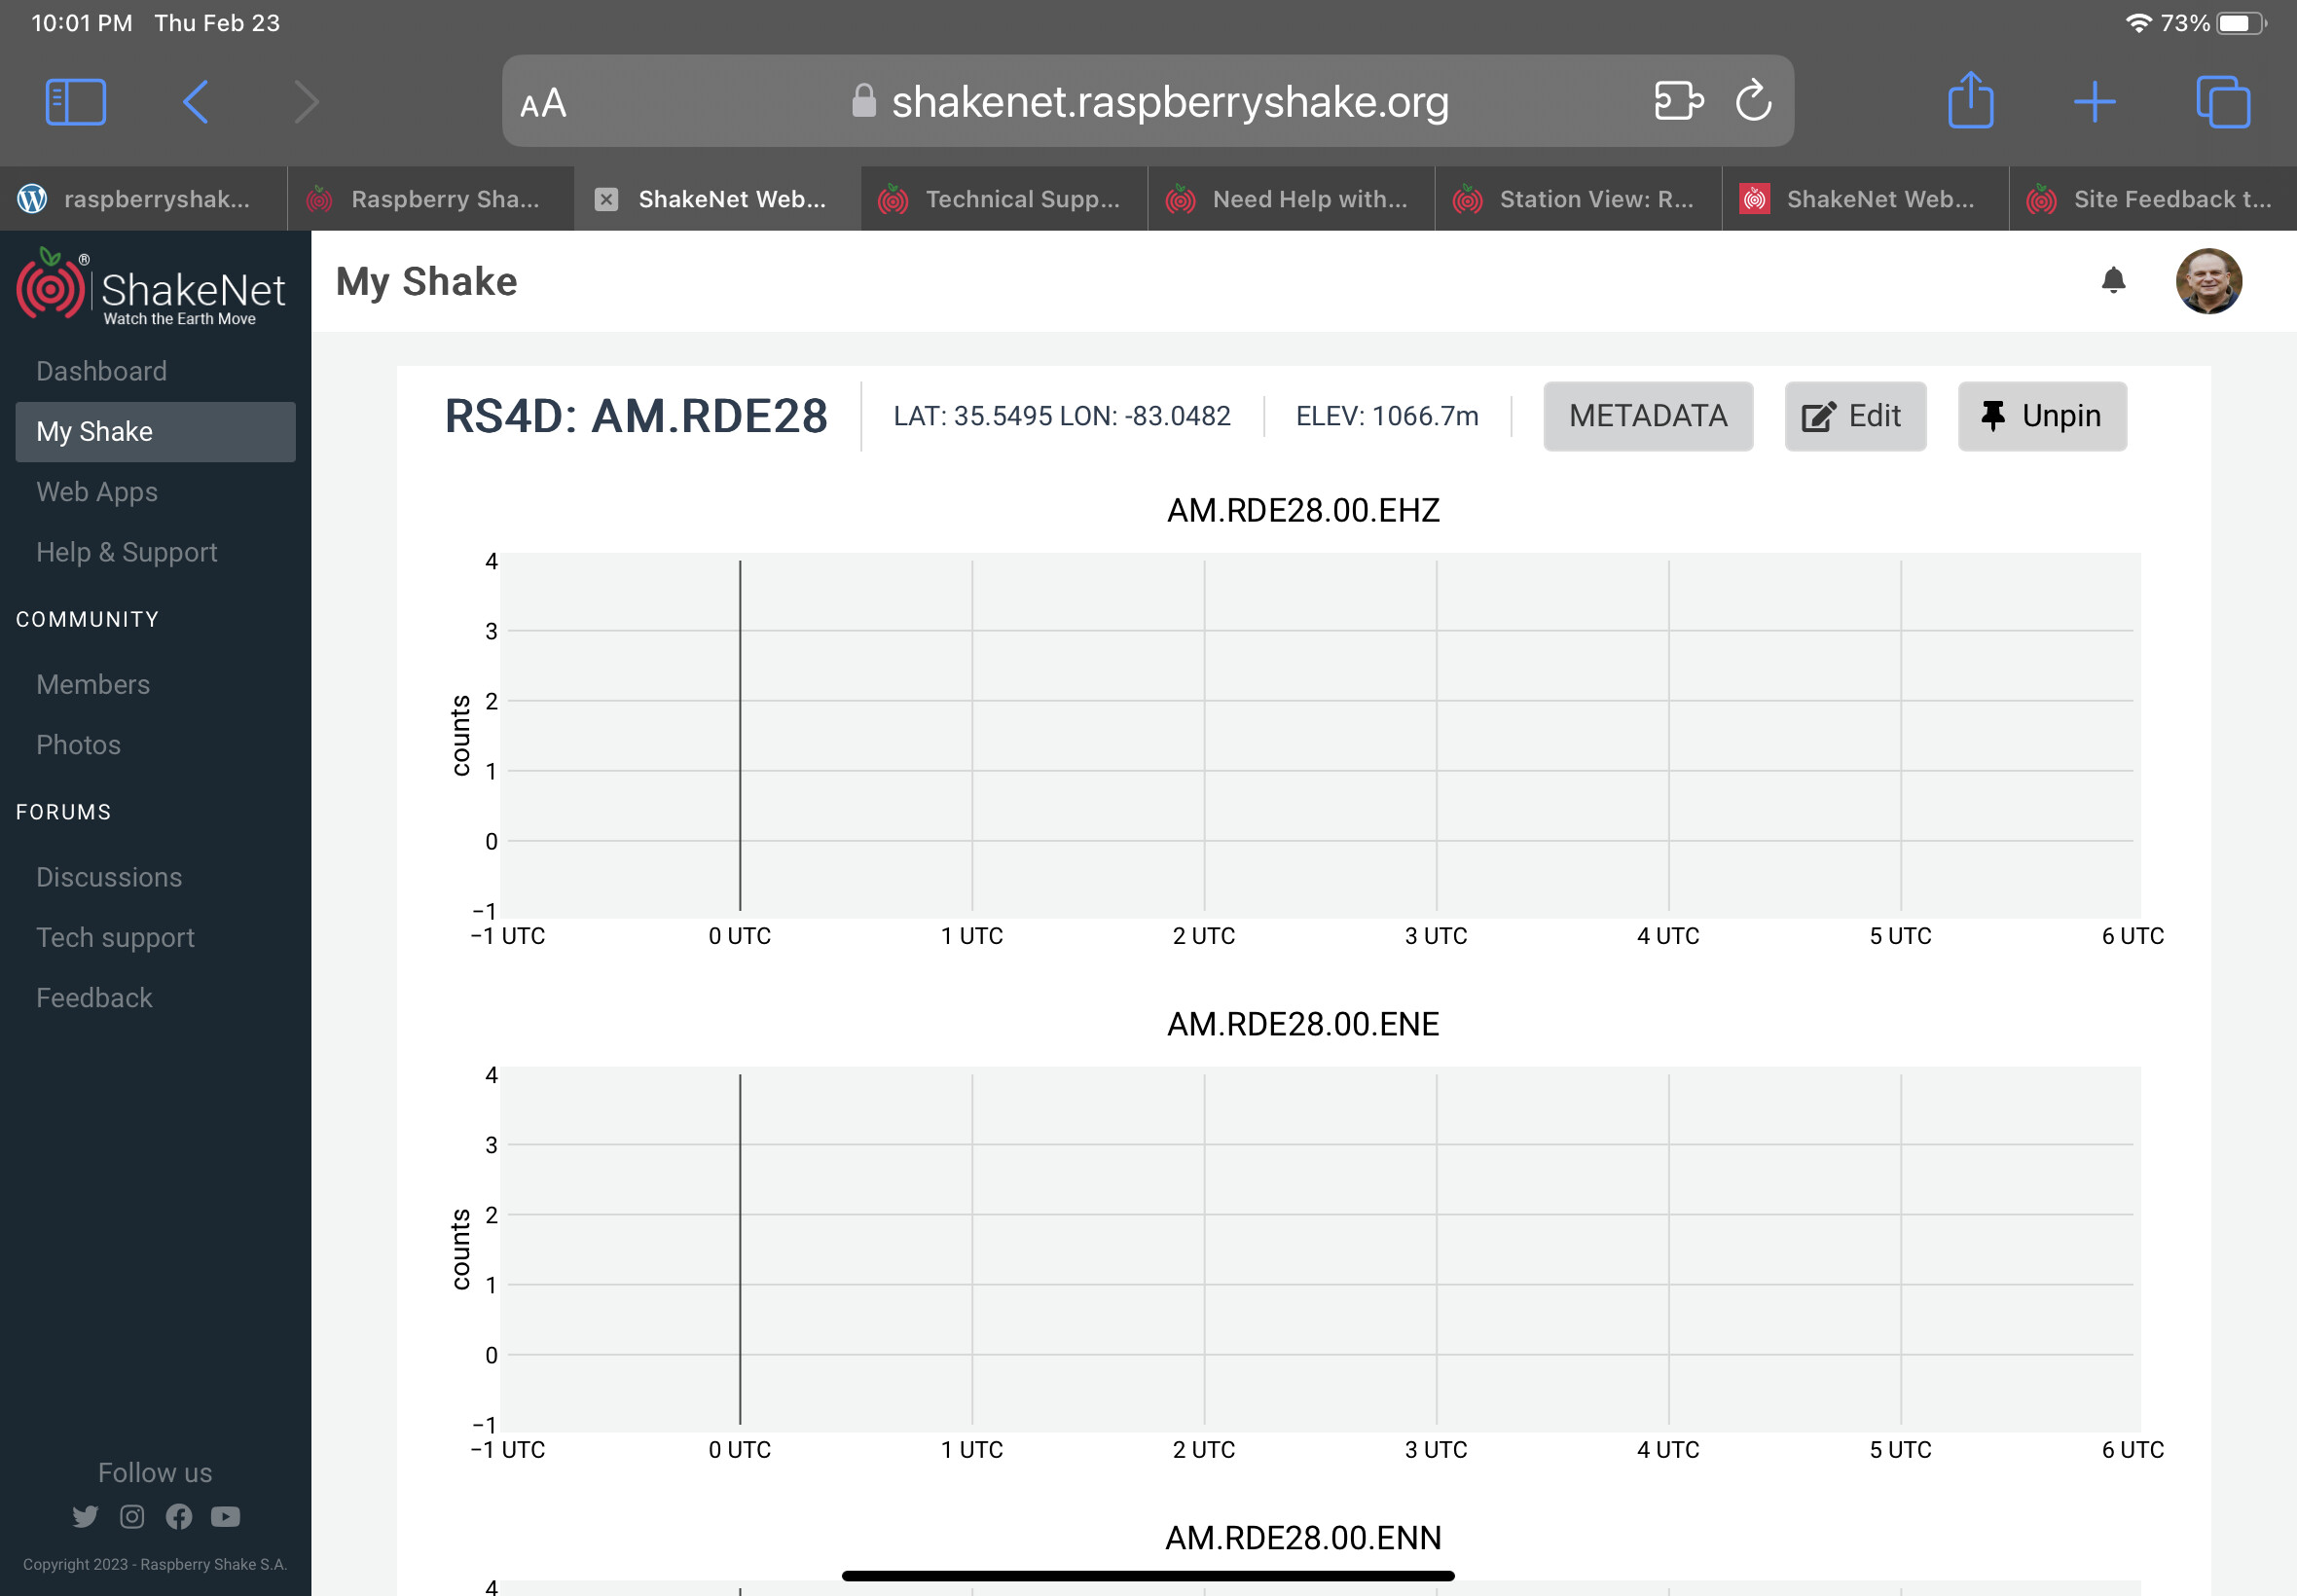
Hello Everyone, I am a new user and trying to get familiar with the software available. When I use the ShakeNet web app my RS4D device (RDE28) it is posting the location on the map but the data curves will not display anymore. I have no problems seeing my data using Station View or Data View. My Shake is functioning and recording. Any suggestions on how I can fix this would be greatly appreciated.
Update: The screenshots are of my iPad. Interesting that when I try launchng ShakeNet Web App on my windows computer it works fine, all of the data channels are plotting.
Yes, I can confirm that your station is connected and uploading live data to our network, so the issue is not there.
Could you please provide the model of your iPad and the iOS version that you are using? So that I can pass this info to our team and they can try to replicate it/analyze it in more detail.
I’ve tried, but on my Android tablet, everything seems to be working fine, so it could be something limited to iOS. Thank you!
Stormchaser,
I very much appreciate all of your posts. I have learned a lot.
I have a really basic (probably dumb) question about the mobile app.
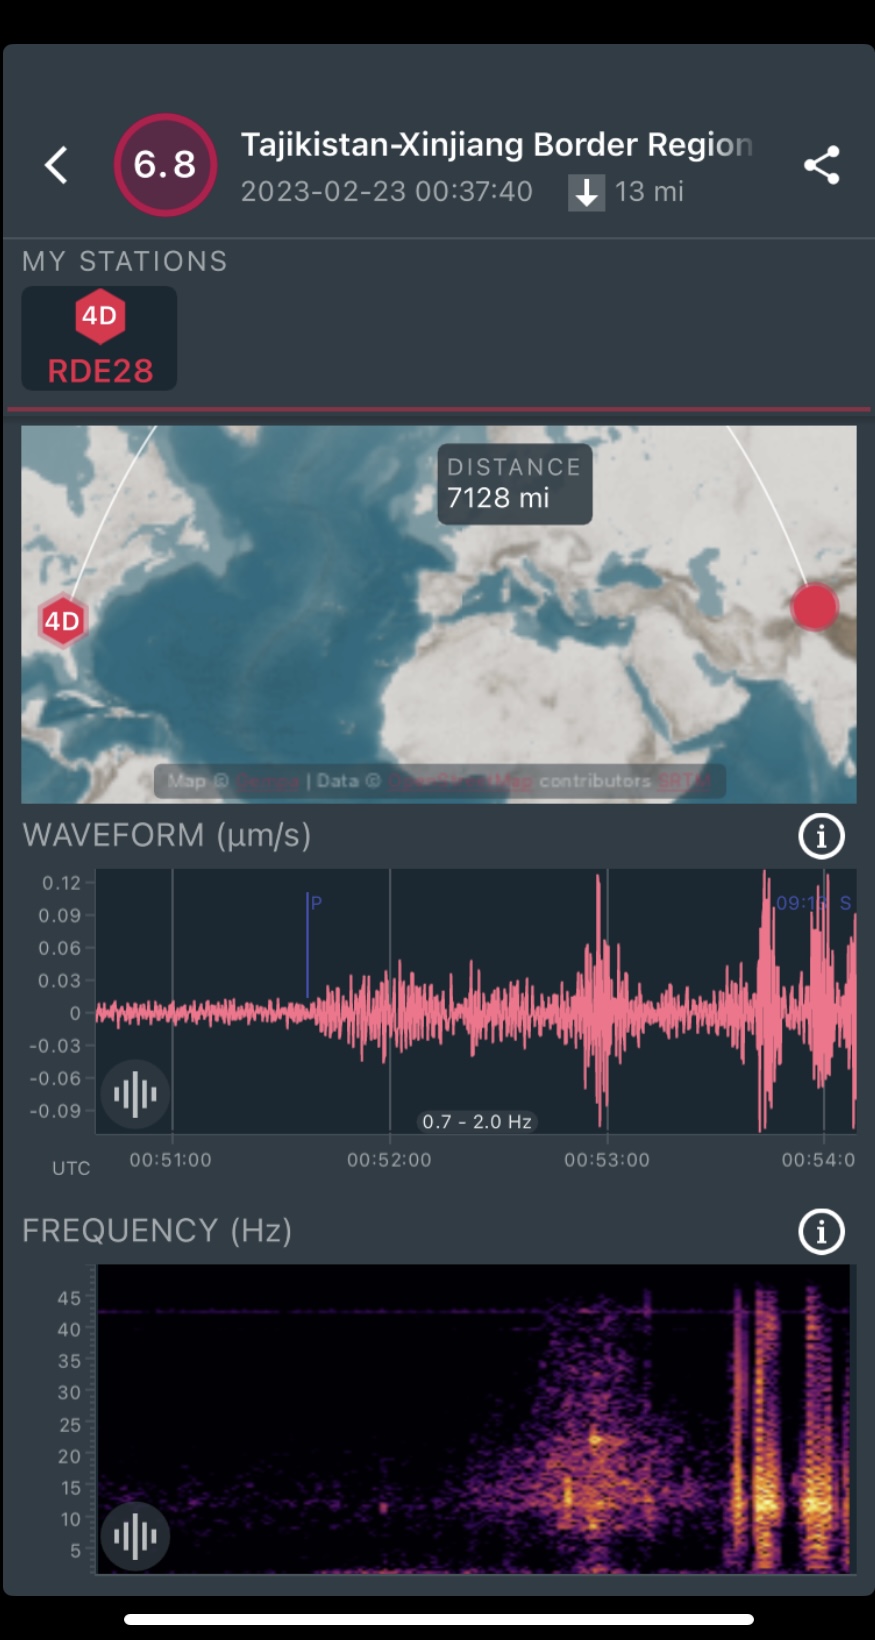
Example: 6.8M Tajikistan EQ shown in image below
Is the Waveform displayed from data generated by my RDE28 shake or is this what the waveform should look like when I look at my data?
If so, can I interpret the following
the EQ was 7128 miles from my device
the P-wave arrived at RDE28 and the travel time was approx. 14 minutes (the difference between 00:37:40 and 00:51:40)
if I want to view the waveform for RDE28 using the Data View helicorder display I can zoom in around the UTM 00:51:40 region
you’re very welcome, and thank you for your words! I’m glad to have been of help.
Don’t worry, no question is dumb if we want to know more. Any waveform that you see on the App (or on other services such as StationView or DataView) is plotted with the data that your Shake is recording/has recorded.
Thus, what you can see is exactly the waveform of that particular earthquake (or any other event) reaching your location all the way on the other side of the Atlantic. And yes, all your conclusions are correct.
hello! i experience the same problem, i am also a new user. when i use my Shake net app with the shake model of RS4D (unit R40BD) It is displaying the triangle location on the map but when i click on Data view Station View it is not displaying anymore. did i miss some steps in configuring my raspberry shake?
I’m sure Stormchaser or others will be along with more technical support, but in the meantime, try clearing all your cookies for RaspberryShake.org. It’ll mean you’ll need to log in again afterwards, but often this is the cause of data not displaying on the Dashboard, Dataview or Station View.
I can see that your Shake managed to connect to the network and send data (Data View: Raspberry Shake Data Visualization Tool), but this stopped around 24 hours ago and it doesn’t seem to have reconnected.
To provide more assistance, can I please ask you to download the logs from the Shake and send them here? If needed, instructions on how to do so can be found here: Please read before posting!