Error in the Manual section "Converting Counts to Pascal to Decibel using Obspy"

I believe I have found a code error in this section of the manual.

The calculation to convert Pascals to Decibels is not correct.

I copied this in one of my reports (see Boom Event Report) but I have since found that in some circumstances this gave impossibly high dB figures (e.g. ~350dB!).

I believe I have the correct calculations in my updated report posted in the above link (however, I’m happy for it to be checked!)

Al.

2 Likes

Please refer:

https://www.engineeringtoolbox.com/sound-power-intensity-pressure-d_57.html
https://www.engineeringtoolbox.com/sound-intensity-d_712.html
https://www.engineeringtoolbox.com/sound-power-level-d_58.html
https://www.engineeringtoolbox.com/sound-pressure-d_711.html

Al.

1 Like

Hello sheeny,

Thank you for bringing this up to our attention, it is indeed important.

Could you please provide a start time and an end time from any Shake you deem necessary, so that I can re-create the instance of excessively high dB count and see what modifications need to be done?

Thank you.

G’Day Stormchaser,

Here’s the main example that triggered to me that something was wrong. It is a lightning strike 8kms away.

This is using the original Boom Report code from Boom Event Report.

Station: AM.R21C0
Channel: HDF
Datetime :


start = UTCDateTime(2022, 8, 3, 20, 38, 16) # (YYYY, m, d, H, M, S)
end = start + 120                # start plus plot duration in seconds (recommend a minimum of 10s)

This is the same event from my revised report with the corrected code for dB:

Unfortunately I don’t have the old reports with the wrong data. When I realised they were wrong I updated with the new report and deleted the wrong reports, so I had to recreate this one with the old report.

Al.

1 Like

OK, I’ve been doing some more work on this and checked my calculations (and BTW found an error in my code NOT related to the dB conversion), so I’ll summarise it here if I can.

The manual contains this code to convert Pa to dB:


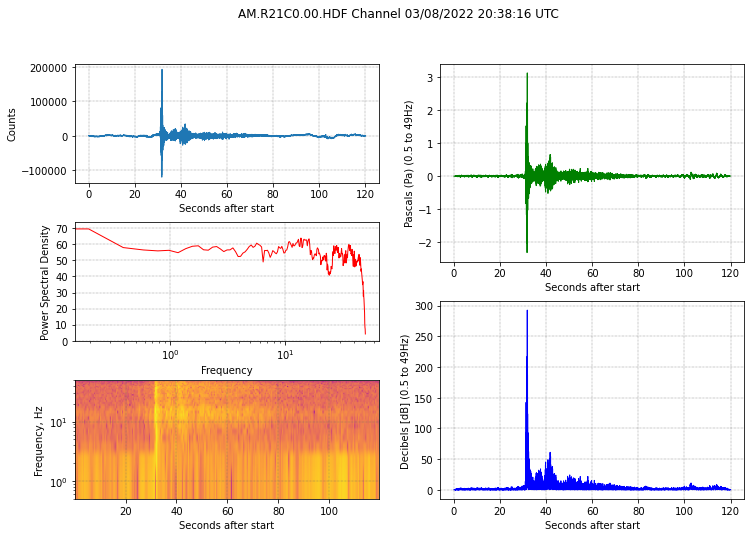
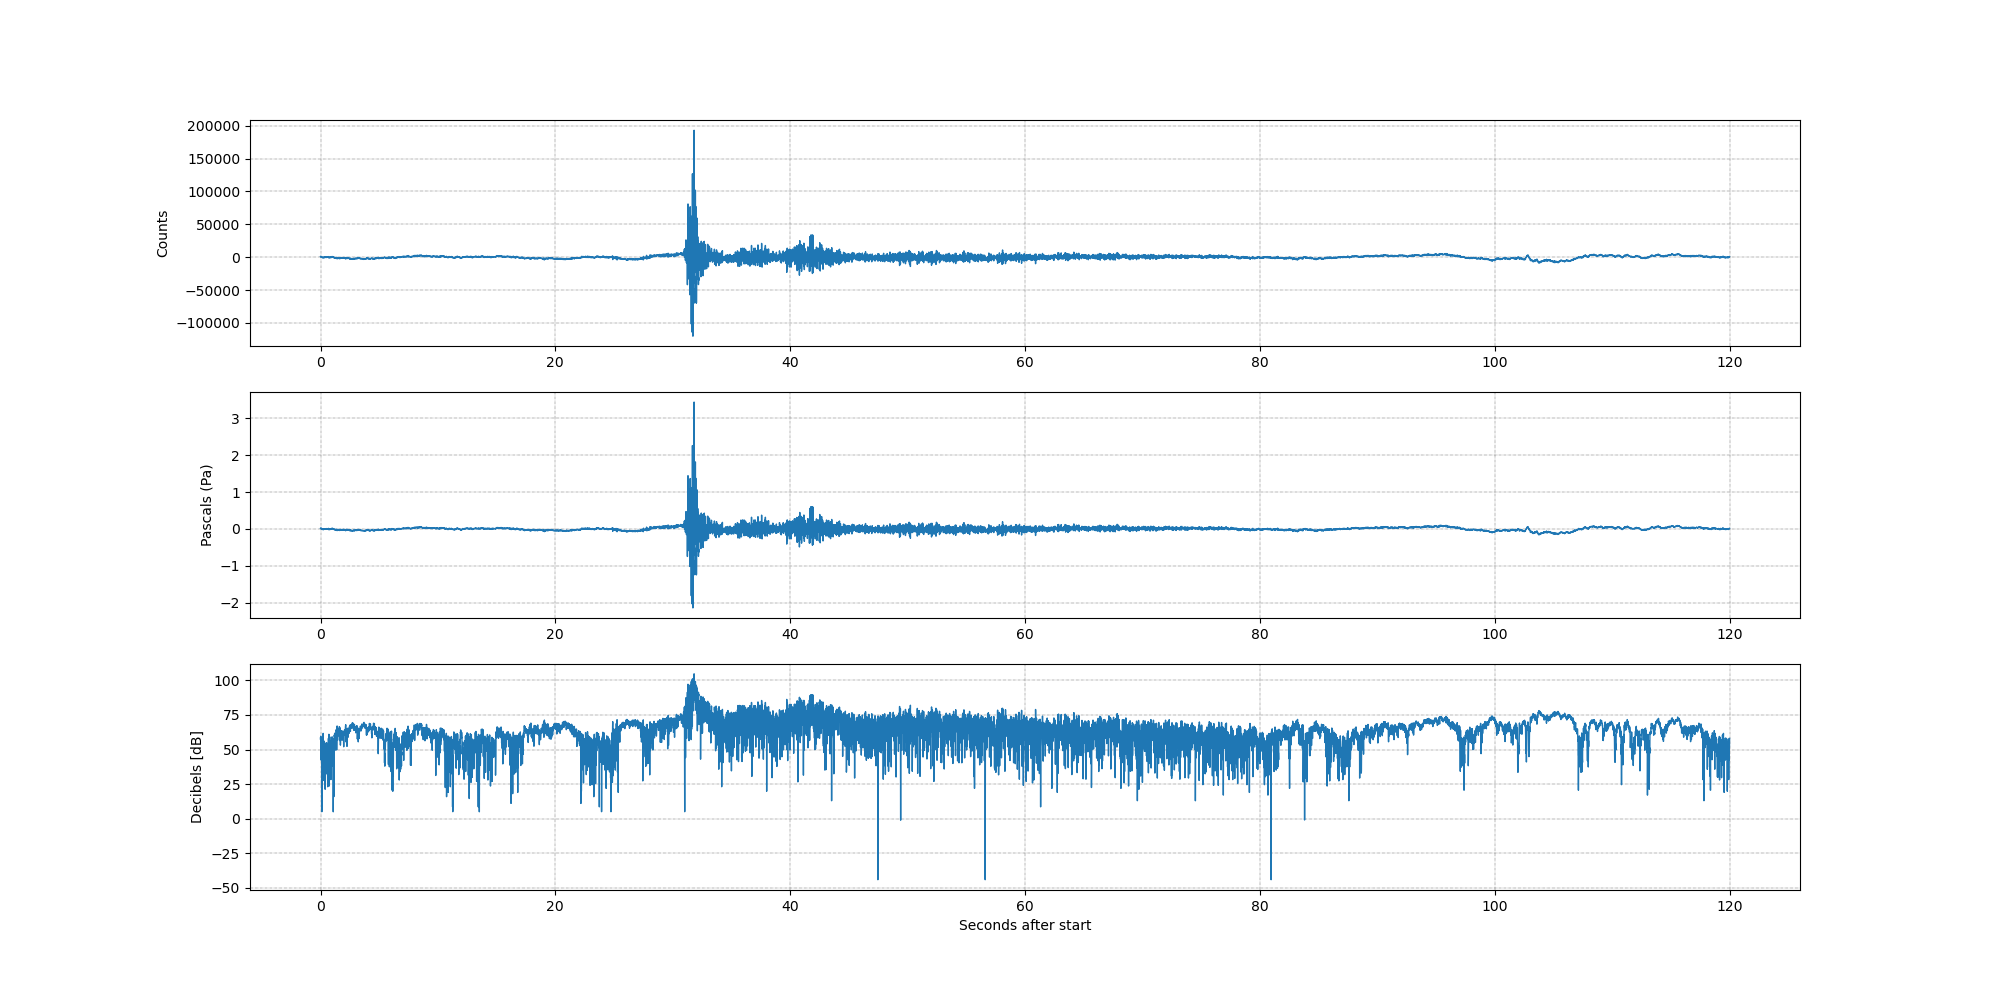
# plot the three curves
ax1.plot(st[0].times(reftime=start), st[0].data, lw=1)
ax2.plot(st[0].times(reftime=start), (st[0].data/56000), lw=1)
ax3.plot(st[0].times(reftime=start), 93.979400087*abs(st[0].data/56000), lw=1)

This converts the counts to Pa by dividing by 56000 (in my code the instrument response takes care of this) so st[0].data/56000 = Pascals.

Decibels are calculated using the formula dB = 93.979400087*abs(Pa).

where Pa is the pressure in Pascals.

The correct formula for the Sound Pressure Level in dB = 10log(PaPa/(PrefPref)) or 10log(PaPa) + 93.9794.00087!

The 93.979400087 = -10*log(Pref * Pref) where Pref = 2e-5 Pa.

So the corrected code for the conversion of Pa to dB is:


10*math.log10(pmax*pmax) + 93.979400087

where pmax is the maximum pressure, but this can be any pressure as long as it is in Pascals.

I did find an error in my code (I used math.log() instead of math.log10() ) but this resulted in a small numeric error so it went unnoticed till now.

I’ll replace the wrong code in the Boom Event Report Thread.

I’d love to see a solution for how to apply the math.log10() function to a trace to produce a true plot of dB.

Al.

1 Like

An update, but before I want to thank you again for bringing this to our attention.

I’ve read all your sources, which were very enlightening (no pun intended here) and expanding from those, this page popped up: Convert pascal [Pa] to sound pressure level in decibels [dB SPL] • Sound Pressure Level (SPL) Converter • Acoustics — Sound • Compact Calculator • Online Unit Converters

Applying the definitions of sound pressure and sound pressure level listed there, the Decibel plot (which substitutes the previous linear approximation one) can be obtained with the following line:

ax3.plot(st[0].times(reftime=start), 20*np.log10(abs(st[0].data/56000)/0.00002), lw=1)

I have also updated the manual page: Developer’s corner — Instructions on Setting Up Your Raspberry Shake

This should cover all cases (point source or others) and provide a correct estimation of the dB levels of any event (whereas, instead, the linear approximation could lead to too-high dB values). For your case, this is the resulting base plot:

Thank you again Al! This is great feedback!

1 Like

Thanks Stormchaser.

I also got a response from the Obspy forum last night advising to use numpy instead of math for the log10 function, confirming what you’ve found here.

Al.

2 Likes

NIce. Thanks @Stormchaser @sheeny . Beautiful outcome!

branden

2 Likes