Hi!
While I know it is not uncommon to get datagaps in the RS data as viewed on the dataview page, I have a station that has almost no data on the RS dataview webpage. I know that it does have complete data, as I obtain the data from it via seedlink. In looking at the instrument itself, ie viewing the myshake.log output, it says it has a connection to the raspberry shake server on ports 5555 and 5556. Any thoughts?
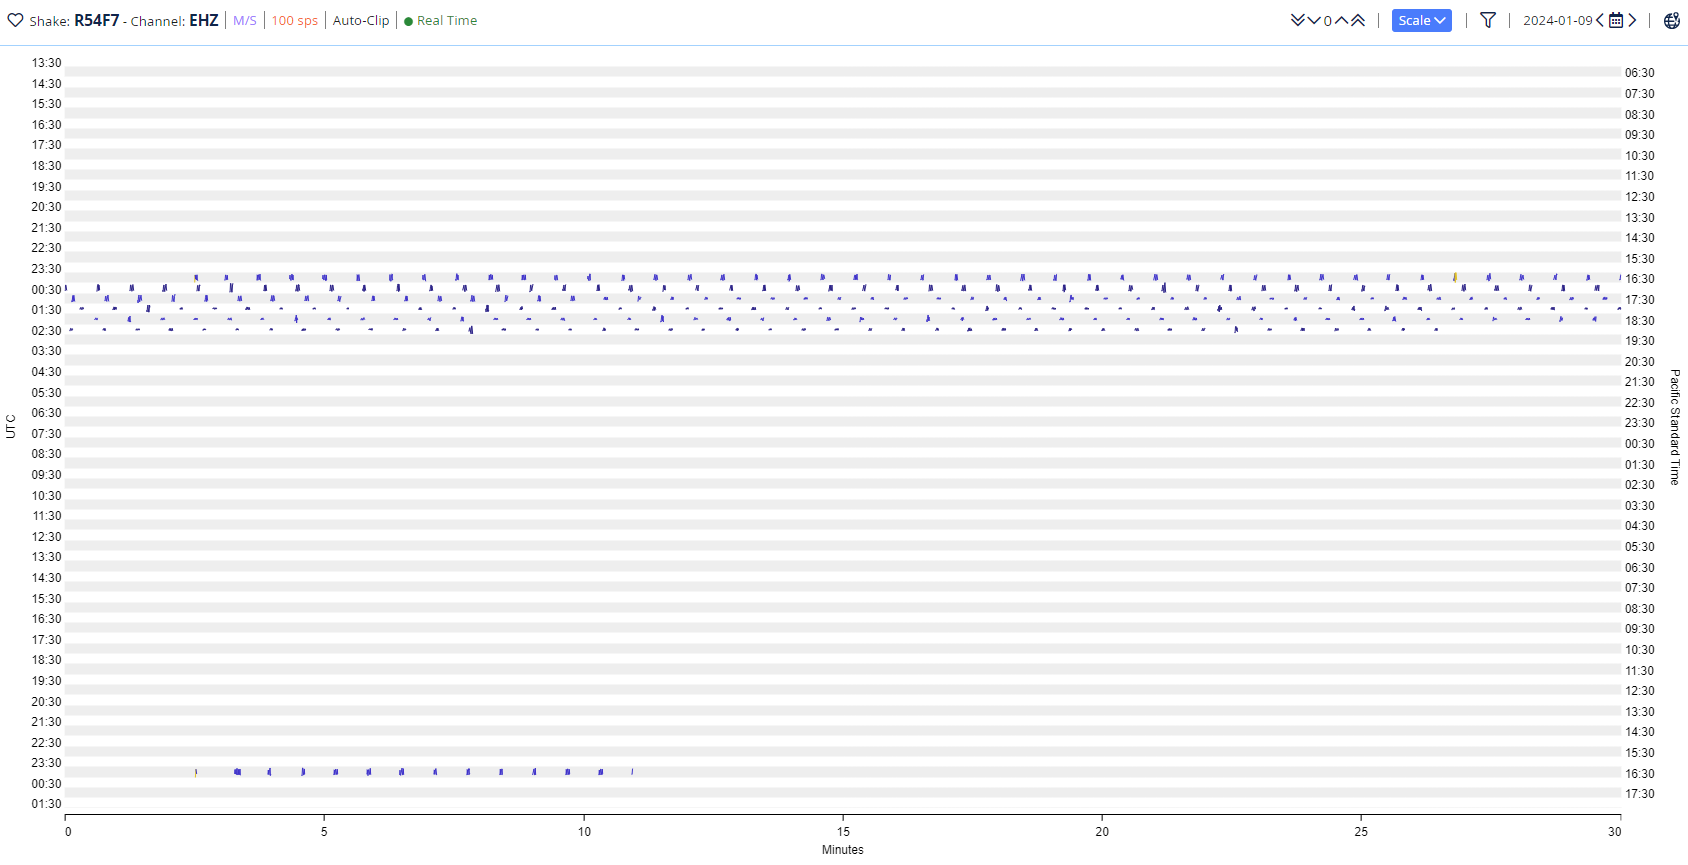
Log files attached. The station in question is AM.R54F7. Screenshot of the dataview page here:
This instrument is in a school behind a firewall, but I’m not quite sure how to pinpoint the issue as the shake thinks it has a successful connection to the RS datacentre.
Link to TGZ File: Dropbox
1 Like
Hello, welcome back to the community!
Thank you for attaching the logs from this Shake. From what I can see, after the Shake boots correctly and finds an internet connection, there are some errors in transmitting live data:
2024 007 09:03:56>> sendDClientDP(): Error sending data …
2024 007 09:09:14>> DDSsendDP(): message send failed after 61 retries, closing connection.
2024 010 00:09:04>> Connection request (raspberryshakedata.com:55555) failed with error code: Connection refused
These errors appear to be temporary, as the Shake connects successfully afterwards, but this intermittent behavior may be the reason behind what you are seeing.
However, as you have the SeedLink to verify data transmission (as you have said), could you post a screenshot of the SeedLink-received data that matches the timeframe shown in the DataView screenshot you attached in your opening message? I would like to provide both to our server team so that they can check if there is anything on our side that we need to do.
Thank you.