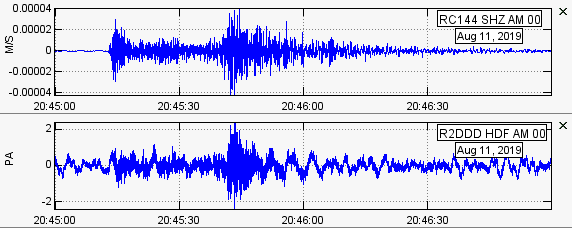
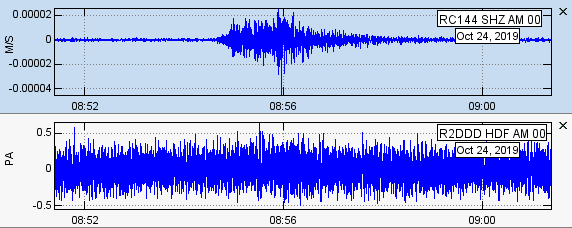
EQ magnitude 5.2 at 102 km depth 271 km away was detected by both the RS1D (top) and Boom (bottom). You can see the P and S waves quite clearly in both signals.:
How does the Boom do this?
Is the local ground motion inducing local changes in atmospheric pressure?
Or is it the motion of the Boom in still air that’s inducing the infra sound?
Because they’re coincident in time it almost certainly has to be that the Boom aparatus itself is moving and creating its own pressure waves. It would be interesting to know if you could use the seismic signal to deconvolve the quake waves out of the Boom signal.
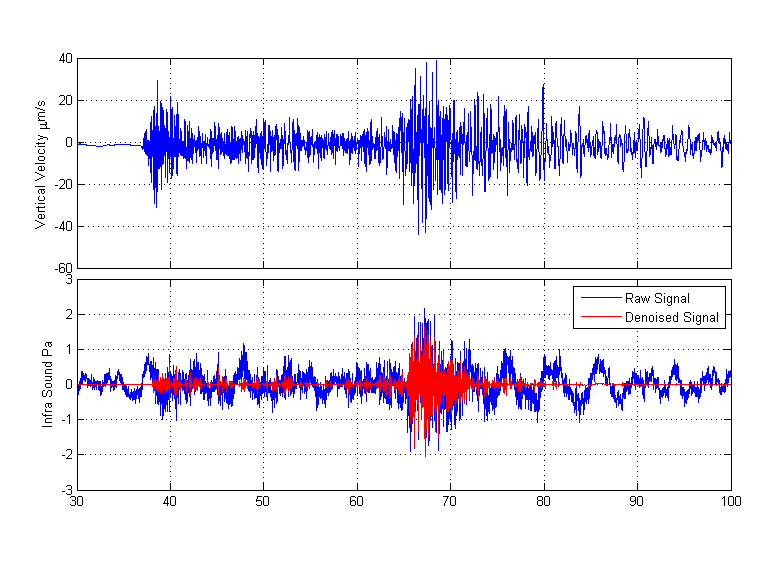
It’s very complicated because there is noise, resonance, EQ response and some 5 s waves all mixed together.
The plot below shows the Boom signal denoised using orthogonal wavelet decomposition with the Universal threshold: sqrt(2*ln(n))*mad, where n is the no of data and mad is the median of absolute deviations. This is calculated for each wavelet detail from a period of quiescent data, then applied to the actual signal.
Very interesting! Was this a felt event at your site? Have you seen this relationship with other events? Can you see the expected air wave arrival at approximately 300km/0.3km/s = 1000sec after To?
Sure, I can do a spectrum, but what meaning can be ascribed to a spectrum of such transient data?
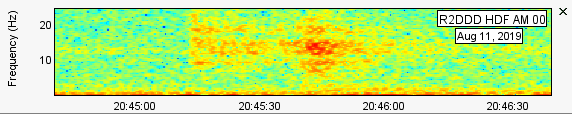
One of the criteria for Fourier spectra is stationarity, yet this signal is highly non-stationary.
The spectrogram which is based on the short term Fourier transform (STFT) makes more sense:
No, I haven’t seen other events like this at this site. There was a larger 5.3 EQ 400 km away a day or so later that got a strong signal on the RS1D, but nothing on the Boom.
No, the signal at ~1000 s from EQ is just noise.
Where do you get the 0.3 km/s speed from?
Wikipedia: “The speed of sound is the distance travelled per unit time by a sound wave as it propagates through an elastic medium. At 20 °C (68 °F), the speed of sound in air is about 343 metres per second (1,235 km/h; 1,125 ft/s; 767 mph; 667 kn).”
I went ahead and rounded the distance and velocity for simplicity.
As a side note, for lightning/thunder distance estimations, I round the mile to 5000 ft and round the speed to 1000 ft/s so that 5 sec between the flash and thunder arrival equals one mile. If you don’t get to one second, duck!
Most of us can count off seconds reasonably well, so you can carry your “calculator” around in your head and amaze your friends!!
I posted some graphs showing that the RB functions quite nicely as an accelerometer. Response to Z-axis (vertical) acceleration can be reduced considerably by mounting the unit with the microbarometer “spouts” with a vertical orientation (at least with my unit). That is for the base unit with very short bits of tubing attached. If you have a lot of external tubing, that gives another place for seismic response to be inserted into the barometer signal.
I am not saying that there is no infrasound generated by the ground shaking. But I think it’s likely the seismic response of the RB itself will likely make it impossible to evaluate that.
No. Definitely not. If the Boom is receiving a signal at exactly the same time as the seismometer, then the pressure waves must be generated locally, within meters of the instrument. Another point is that the “Swave” seen on the Boom can only be a converted compressional wave, since shear waves cannot travel in a gas or liquid.
There must be coupling between the seismic waves and the structure the Boom is in. It is interesting that an event that was not felt at the site, could cause such sharp pressure waves on the barometer. It would be interesting to look at a catalog of events since the station has been up and look at the relationships between distance/depth, magnitude, and local seismometer/barometer response.
I’ve been moving the Boom around looking at resonant responses at various places in the building, so I don’t have a lot of record at a particular spot to check the correlation between ground motion and infra sound. But I’ll leave it where it is (beside the RS1D) for a while and see what happens. We detect several EQs a week here (Banks Peninsula, NZ) so we shouldn’t have to wait long…
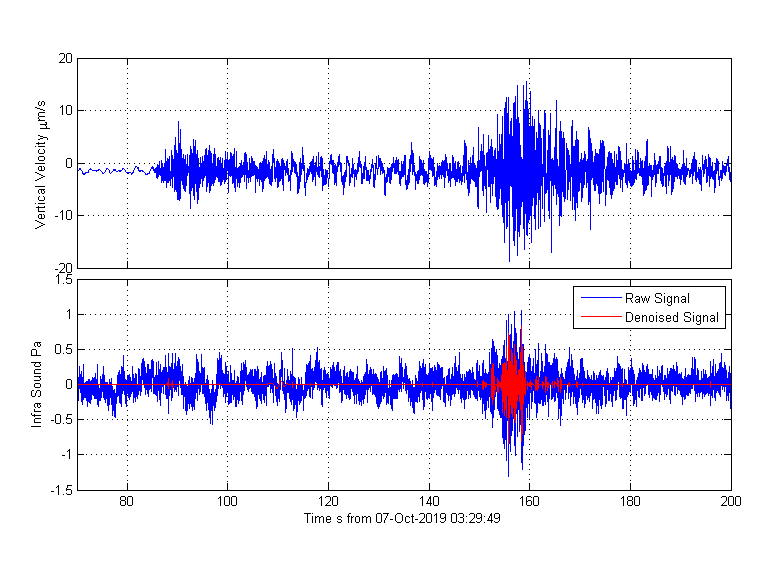
In this case, the P waves did not really register above the noise, but the S waves that followed did. I think this shows that the Boom has bounced up and down in response to the S waves, resulting in the changing pressure measured by the sensor.
My experimentation showed that the pressure sensor itself works as an accelerometer. This effect is stronger along two of the three axes. The least sensitive was the axis in line with the “spouts”. Of course, if you have a lot of external tubing involved, you will get a response in line with the major axis of that tubing.
It could also happen if you have placed the boom just some distance behind the RS Shake, then it will actual listen to the internal movement of geophone sensor.
I guess it’s not the geophone flip/flopping that is being recorded by the Boom, because here is the record from a M 5.6 EQ 446 km away that set the Shake shaking, but no response at the Boom alongside.
BTW, does anyone know how to turn off the blue shading in Swarm, i.e., deselect?