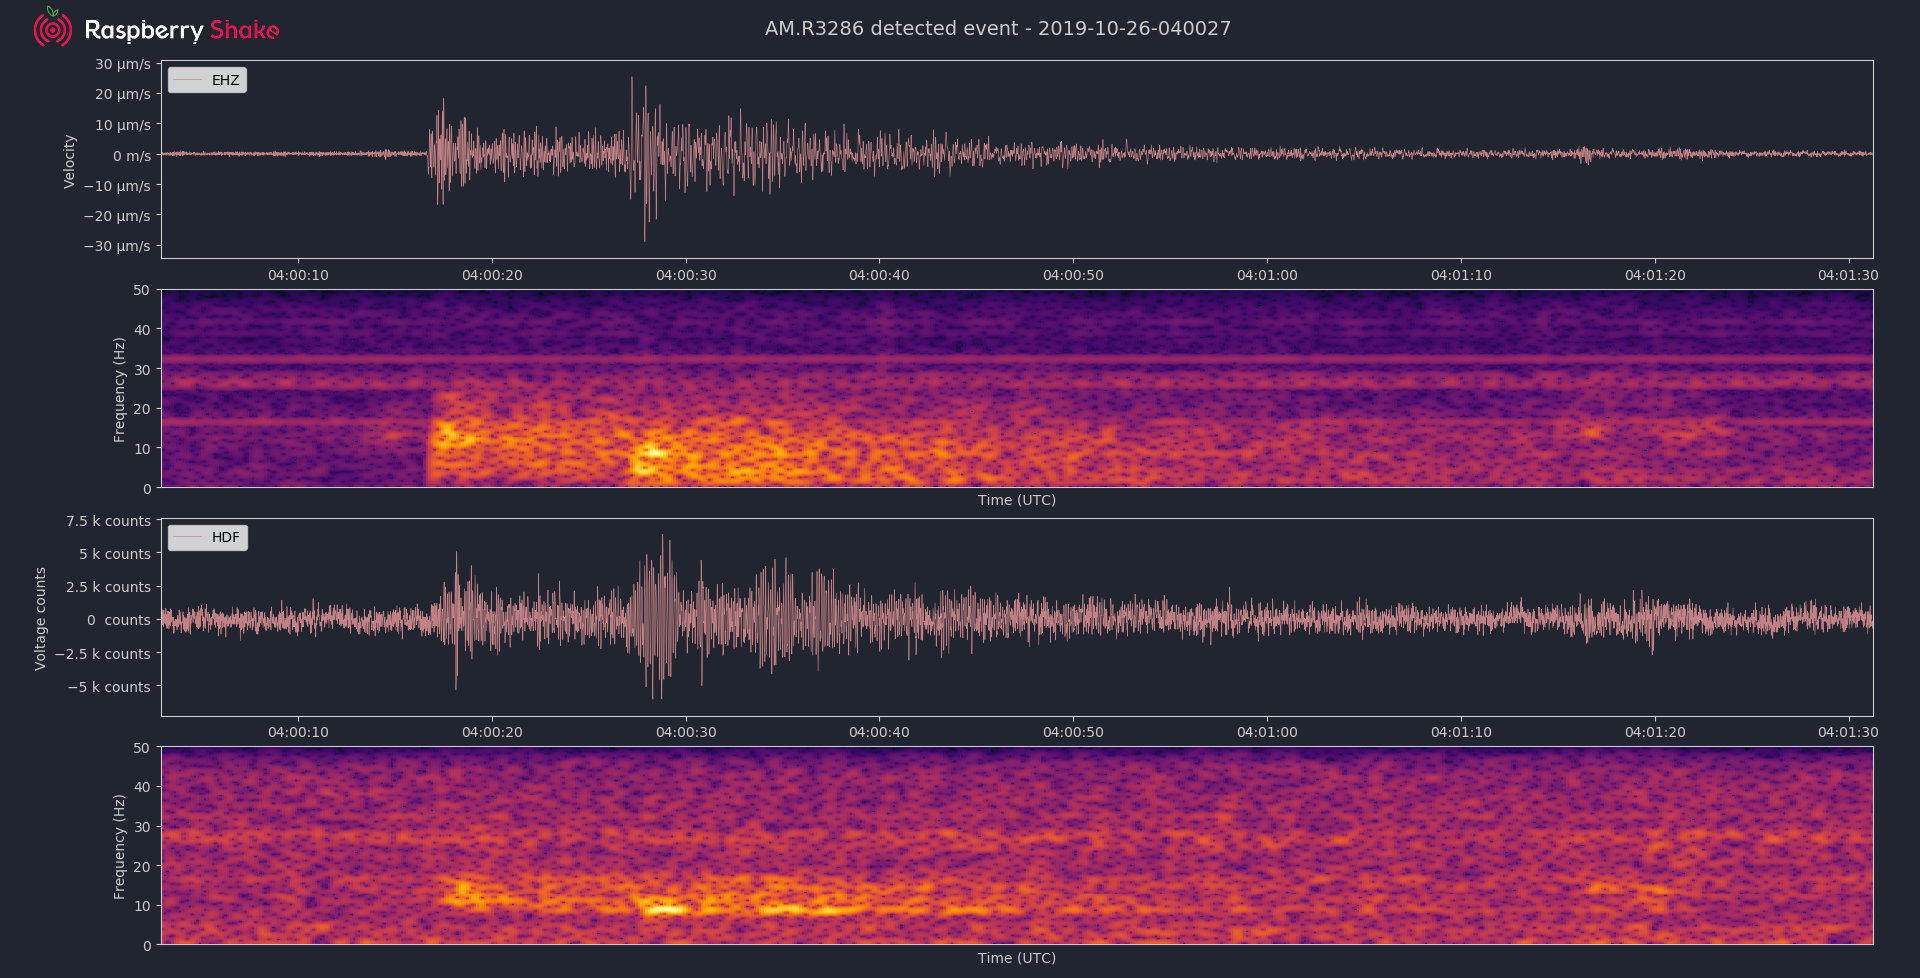
In blatant disregard for @TideMan’s earlier comment about converting a transient signal with Fourier transforms (sorry TideMan :), here’s a Shake & Boom recording of a Panamanian quake this morning:
Ian:
Spectrogram uses STFT, so it’s OK because it has time dependence. Spectrum has no time dependence - time has been integrated out completely, so it’s invalid for transient signals (whose variance varies with time and therefore are nonstationary).
You are seeing resonance, especially for the S waves, just as I do, but only for some EQs.
I’m assembling a database of such EQs to see if there is a pattern - depth, proximity, etc. - but it takes time…
For those who have not tried it, I can suggest connecting the input and output ports of the microbarometer sensor together with a short piece of tubing - no backing volume, no filter and almost no tubing. Then pick up the RBOOM and gently shake it in the X, Y and Z directions successively with 5 -10 repetitions in each direction. Make the movements as carefully as possible along one axis only. Have a look at the resulting wave recording. This will give you an idea of the accelerometric response of the RBOOM without air pressure variations …
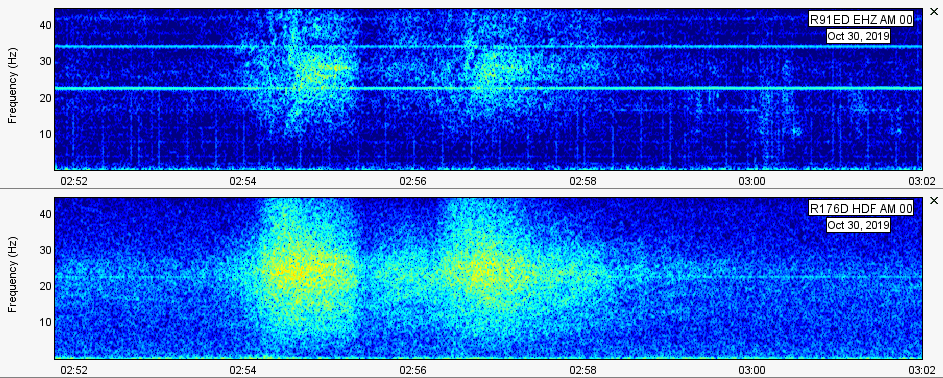
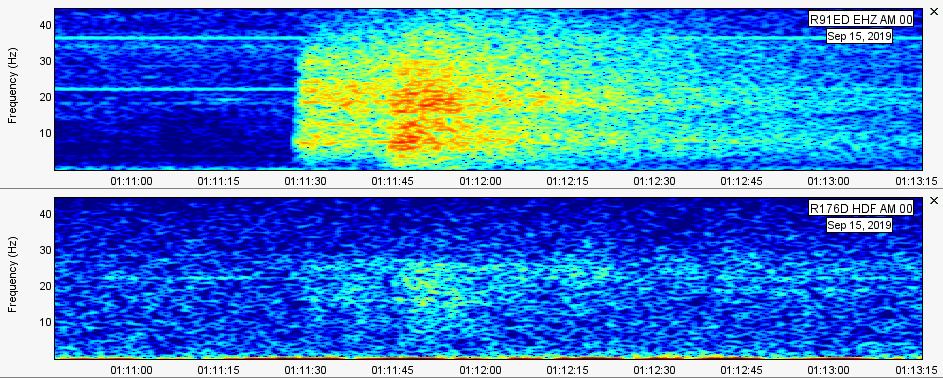
Having noted that the RB can act as a seismometer, I have mounted mine to minimize that effect. But the RS will still respond to sound due to aid/ground coupling. I can say that I have lots of evidence of air/ground coupling thanks to a nearby airport. It always looks like this:
The over-flying jets (two of them here) provide strong sound excitation from a few Hertz up the the Nyquist limit. (The peak near 25 Hz is due to a natural resonance in my rosette pipes which I have tried to minimize by inserting stainless steel wool into the pipes at several locations, but I don’t mind the enhanced sensitivity at ~25 Hz). I think the sound source itself (lower graph) is actually rather broad-banded.
You can see that the RS-1D is picking up the same event but only seeing 10-40 Hz, with most of the energy in the range of 20-30 Hz. Some research indicates that it is typical for many types of soil to resonate in this frequency range and that air/ground coupling is also strongest in this range. So I believe that the RS is not responding to sound as such, but rather to the ground shaking from the jet engine source.
This effect must work in the other direction. No?
From my airplane data, I expected that a quake with substantial energy in the 20-30 Hz range would produce sound that can be heard by RBOOM. We don’t get many of those around here.
As it turns out, there was one about 100 km from here that was just strong enough to prove the point.
PGV here was 22 micrometers/second and there was plenty of energy in the 20-30 Hz range. It just shows on RB ( RB is not all that sensitive when operating in broad-band mode due to self-noise).
Your results may vary depending on soil characteristics, but I think it is quite reasonable for a quake with sufficient ground velocity and the right frequency characteristics to show up on RB.
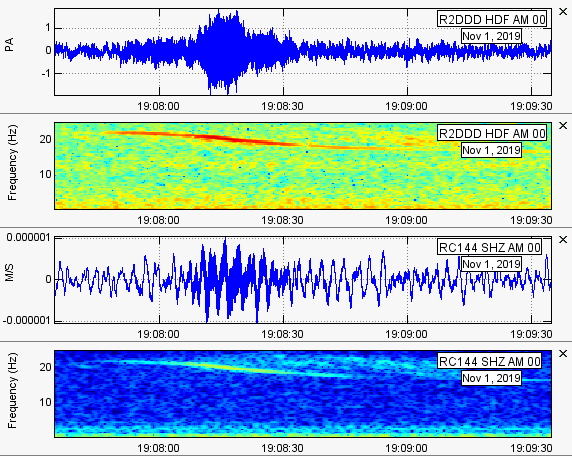
And here’s an interesting record from Boom (upper plots) and RS (lower plots). I think it might have been a topdressing plane (cropduster for Americans) discharging its load nearby. See how the frequency drops? That might have been the engine reducing revs as its load reduced, but it could also be a Doppler effect.