Heya,
Does anyone have any experience with wind turbines and infrasound?
I have a very large industrial park 30km from my home and I can “feel” it…
32x 2.3MW wind turbines 90 meters rotorblades…
Terje Hauan
Heya,
Does anyone have any experience with wind turbines and infrasound?
I have a very large industrial park 30km from my home and I can “feel” it…
32x 2.3MW wind turbines 90 meters rotorblades…
Terje Hauan
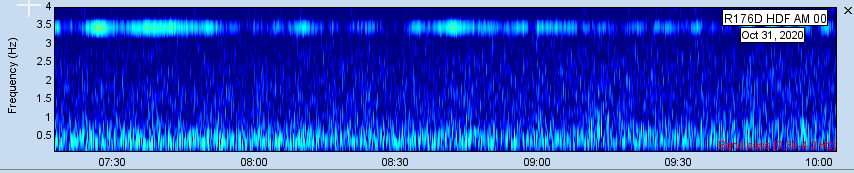
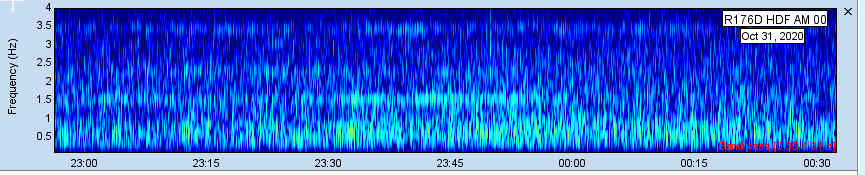
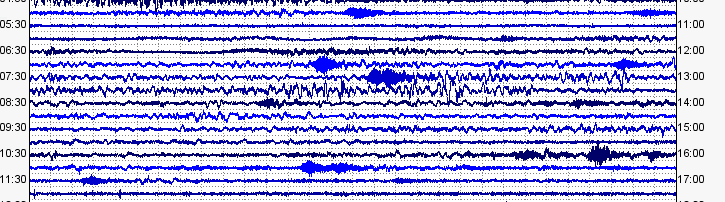
I would like to poke this topic again. I had some recordings yesterday that might have been wind turbines. In the early morning hours I was getting a lot of 3.4 Hz on my RB.
Now this could be anything, but later in the day I got more interesting results.
Here you can see multiple traces which is more like what you expect from a wind turbine.
I suspect it is rather difficult to get a distant signal from a multi-turbine wind farm if the blades of the individual turbines do not turn in synchronism.
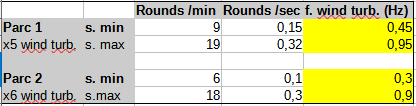
I had a look at the expected frequencies from a large turbine (2 MW) like the ones west of here on a mountain ridge.
The rated speed of these units is in rd/min as in radians per minute. The units in question were 9 rd/min to 19 rd/min. Given that these have 3 blades, I calculate the blade passing frequency range as 0.07Hz to 0.15 Hz. One expects to see the odd harmonics of this frequency so for the highest speed it would be 0.15, 0.45, 0.75, 1.05 Hz …
Most of these frequencies would be lost in the noise for a typical RB. However if the turbine were smaller with a corresponding higher rotation rate, the number could work. In the second graph this would be 5,7 and 11 times 0.3 Hz.
There is some similarity to figure 2 of this paper:
https://agupubs.onlinelibrary.wiley.com/doi/pdfdirect/10.1002/2014JD022821
Ken
Hello @TerjeHauan and @kpjamro, and all interested in infrasound and wind turbines.
To make it short, since we moved to our new place, we were experiencing weird sensations, mainly at night (pulsations on ears, vibrations feelings, fatigue, etc.).
I was suspecting low frequencies from an industrial site 2km away and I decided to buy the Raspberry Boom to explore all this.
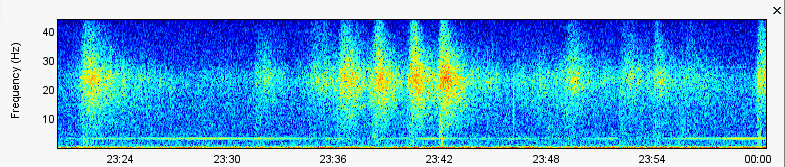
Finally, here is a sample of what I recorded:
As I found your post, with @kpjamro contribution and link to the US study, I realized it looked like wind turbines infrasounds…
And I found two wind farms, each located 20 km away from us. We are on the middle!
Here are the caracteristics (each wind turbine is 3 blades, 2000 kW)
And it makes definitly sense!

That might be out of scope of Raspberry Shake community, but if you know of any study that focuses on health issues regarding wind farms, that will be appreciated.
Vincent
This could stir up quite a discussion 
If you Google the topic. you will have reading material that will last you until 2021 (much of it trash so you need to be selective).
My conclusion is that most experts say there are no physiological effects from frequencies this low, unless the amplitude is quite high (>100 dB).
There is something called the “nocebo” effect, however. Basically, if you believe something will make you sick, you can have symptoms that are just as real as if there was an actual physiological effect. This causes lots of confusion in studies like low-level infrasound.
Ken
Thanks for your reply @kpjamro
Yes I’ve heard about ‘nocebo’ effect. But on our case I don’t see the point, as we weren’t concerned about wind turbines at 10 km (not 20km as mentionned on my previous post), until I saw the graphics.
If now we feel worse, I will reconceder ‘nocebo’ effect
The thing that made me think about low-level sound issue was the sensation of pulsation on my ear. The best way I found to talk about this is: it’s like if you were on a train that would go through tunnels, in and out, with arround 1 sec period. You would feel that disconfort pressure on your ear repeatedly.
And a 1 second period (let say 1 Hz) appears to be not so far from the wind turbine identified frequencies.
Anyway, that’s an other subject!
Back on signal analyses… Considering the power, I tried on the ‘spectogram view’ to define the Power Range from 100 to 120 dB. And here is the result:
Sound pressure level in dB, by convention, is referenced to 20 micropascals. That is, 20 micropascals is defined as zero dB.
You can use a calculator like [this one]
The colors on your rainbow graph are relative to the power range limits you set in the spectrogram settings and the window size. What you want to do is look at the waveform. The waveform will read out in “counts” where 56,000 counts is one pascal (at 5 Hz - it is close to that sensitivity even at 2 Hz).
So: 100 dB sound pressure is 2 pascals and that corresponds to 112,000 counts on your RB. That is pretty strong.
For example, if a jet airplane passes overhead here I see +/- 20,000 counts and I make that as 85 dB SPL.
This is clearly audible since much of the sound energy is above 20 Hz. If this same sound energy were in the single-digit range, it would not be readily audible. The threshold of audibility is more than 80 dB at that frequency range
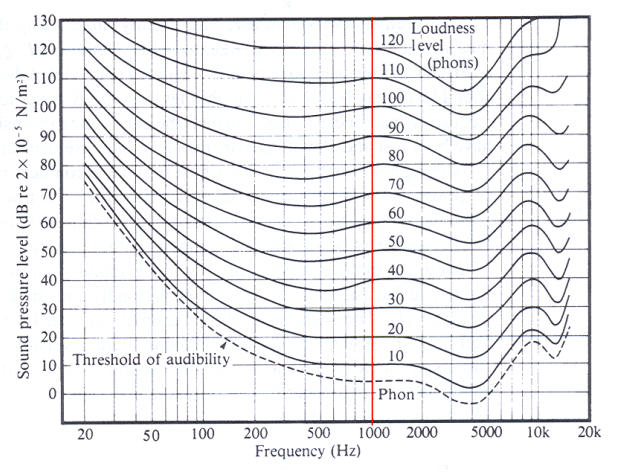
Although, strictly-speaking aaudible threshold is not defined below 20 Hz. You can see more in the source document for that graph.
If you are trying to find the sound pressure level for some specific signals, you should apply a bandpass filter the signal before graphing it and trying to measure the amplitude…
If the signal is not 20 dB above the background noise, then you probably want to measure a slice of spectrum with and without the sound in question and take the difference (remembering that noise and signal add as square root of the sum of squares).
There are “power” readings you can get from the spectra display but I do not know how to use them or if they are even meaningful.
Ken
PS - and yes, below 10 Hz, the sensation people report is not sound exactly, but the the sort of sensation you were describing. Still - I think a fairly strong pressure would be required. But - I can say that there might be “annoyance” at a pressure level much lower than the level which causes “physiological effects”.
= = = =
Thank you Ken for your detailed explanations. I trully appreciate.
I’ll dig into this. But I think I got the main idea. I’ll try to slice my signal and extract the noise to have a mesure of the amplitude I could be confident with (counts to pascals to dB).
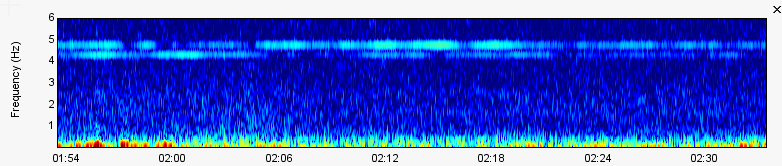
Before going on filtering the wave by frequencies of interest and convert to dB, here is a first step giving a Spectrogram by pressure (Pascals).
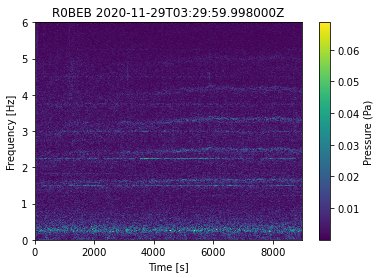
Strongest pressure per frequency is not much upper than 0.06 Pa, (approx. 70 dB, far from being directly heard).
The corresponding wave without filtering yet:
It is very clear that infrasound sensors such as the raspberry unit are able to detect the unique signature of large wind turbines. Today the signature of wind turbines are well known and easy to recognise.
You will be able to find publications that documents that more expensive sensors will be able to detect wind turbines signatures in cases up to 90km.
The facts around wind turbines ability to create these special pressure waves are clear, and it was already documented by NASA research in the early 1980’ies. The relationship between infrasound and the effect on people was also established.
https://tinyurl.com/terjehauan
The interesting element, in this case, is the special relationship between these special pressure waves and man-made structures. Most people live and sleep in houses the effects of infrasound “playing” on stress can be very real and very disturbing. It is only partly true that infrasound (up to 20Hz) cannot be picked up by the human ear. I have tried and tested a rotary woofer in the ranges 1-15hz and you can REALLY feel the impact on your body! It made me vomit after 60 sec.
But, these are things that people must feel, you cannot read up on it!
I think its safe to say that wind turbines create something we dont find naturally occuring in nature.
I know and feel the effects, my wife less soo, and my kids not at all!
I guess like most things in life, our sensory systems are unique!
Some people get cancer, some people get tinnitus, etc… some not…
Military experiments indicate that only a smaller portion of people are seriously effected by infrasound, while bullets are proven to be 100% efficient…
A while back, I did a test where I short-circuited the air hoses and measured just self-noise of the RB. I had a high pass filter in SWARM to take out the frequencies below my mechanical filter frequency (20 seconds in my case). This gave some measure of the inherent noise level of the MEMS sensor and electronics. It’s quite large actually - I got about 60 dB. Your value of 70 dB sounds reasonable, for a quiet location (with no wind!). 70 dB at audible frequencies is said to be equivalent to a vacuum cleaner at a distance of 1 meter.
This sensitivity is about one million times higher than the threshold of human hearing at voice frequencies where humans hear best. Perhaps a more meaningful comparison is a good microphone - a really good self-noise number for a microphone is 15 dB (SPL). So the MEMS microphone has 45 dB more noise than a low-noise microphone. But it can “hear” at almost zero frequency where most microphones do not work. RS1D uses a type of microphone (geophone) that is is effectively more sensitive than RB. Loud sounds almost always register on my surface-mounted RS here whereas earthquakes only register on RS if they are strong (I am talking about frequencies above 10 Hz where it is relatively easy to shake the surface of the earth).
The RB is not quite as deaf as the above numbers indicate since through the magic of FFT you can see well below the noise level on any prolonged signal. I think if you use a window of 4 seconds you are getting 400 samples per plotted data point which may be worth 26 dB in SNR.
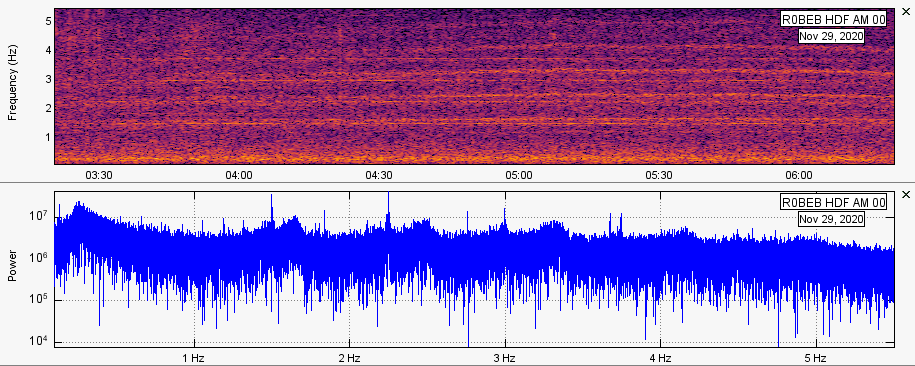
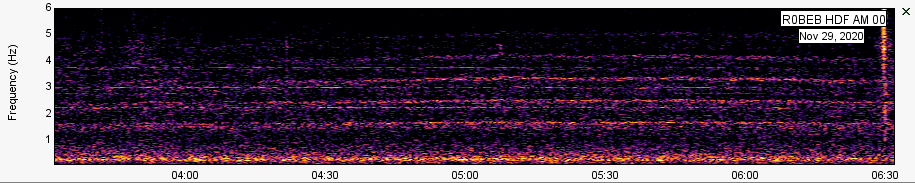
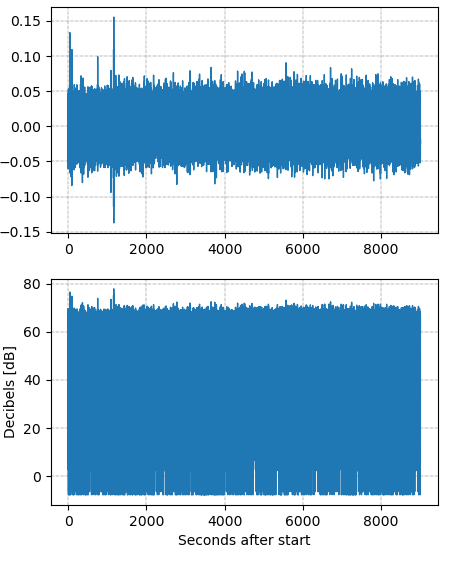
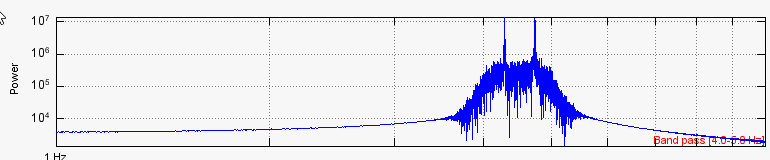
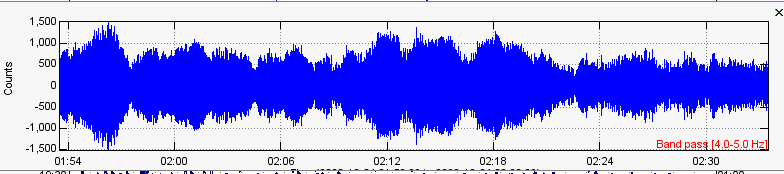
I wanted to look at one recent mystery signal that persisted for a few hours.
The SNR is pretty good, actually -
we can filter the signal plus noise in about 1 Hz BW
If I am not mistaken, we should subtract squares and take the square root
sig = sqrt(1000^2 - 250^2) = 968 (noise makes a relatively small contribution in this case)
at 5 Hz we have 968/56000 = 0.173 ==> 59 dB SPL for our mystery signal
our noise level is 250/56000 = .00446 ==> 47 dB SPL in ~ one Hz BW
That is a 12 dB SNR (in about 1 Hz)
The amplitudes on the power graph read roughly 13M for the signals and 0.5M for the noise floor between. That is a ratio of 26x or about 14 dB. That is close enough to the SNR ratio just calculated above and it also matches the y axis if you consider 10 dB per division.
Except that (in my understanding) “power” should be the square of the amplitudes (20 log not 10 log). (Probably power in a seismic context power is 10 log ??)
Anyway, it looks like you can read the SNR directly off the spectral view even if the technical basis is not correct. But you need to figure out the absolute value of the signal (or noise) from the amplitude graph (the wave view). And you could do that with Obspy - if you can figure out how to add filtering.
Please feel free to check the math (!)
Ken
Hello Ken,
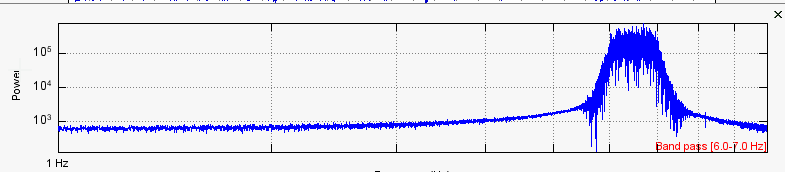
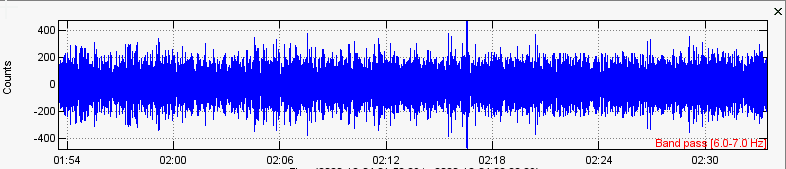
I found easily how to filter with obspy (Butterworth too). Here is a sample:
st[0].filter(type="bandpass", freqmin=1.0, freqmax=2.0)
Not that easy to find a slice of my signal that should not be influenced by harmonics. But I think I managed to get a small ‘noise’ slice.
Here are my results:
That would make a 15 dB SNR
I’m not sure what conclusion I can get from this, except it is a meaningfull signal…
(About your case, I don’t understand why you do this calculation : sig = sqrt(1000^2 - 250^2). As I understand, but I might miss something, dB signal - dB noise is enough, no ? Nethertheless, as you mentionned, it does not make a hudge difference at the end)
Thank you @terje to share your feelings, and documents.
Ken gave also the direct link to the study on his first post. I really recommend reading it, as it really help me grabing the signal.
About the potential effects on people…
I watched the “Planet e.” documentary nov. 2018 “Infrasound, noise we can’t hear”: https://www.youtube.com/watch?v=ywWNx3OJyuo
In which, indeed, we see John B, Alexander, former US Army Colonel who was in the 80s in charge of unorthodox weapons. He said exaclty that!
The timeline on your link is just astonishing. That’s incredible to see how Nasa’s 80s researches seemed to have been put under the rug…
The readings from RB are pressure readings. I am an electrical engineer, so when I hear pressure I immediately think voltage. Electrical power is proportional to voltage squared. And, in fact, sound pressure level in dB that we are always talking about is proportional to pressure squared. (That is why this formula has 20 instead of 10).
SPL = 20 log (P/Po) where Po is 20 micro-Pascals of pressure
Because noise and signal are in no way correlated, you cannot simply add the pressure magnitudes (they are complex variables having frequency and phase as well as amplitude). But you can add and subtract power numbers because they have only magnitude (strictly speaking, P should be an RMS value of the wave).
This is really only a consideration when you have a signal that is down in the noise.
======
The video was interesting. The German couple in question had seismic vibration of their house in addition to infrasound.
Tonight I stumbled across a detailed article on the subject of human ear response to infrasound:
From figure 3, it would seem that your OHC’s (outer hair cells) have a threshold of about 80 dB SPL at 3 Hz (see the graph). I would not expect to see any effect at levels more than 10 dB below this, so 70 dB. That is quite a bit less (1000x’s less) than the 100 dB level where there are “physiological effects”. But it is still 10x higher than the 60 dB level you recorded with RB.
On the other hand - signals I see here fade in and out (as a function of atmospheric ducting I suppose). So you might have times when the level is stronger than what you are measuring at the moment. If the signal occasionally rose 20 dB, it would be strong enough to have a biological effect - if you were sensitive to that sort of “stimulation”.
Ken
Facts are not what they used to be, now its tricky to know facts from fake news.
Current wind turbine companies claim that the facts from these project is not valid, as they changed the blad position from down to upwind  An interesting concept, if you skip out the physics of it
I would like to add another reference:
https://asa.scitation.org/doi/10.1121/1.5051331
These folks did a lot of measurement with low-frequency microphones and micro-barometers around large wind turbines and during a variety of weather conditions. A huge amount of work.
Some findings are: that wind turbine signatures are readily detectable up to 10 km under most weather conditions and that levels at the low frequency can be 10-11 dB stronger than the 6 dB per double-distance rule.
One interesting thing I found in here is that the sound power level emitted by a 3 MW wind turbine is up to 130 dB (relative to 10^-12 W) - as shown in Figure 13.
Bur - if we do the calculation per http://www.sengpielaudio.com/calculator-soundpower.htm and assume a directivity factor of 2 (reflection from the ground) then you find you need to be within about 125m to reach a sound pressure level of 80 dB.
So: if you are many km away from the turbine(s) it’s quite unlikely you will be exposed to a level that generates response in your OHC. Under unusual weather conditions, though, you might reach this level at a few km’s distance. This is a bigger distance than siting guidelines based on audible noise alone.
Using a 4-second measurement window you can detect wind turbine signatures well below the 80 dB SPL. And if your ambient is quiet enough, you can make an estimate of the actual sound pressure level by filtering down to a slice of 1 Hz BW. So if you think you have a problem from infrasound, you could establish that you are being exposed to it using RB (my conclusion).
… Ken
Perhaps this should be a new topic, but my interest is measuring infrasound from military aircraft. Aircraft from a nearby base fly over our house. Sound levels approach 120dB. I ‘feel’ there is a substantial infrasound component. I’ve read that RBOOM has automatic gain calibration. My concern is that the possible high SPL (either audible or infrasonic) will saturate the RBOOM amps. I am hoping someone here has words of wisdom for me. TIA.
Bill
Some specs can be found here:
https://manual.raspberryshake.org/specifications.html#id7
Because I use a 20-second mechanical filter, on windy days here I see 1 million counts from time to time and no sign of saturation. 56,000 counts is 1 pascal (at ~5 Hz). So 1E6 is 17.5 pascals or 119 dB SPL. Of course the frequency content of wind is below 1 Hz so it’s not really “sound” as such. I would not want to be exposed to 119 dB SPL in a higher frequency range - at least not very often.
The RB analog input has a range of about +/- 8 million counts so the above number is 1/8 full scale, although you have to allow some range for zero drift (which is automatically calibrated out.with a time lag).
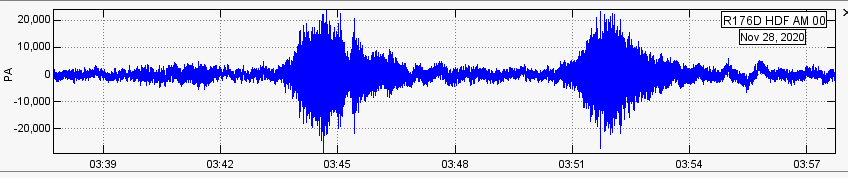
Commercial aircraft pass over here a lot. Typical readings are 20,000 counts (106 dB SPL). My intake piping array has a resonance at 25 Hz, so I get the most response there. Bearing that in mind, this is what airplanes look like here (the “blobs”):
:
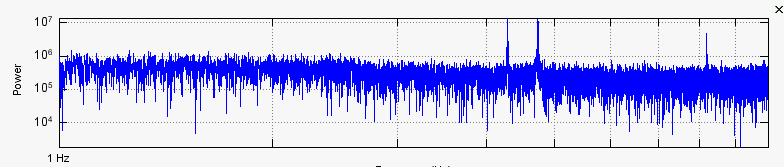
And this is the frequency spectrum (during evening “rush hour” note how close the departing planes are spaced):
I think 120 dB should be no problem for RB. The next time we have a really windy day I will have to remember to check to see if we ever hit the top of the range.
Ken
.
Interesting. I’m taking another look at those specs. Thank you Ken
Bill