Hello,
Could someone please help me understand how to interpret the Spectraview on Swarm. How is it different to the wave view and what info does it give us?
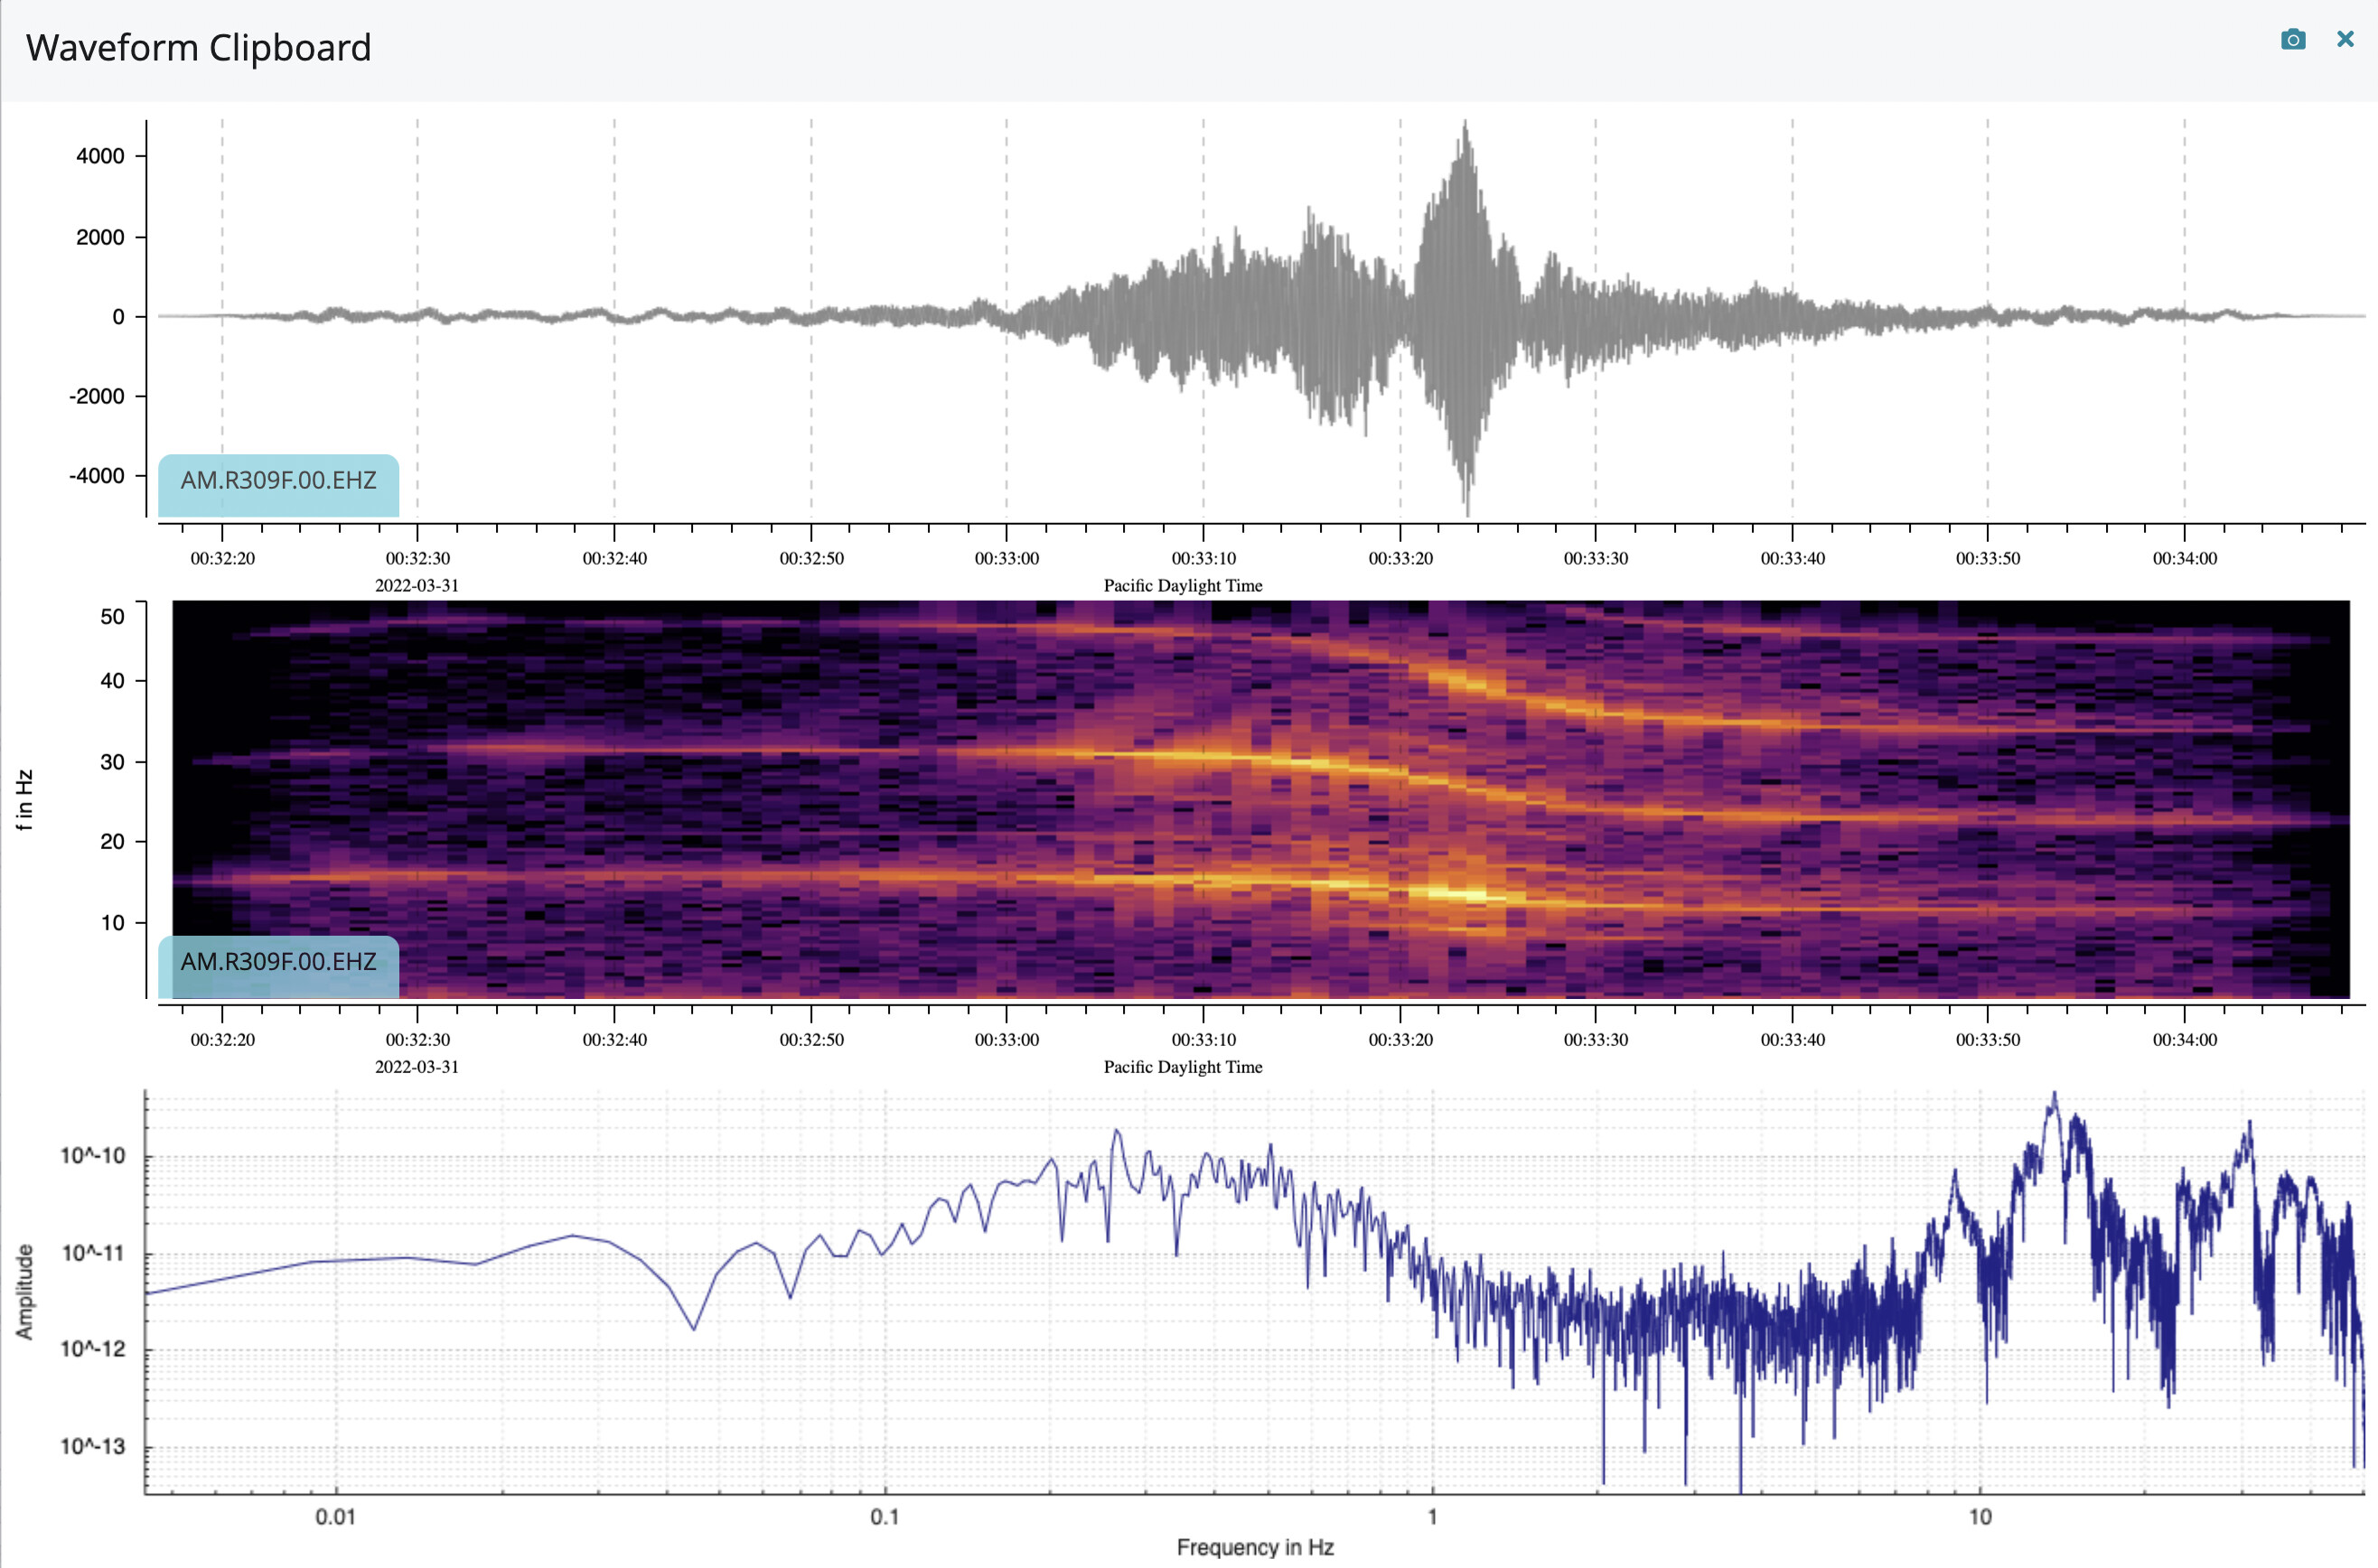
Attached is a spectra view for an earthquake.
Thank you.
Hello,
Could someone please help me understand how to interpret the Spectraview on Swarm. How is it different to the wave view and what info does it give us?
Attached is a spectra view for an earthquake.
Thank you.
The wave view shows ground movement. How far it moves at a specific time.
The ground moves at different rates (frequency, how may times per second it moved up and down).
The energy behind this usually occurs at different frequencies, with more or less energy at different frequencies - that is what the spectra view is showing. Not how much the ground moved, but at what what frequencies, and the relative power at each frequency.
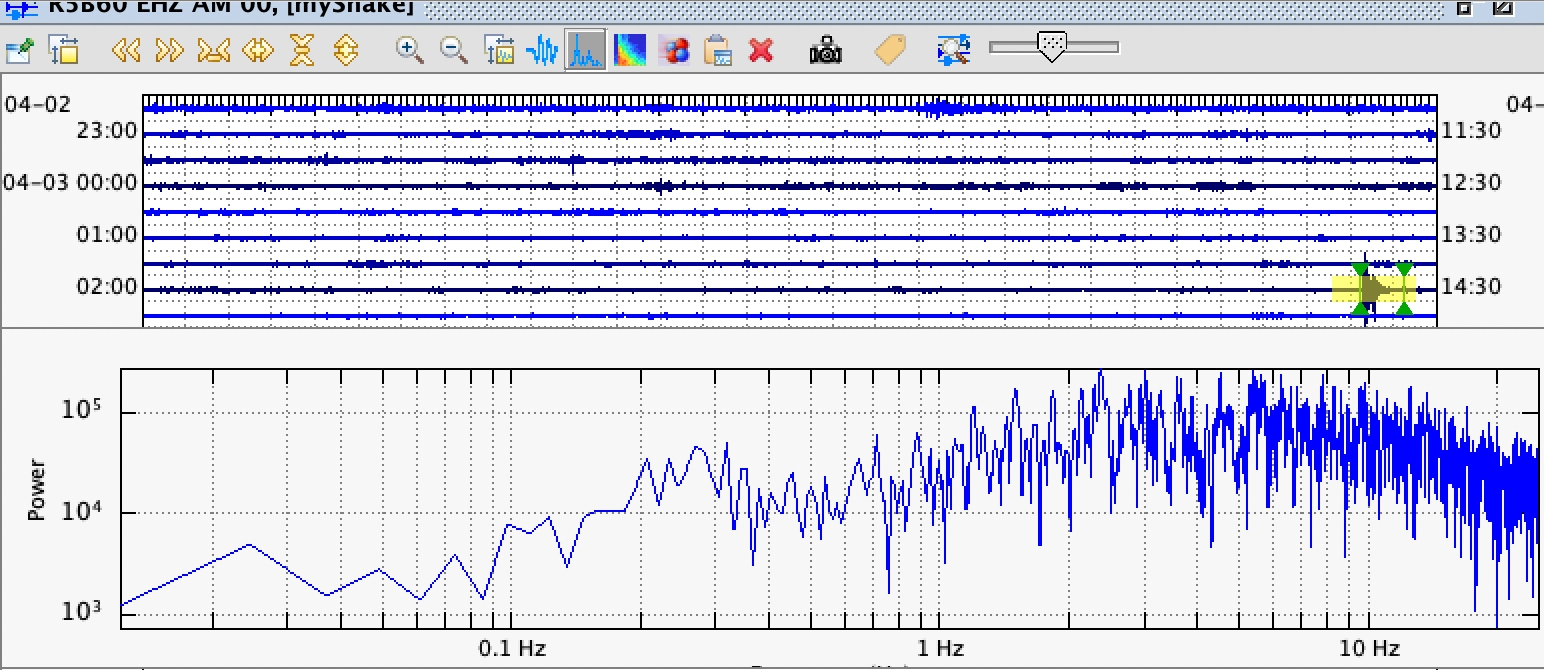
These graphs, taken from the on-line dataview application are not of an earthquake, but of a pass by a large twin rotor helicopter (Chinook style). As you have probably observed if one of these flys over your house, it shakes the ground, so gets picked up by a seismometer quite easily:
The top trace is the “wave” view, showing the ground movement.
The second one is the same signal split into different frequencies over time. The higher amplitude the signal at the given frequency, the brighter the image.
There are three really obvious frequencies, and you can tell it is a moving object causing this by the doppler shift in the frequency - higher as it comes towards us, gets really intense overhead, then the frequency and intensity drop off as it goes away.
Look at the frequencies of these lines of light … one about 14 Hz, one about 30 Hz and a smaller one at about 47 Hz.
The bottom graph shows the frequency intensity for the whole of the sample period. You can see the spikes corresponding to each of the signals. Because it is for the whole sample period, and the frequencies are changing, it is not as clear as it might be, but I think clear enough to give you the idea.
That’s a good explanation, Philip.
I’d contend that apart from your example where we have oscillations at a near constant frequency, Fourier spectra are useless for analysing records from RSs.
The reason relates to Heisenberg’s uncertainty principle (paraphrased):
For precision in time, you must accept a certain vagueness in frequency; and
for precision in frequency, you must accept a certain vagueness in time.
A time record has no information about frequency; a Fourier spectrum has no information about time (it has been integrated out).
Because RS records vary in both time and frequency, you need a compromise between the time record and the Fourier transform. That compromise is the spectrogram, in which you see the variation with both time and frequency.
I will leave that to the real geologists to answer.
But my “gut” feeling is that the graph would look quite different between (say) a landslide, a volcanic eruption and an earthquake. So maybe not totally useless