Good Day everybody,
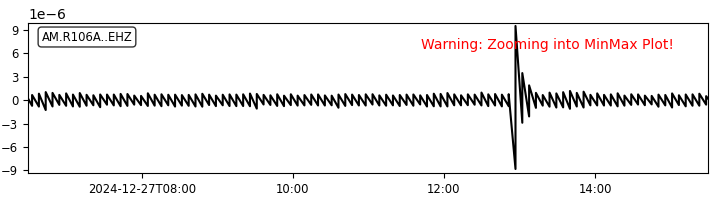
when i try to plot my Data using obspy, I get a weird Plot with, which seems to be these triangular Datapoint. I have tried to use different filters and frequenzies to get rid of this Problem, but nothing seems to be working. This is the Code i am using for the plot:
import obspy
from obspy import UTCDateTime
from obspy.signal import PPSD

s = obspy.Stream()
s+=obspy.read(f"F:/Raspberry Shake Messdaten/EHZ/AM.RACB0.00.EHZ.D.2024.361")
s+=obspy.read(f"F:/Raspberry Shake Messdaten/EHZ/AM.RACB0.00.EHZ.D.2024.362")
s+=obspy.read(f"F:/Raspberry Shake Messdaten/EHZ/AM.RACB0.00.EHZ.D.2024.363")
s = s.merge(fill_value="interpolate")

s2 = s.copy()
inv = obspy.read_inventory(f"F:\out3.response.restored-plus-decimation.dataless")
for tr in s:
    tr.stats.station = "R106A"
    tr.stats.location = ""

    tr.remove_response(inv, output="ACC")

s=s.detrend(type="demean")
s=s.taper(0.1)
s=s.filter("bandpass", freqmin=0.03, freqmax=0.4, corners=4, zerophase=True)
s.plot()
And if i try to plot the Data without the filters, i get the same results.
Thanks in advance,
Stefan
RSH.RACB0.2025-01-06T12_14_04.logs.tar (1.2 MB)
2 Likes
Hello Stefan,
A couple of questions to help you with more precise advice:
-
I am seeing that both logs and data are from station RACB0, while the printed station label on the plot shows station R106A. Could you clarify this discrepancy?
-
Could you zip the raw data (and the inventory) you used to plot, upload them to any service like Dropbox, Mediafire, or similar, so that I can try to replicate what you’re seeing?
Thank you very much.
Hey Stormchaser,
So firstly the station name is R106A, since we used the instrument responce Data from that station since we figured, that it wouldnt make that much of a difference.
I send you one set of Data, that we measured for today, since it doesnt matter what Data we used, they all look the same. I have even tried now with commenting out everything even the instrument response and it just wont do. I have collected the Data in the zip file below, with the Code aswell.
https://www.mediafire.com/file/rctg1nob5388z0d/RaspberryShake.zip/file
Best regards,
Stefan
1 Like
Hello Stefan,
Thank you very much for all the data and the scripts. As I couldn’t find the inventory file you’ve used in the zip, I adapted the one I use for my Shake (which also is an RS3Dv9). I’ll attach it here:
invRACB0.xml (14.2 KB)
This is the code snipped I used (reworking a couple of bits here and there just for testing purposes):
import obspy
from obspy import UTCDateTime
from obspy.signal import PPSD

s = obspy.Stream()

s = obspy.Stream()
file_paths = [
    f"Raspberry Shake Messdaten/EHZ/AM.RACB0.00.EHZ.D.2024.{day:03}" for day in range(348, 367)
] + [
    f"Raspberry Shake Messdaten/EHZ/AM.RACB0.00.EHZ.D.2025.{day:03}" for day in range(1, 6)
]

for file_path in file_paths:
    s += obspy.read(file_path)

s = s.merge(fill_value="interpolate")

s_raw = s.copy()
s_raw=s_raw.detrend(type="demean")
s_raw=s_raw.taper(0.1)
s_raw=s_raw.filter("bandpass", freqmin=0.03, freqmax=0.4, corners=4, zerophase=True)
s_raw=s_raw.trim(UTCDateTime("2024-12-27 06:30"), UTCDateTime("2024-12-27 15:30"))
s_raw.plot(equal_scale=False)

inv = obspy.read_inventory(f"invRACB0.xml")
print(inv)
print(s)

for tr in s:
    tr.stats.station = "RACB0"
    tr.stats.location = "00"

    tr.remove_response(inv, output="ACC")

s=s.detrend(type="demean")
s=s.taper(0.1)
s=s.filter("bandpass", freqmin=0.03, freqmax=0.4, corners=4, zerophase=True)
s=s.trim(UTCDateTime("2024-12-27 06:30"), UTCDateTime("2024-12-27 15:30"))

s.plot(equal_scale=False)
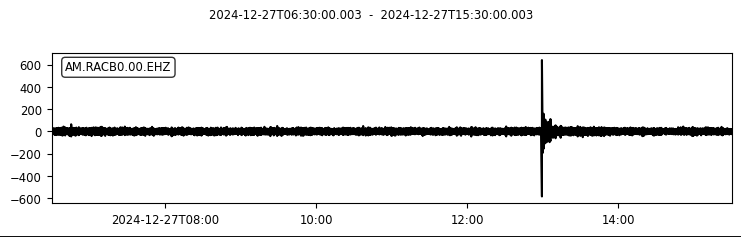
But the results appear “normal” on my side, below. The first shows the “raw data”:
While this second one shows the acceleration data once the response is removed:
I tried to match your interval by manually adjusting the trimming start and end times.
Can you try and check if you are still seeing that “saw” pattern with my code snipped and inventory?
Hey Stormchaser,
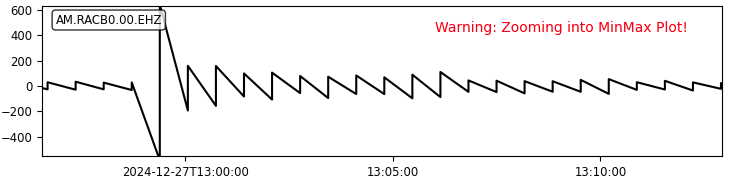
I have tried to use your Code, with the added inventory, but i dont know what is happening, but the inventory.xml doesnt seem to remove the response. But it seems like the Code hasnt changed the outcome. Is the Data also sawlike, when you zoom in?
I am confused, since the Shake should measure at 100 Hz, but the points are apart of like 30 seconds.
Thanks for the quick responses
Edit:
The Compiler also shows that the Strings have enough samples for the Time:
,which confuses me even more
1 Like
Hello Stefan, no trouble at all.
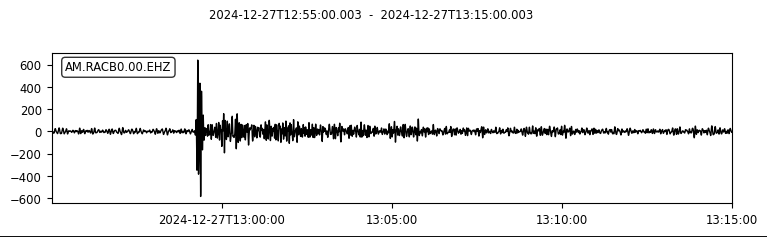
I have re-created the new timeframe (approximately), and this is the “raw” result:
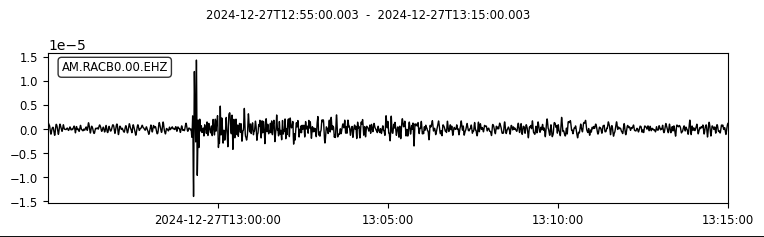
While this is the “inventory-removed” result:
I think that the reason why you’re seeing that pattern is due to the plot zoom. When zooming in without replotting, data (which is there, as you have seen from the trace details) is not resampled, and this pattern appears.
This is because, while the min/max plot is useful for quickly identifying significant events, such as large amplitude variations or spikes, it doesn’t deal with the full resolution data (e.g., down-sampled for efficient storage or visualization).
I would recommend adjusting the trimming of the timeframe you’re interested in (maybe after using the min/max plot to identify a general period of time) without zooming.
You should get well-defined traces in this way.