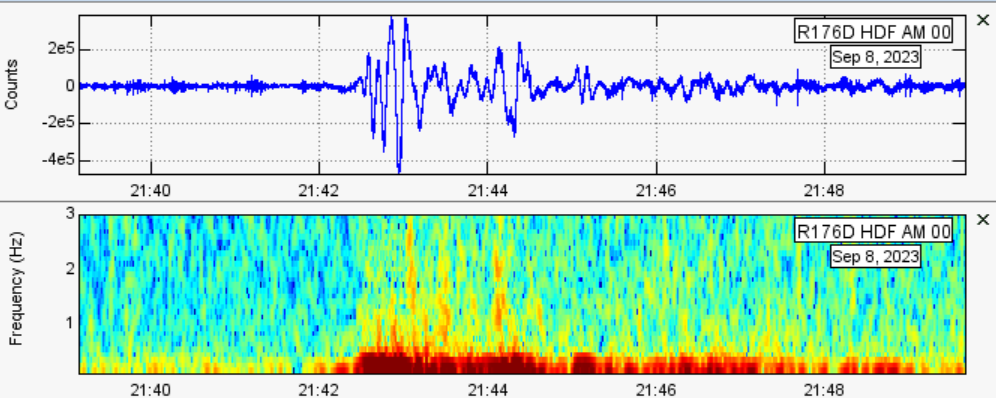
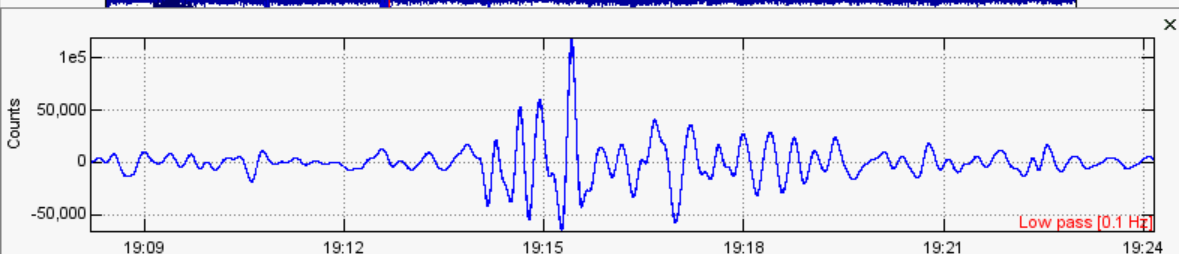
The other day my 9-year-old granddaughter came up to me and said “my ears are vibrating”. I could not hear anything, but I knew a rain storm was approaching. A while later I checked RB and found this trace, right at that time:
This is actually quite a common occurrence when a storm passes over, or nearby. Sometimes readings up to 1E6 counts are recorded. The frequency is in the range of 0.1 Hz (my RB has the long time constant filter).
This little girl has rather sensitive ears, it seems.
I didn’t fit mine either - I thought it would be better to have the wider bandwidth.
I am no longer convinced about that. Maybe R-Shake should re-think which one they fit by default?
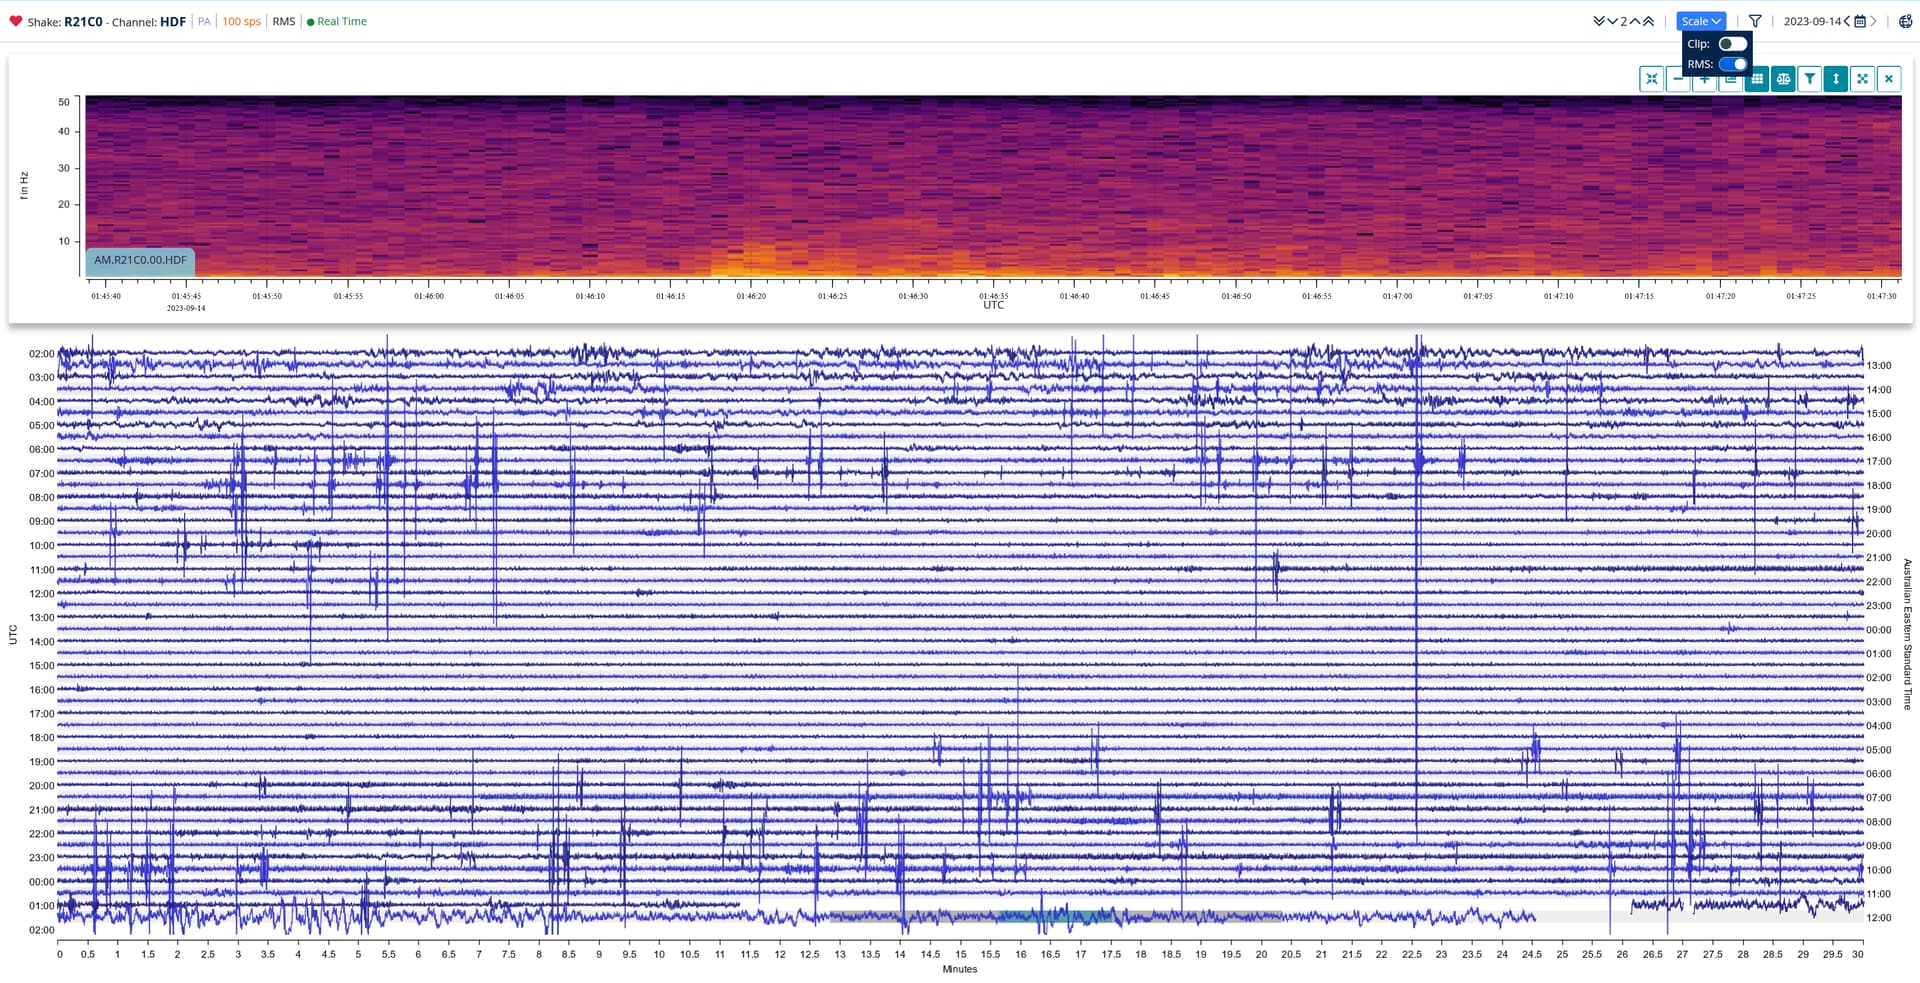
FWIW Here’s a shot of the helicorder after doing the change. The difference is quite visible.
No idea what the VLF event was that I was looking at at the time. ;o)
I’d like to think that it may be possible to detect atmospheric gravity waves with this filter installed. I detected the Tonga Eruption gravity waves with my barometer, but from memory the period was longer than 20s.
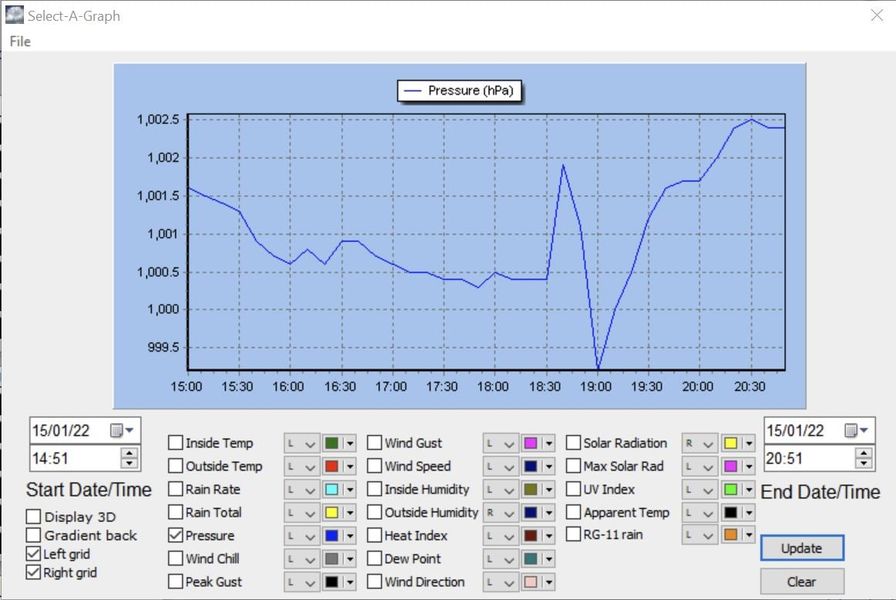
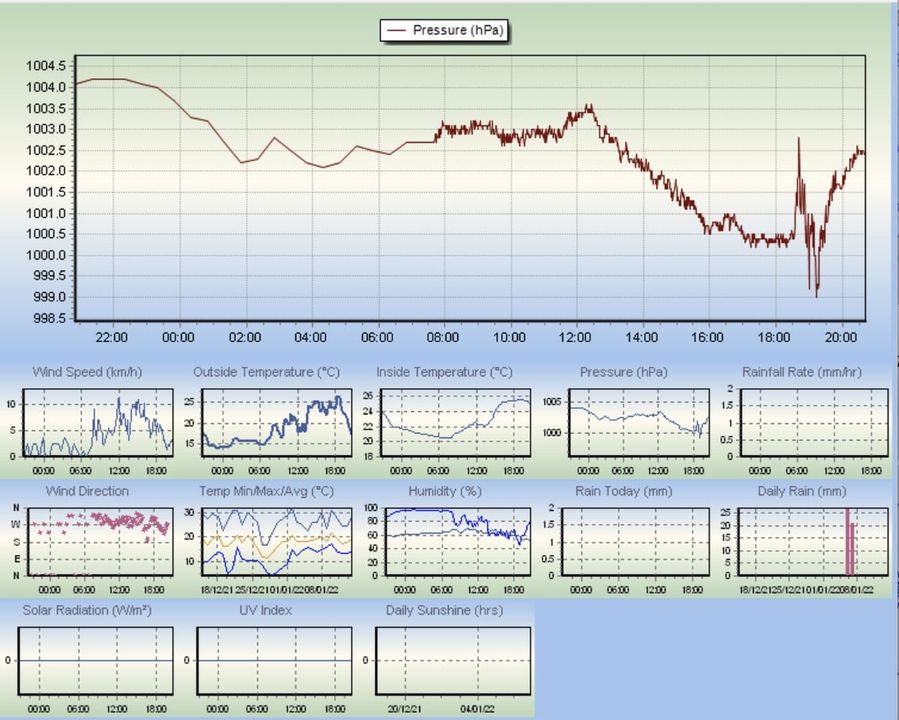
These were produced from Cumulus software. The Select-a-Graph unfortunately uses the archive file which only stores data every 15mins! The other graph was a screen shot of the pressure graph from Cumulus which updates the data every 10 or 15s (I can’t remember which now…) while the software is running.
While the base frequency of the wave (period of about 45 minutes or so) is too low a frequency for a Boom even with a 20s filter, I’d like to think there are some frequencies apparent in the Pressure graph that should be detectable with a Boom.
The lower graphs are filtered for 20-100 seconds - a bandpass that just touches the range of RB with the longer mechanical filter. The right hand side graph was measured in Kenya about 1/2 way around the planet…
I think this is the corresponding trace from my RB (lots of RBoomers saw it) seems like the “tip of the iceberg”