Are there any tutorials for newbies that go over the basics of interpreting the spectrograms and explain in more detail what happens when you adjust the various settings and views? If there are some, I’d love to see, in particular, some videos that step you through the graphs and settings, and perhaps give interpretations of various signatures. Something to help someone who is not versed in this stuff to understand what they are seeing. I feel like there’s a whole story unfolding and to be teased out, but I think for some of us it’s just a bunch of squiggly lines. The bigger and brighter the lines, the bigger the event, that much is intuitive–but almost uninteresting. I see videos and tutorials on installing the units, but not much on interpreting what I am seeing. Or am I just missing them? Thanks much.
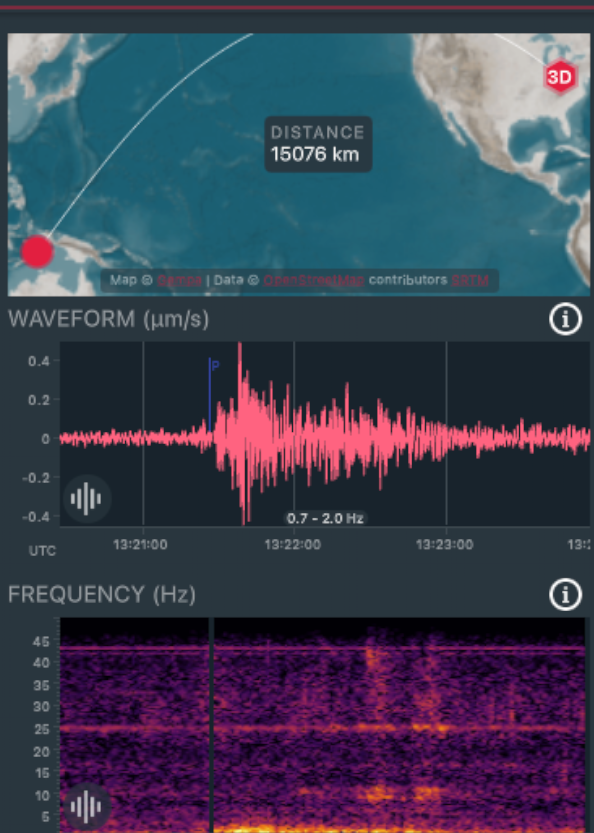
Could be quite useful. I’ve learned a little bit over the past couple of years of monitoring my shake 3D. I generally just use the App and view the Events, so you can get a snapshot of both the actual waveform at the top and the Spectra display at bottom. If the quake is strong enough to be detected, look at the waveform for the “P-Wave” arrival time, directly below that in the spectra, look for a “Bump” in the low frequencies usually 5 hz or below. Seeing that means you have actually detected the quake with your Shake. Here’s a screen capture of an event in the Banda Sea (a 6.7 magnitude on the 8th of this month.
Maybe this should be it?
I appreciate some people love videos and different people have different learning styles, but one thing I appreciate about a written tutorial (like perhaps what we could create in this thread) is that it’s easy to scan to find what you want.
Before I retired I was a professional mechanical engineer, and during my career I had a reasonable exposure to vibration analysis, so the tools we use in seismology are very similar and familiar, but like a lot of others I too am learning what the (seismic) signals mean. I’ve had my shake and boom for nearly 2 years, so I’m no seismology expert but happy to share what I’ve learned.
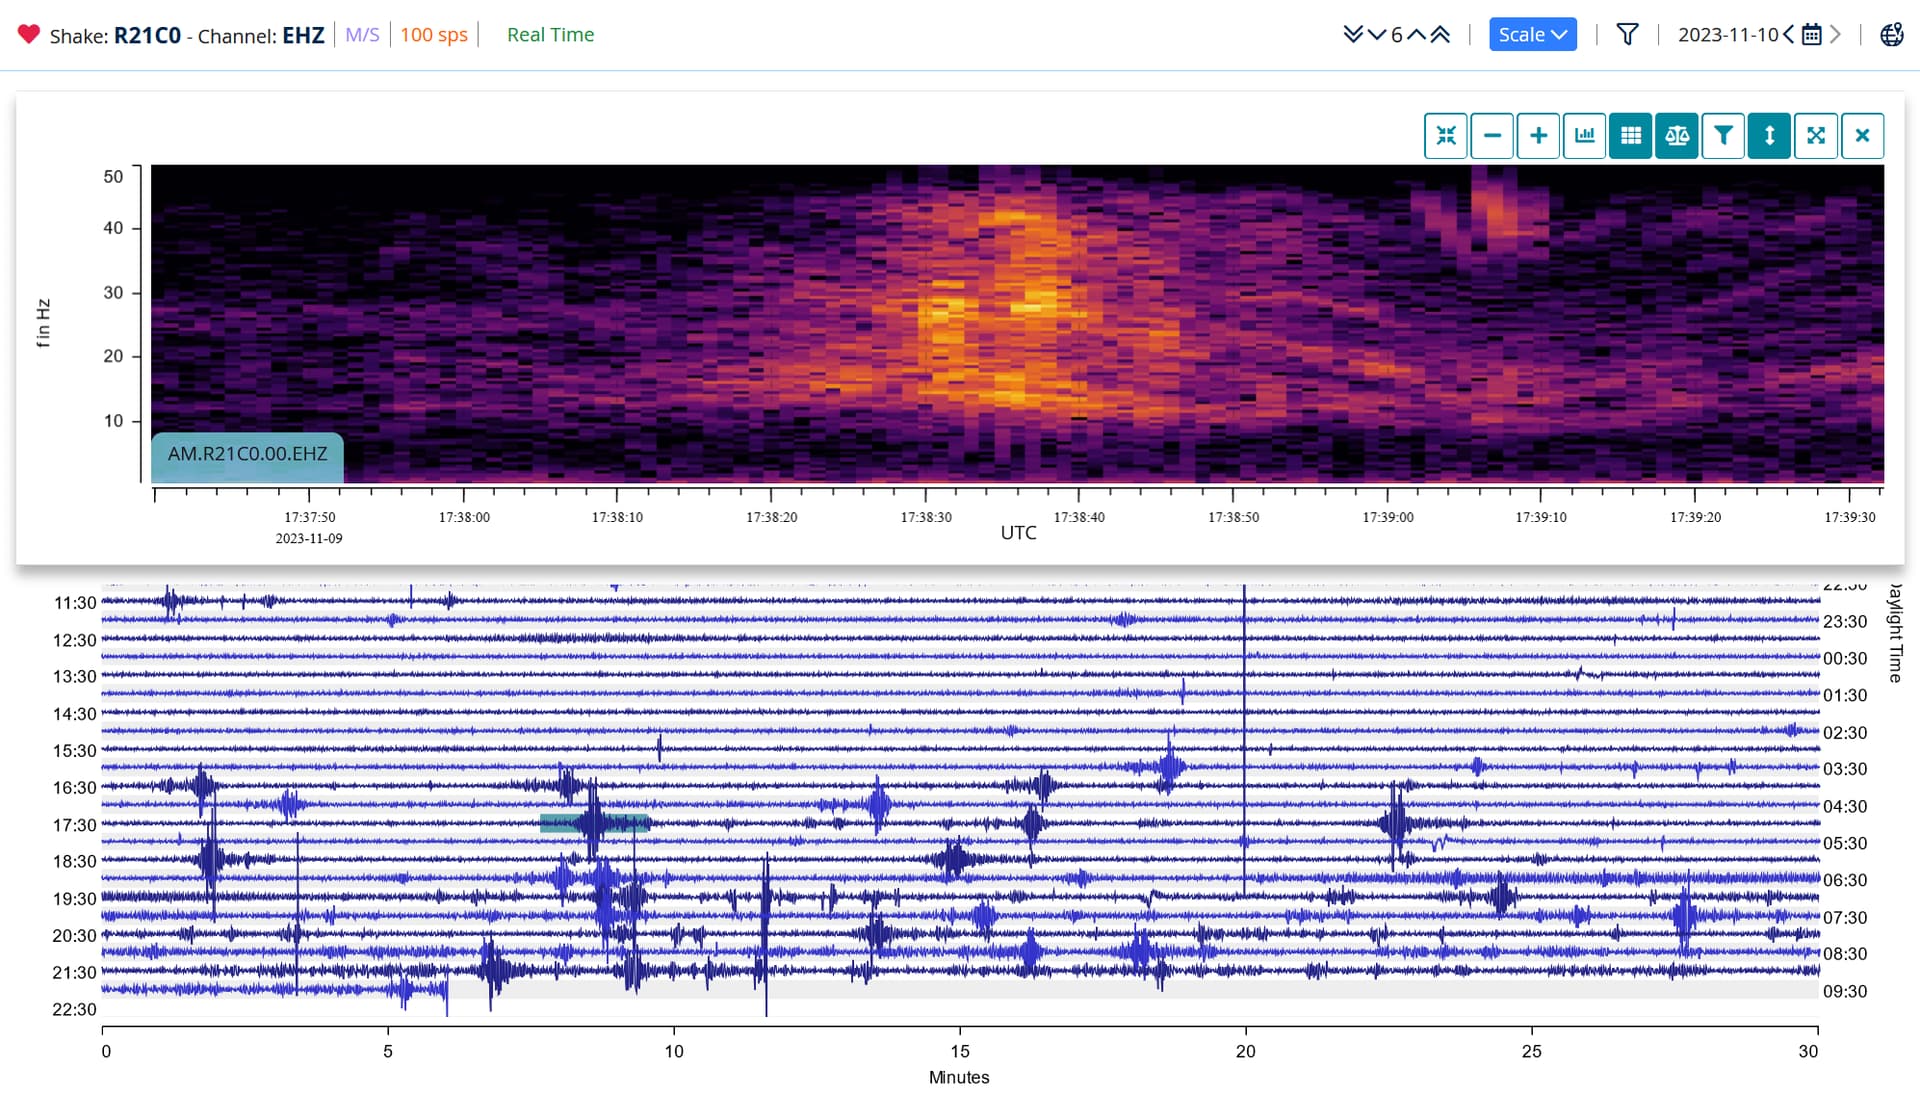
Here’s a typical page from the helicorder of my shake:
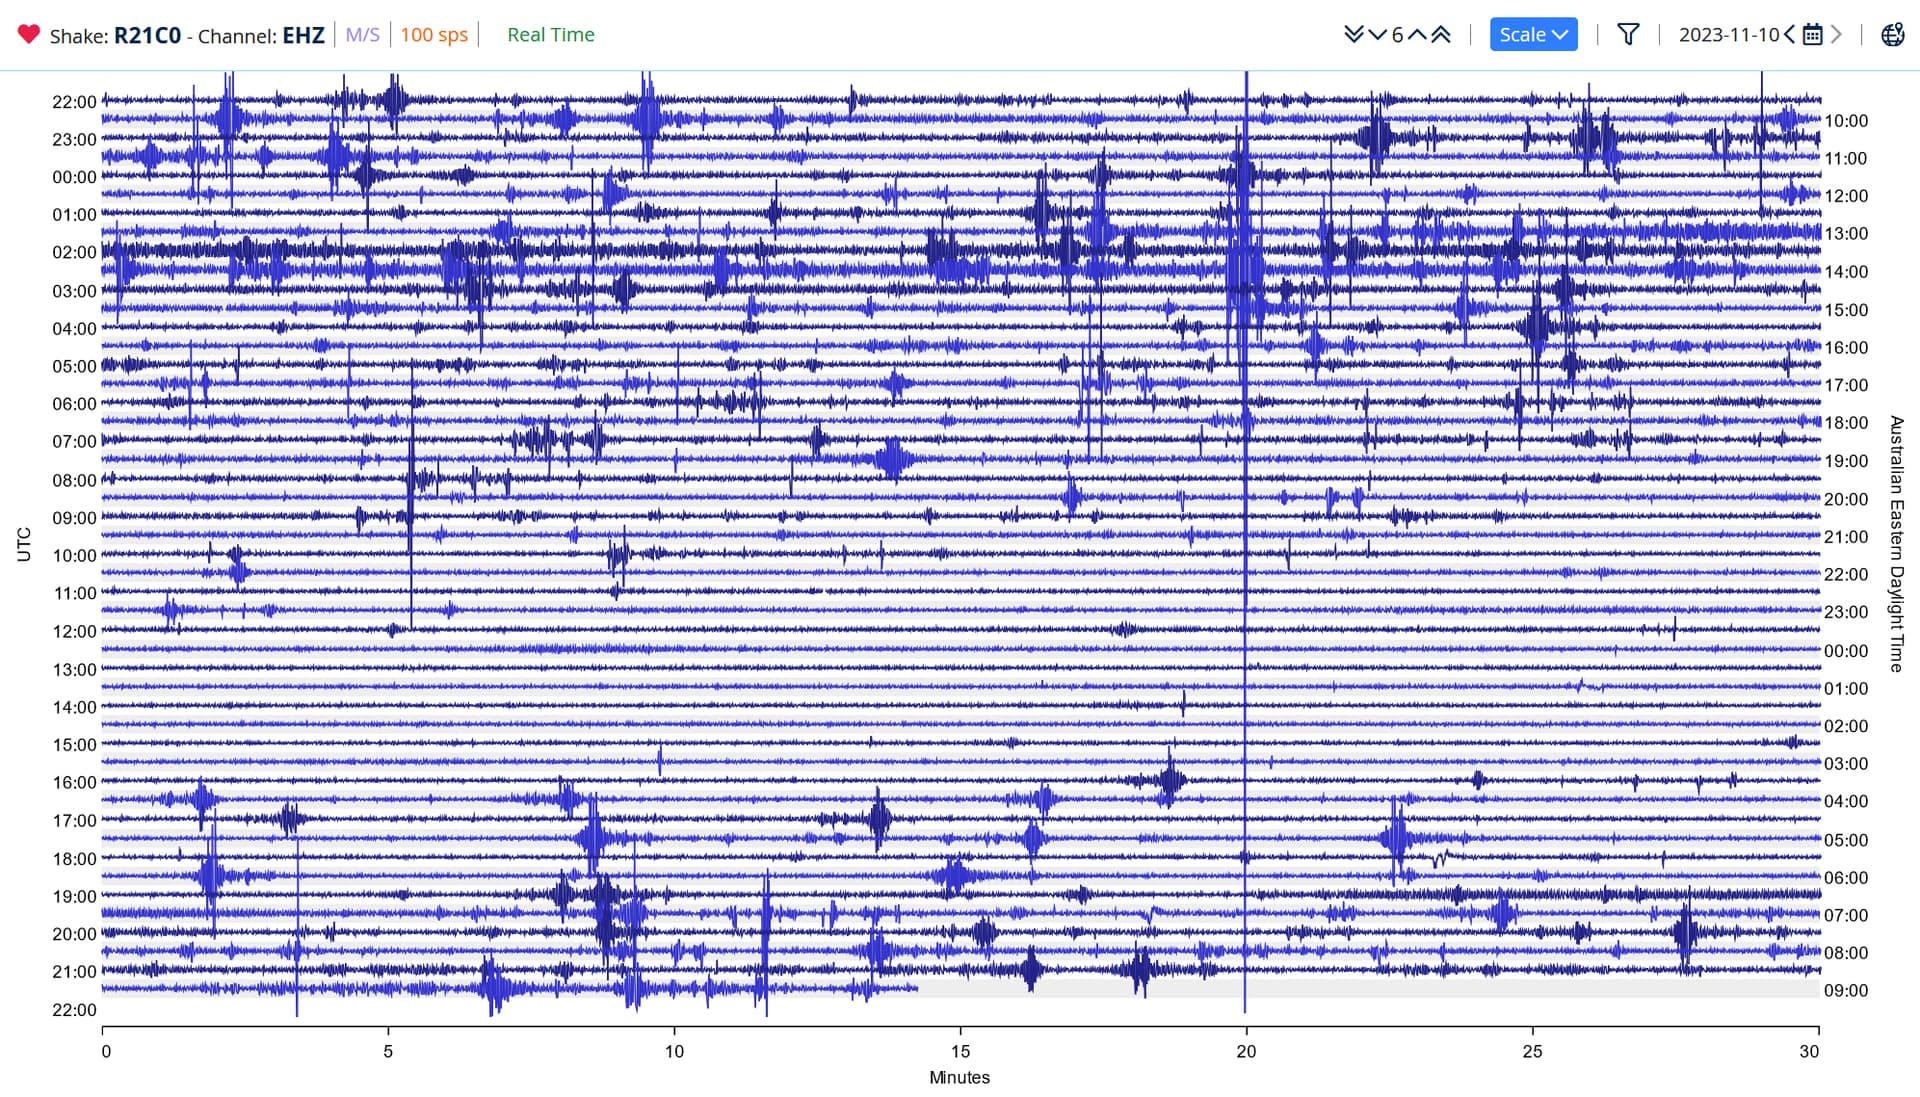
Lots of blobs spikes, etc.
For something to be big on the helicorder, it has to be either VERY big in the real world, or very close to the shake. Big things rarely start and stop moving very quickly, so big spikes are almost definitely something close. Most times we aren’t interested in them.
I know from experience that a lot of the blobs on my helicorder are passing trucks. The road is less than 100m from my house (and the shake). Here’s the waveform:
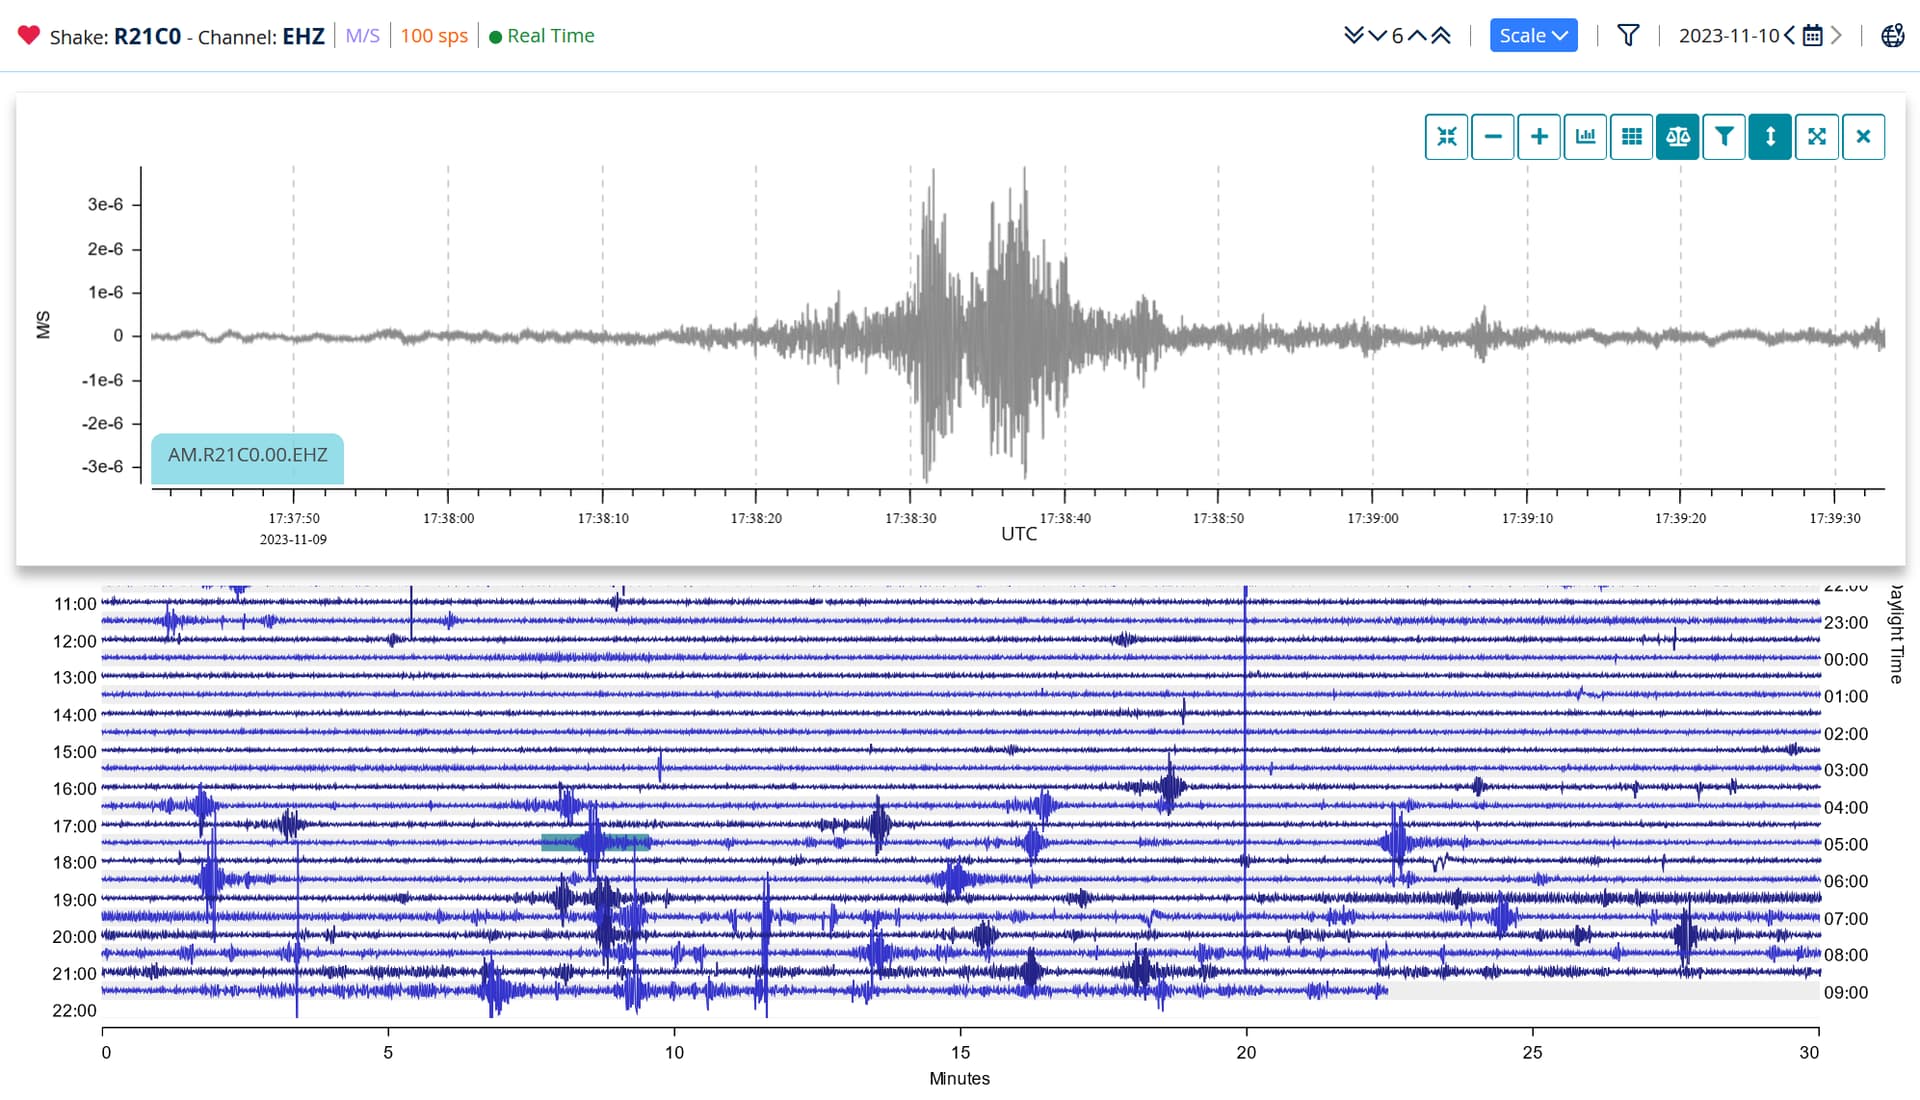
Notice the waveform builds as the truck approaches and decays as it leaves. The hourglass shape in the middle is pretty typical. It’s not the front and back axle of the truck passing as the trucks are B-double log trucks, so 3 sets of bogies plus the steering axle. Perhaps its a result of waveform interference from the different axles, I don’t know.
If we look at the Power Spectral Density graph:
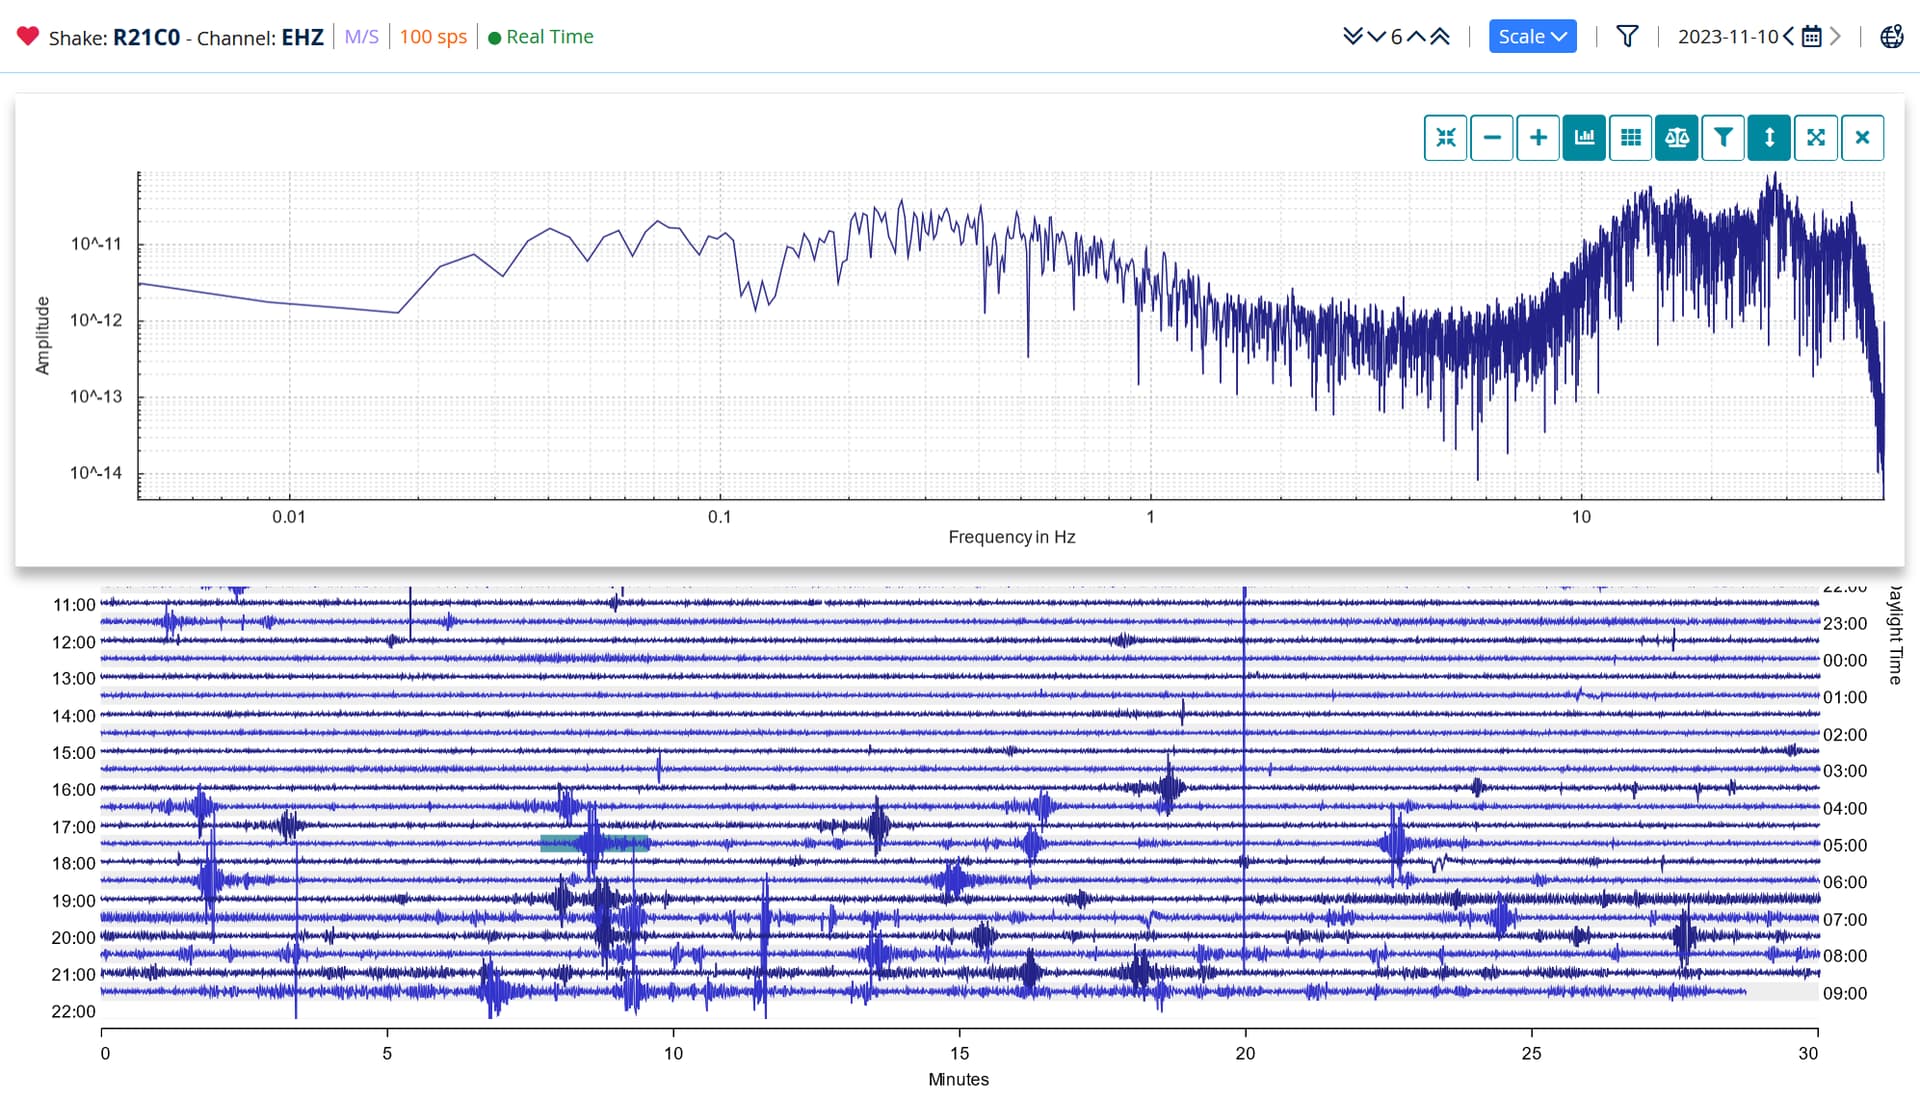
Power Spectral Density is basically an extension of Fast Fourier Transform analysis which identifies the frequencies which make up the signal. FFT is vital to vibration analysis in machines to detect faults, and here it can tell us a lot about the waveform.
In this case, the signal is very strong above about 10Hz, and there is a dip between about 1 Hz and 10Hz. This is typical of a lot of man made seismic signals, or cultural noise.
This is of course the spectrogram. This plots frequency against time. If you like, each column of the spectrogram is a miniature PSD or FFT plot where the value is mapped in colour. If you added up all the columns from left to right it would basically reproduce the PSD or FFT plot.
Once again, notice the Spectrogram is pretty dark from 1Hz to 10Hz. This is a sign that the signal is probably man made and not like an earthquake. The trucks pass our place relatively slowly as they are loaded coming down the hill and have to turn at the bottom (300m away from our house). The “star burst pattern” on the right hand side of the spectrogram shows the trucks slowing for the corner and then accelerating away. The centre of the star burst is when the truck is taking the corner. The lines in the star burst patterns are the frequencies of things on the truck line wheel rotation speeds, etc so you see the lines slope down to the corner and then up after the corner.
Earthquakes are very strong at low frequencies and the the signal strength gradually decreases with increasing frequency. This is a result of attenuation of the signal as it travels. High frequencies are attenuated more quickly than low frequencies. So, if you are on or very close to an earthquake, the signal will contain lots of frequencies from low to high and all very strong, but if you are a long way away, only the lowest frequencies will remain in the signal.
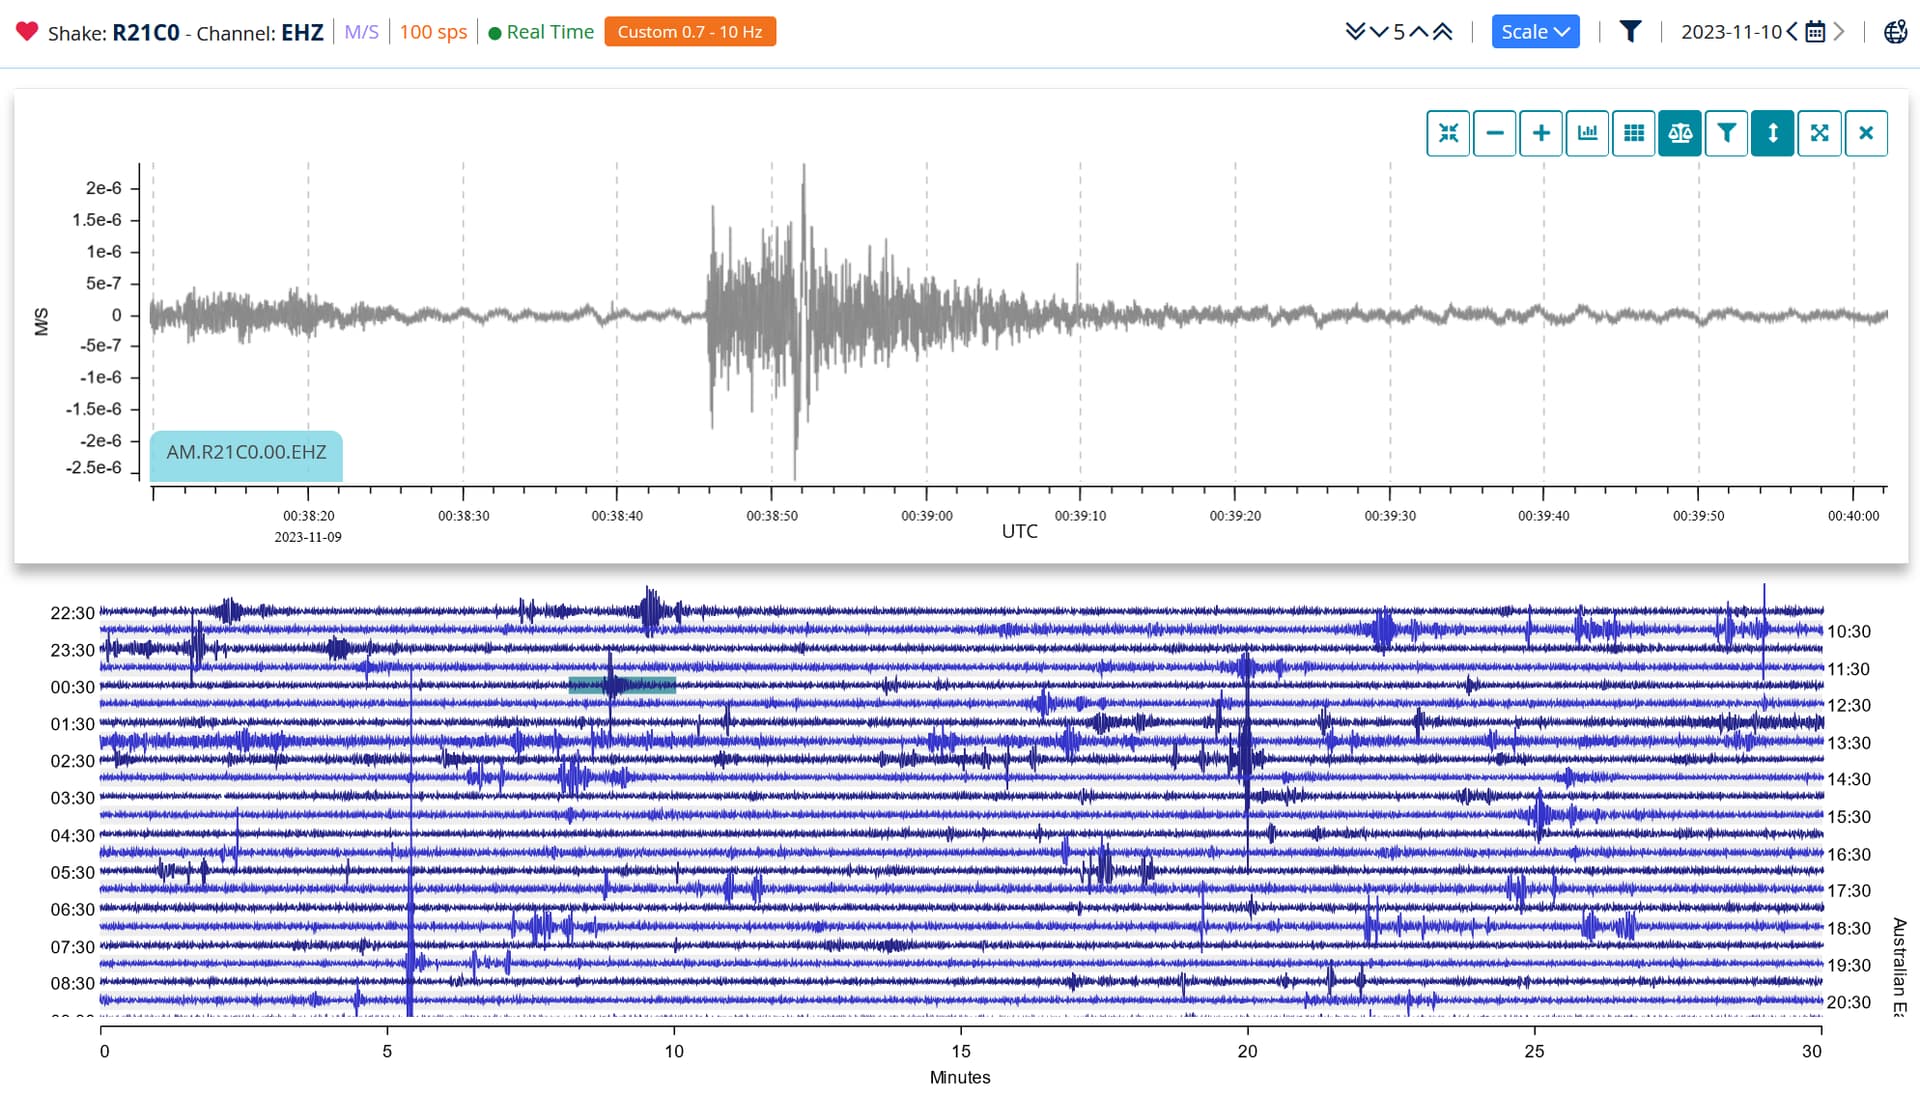
In the above image I have applied a 0.7 to 10Hz bandpass filter to the helicorder to look for small local earthquakes, and found one at 00:38:46UTC. Without the filter it is hard to distinguish from a passing truck, but once everything above 10Hz is filtered out the characteristic shape of a quake is revealed.
The signal starts abruptly with the arrival of the P wave at 00:38:46UTC. The S wave then arrives at 00:38:51UTC, and then the signal decays. More distant quakes will have more time between the P and S wave arrival times, because the P waves are compression waves and travel faster than the S waves which are transverse waves.
This example is quite small and probably within a few hundred kilometres and is probably a mine blast from around the Mudgee, Hunter Valley area.
Here’s the corresponding spectrogram:
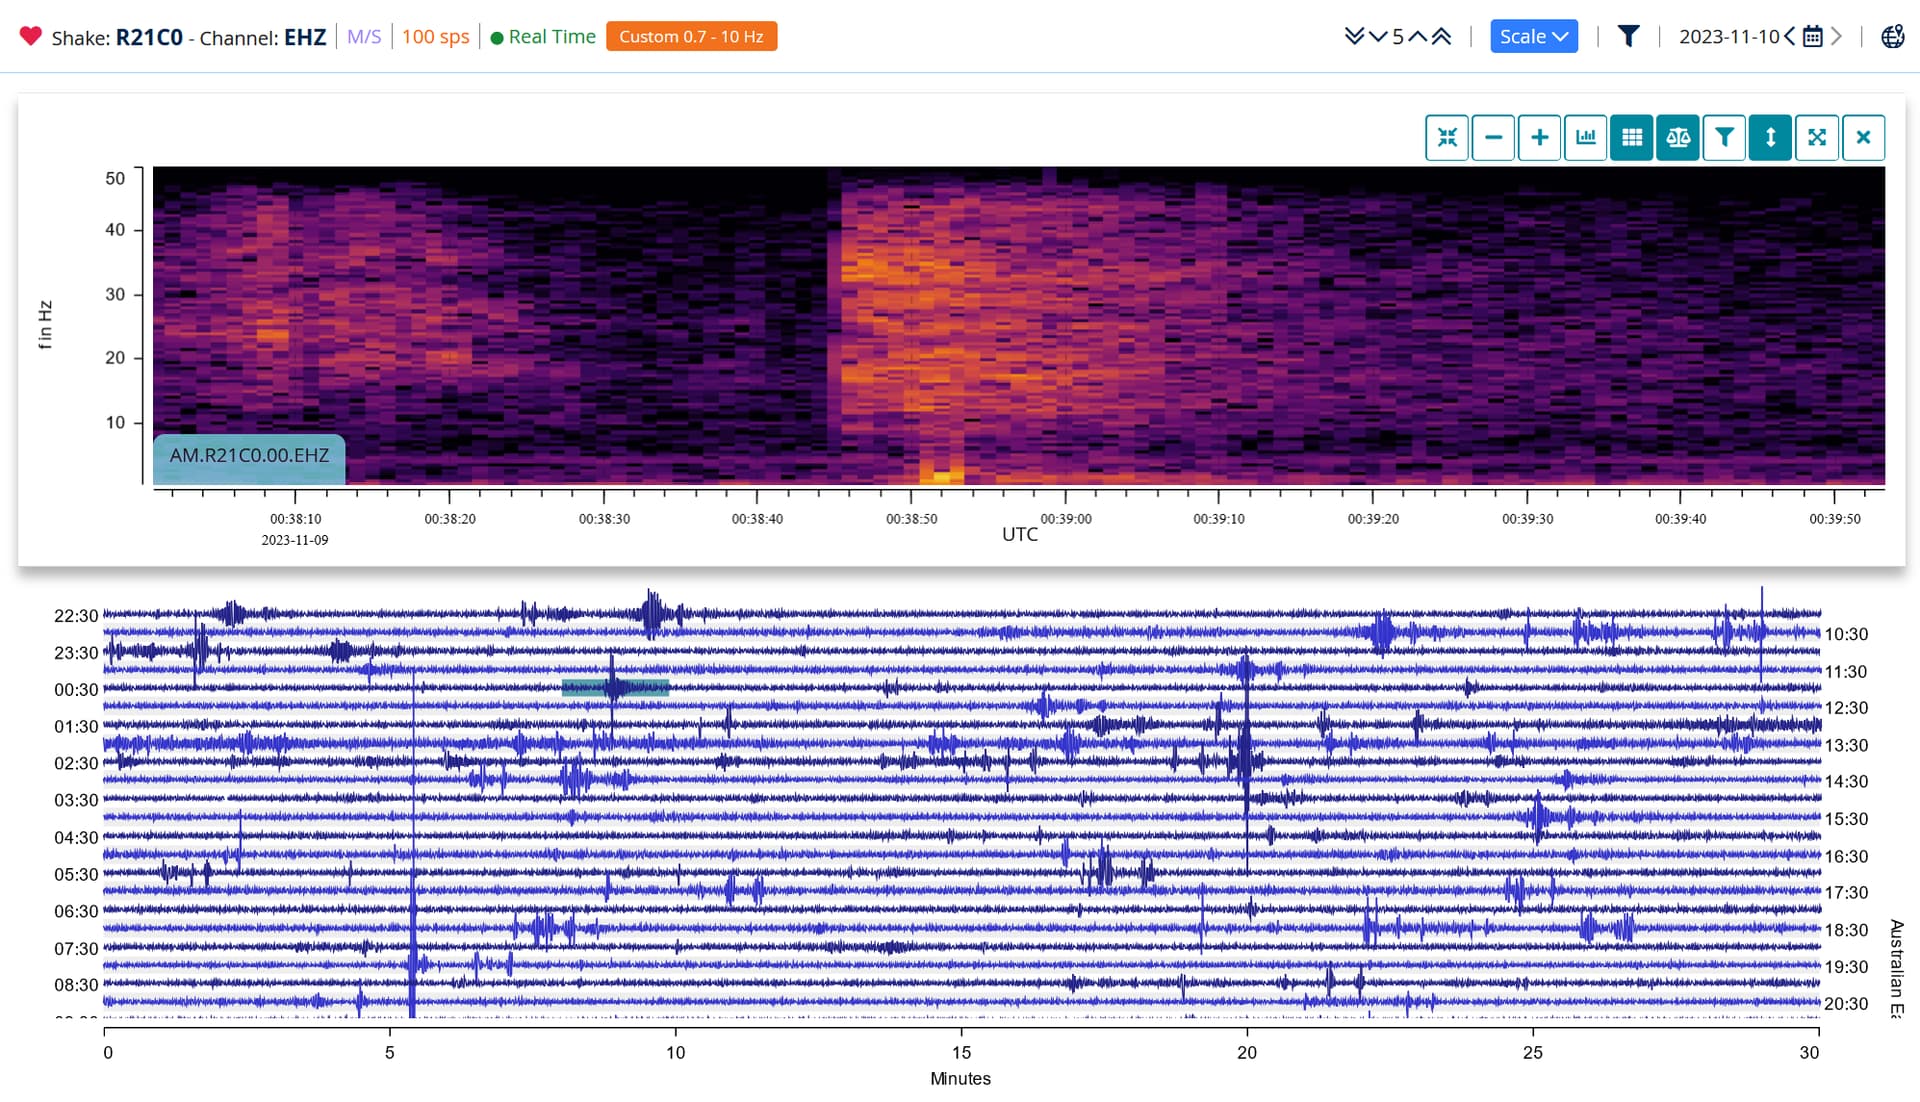
The P wave is weak below 10Hz which is not necessarily a good example. Most commonly the spectrogram would be fairly strong all the way down to the bottom, but the strong signal at about 1Hz corresponding to the S wave arrival confirms the event is an earthquake - albeit a likely mine blast.
Notice also a faint line about 4 or 5Hz across the spectrogram. This is just some sort of local cultural noise - it may be mechanical or electrical.
The glow above 10 Hz at the left hand side of the spectrogram is likely man made noise - probably a passing car or truck.
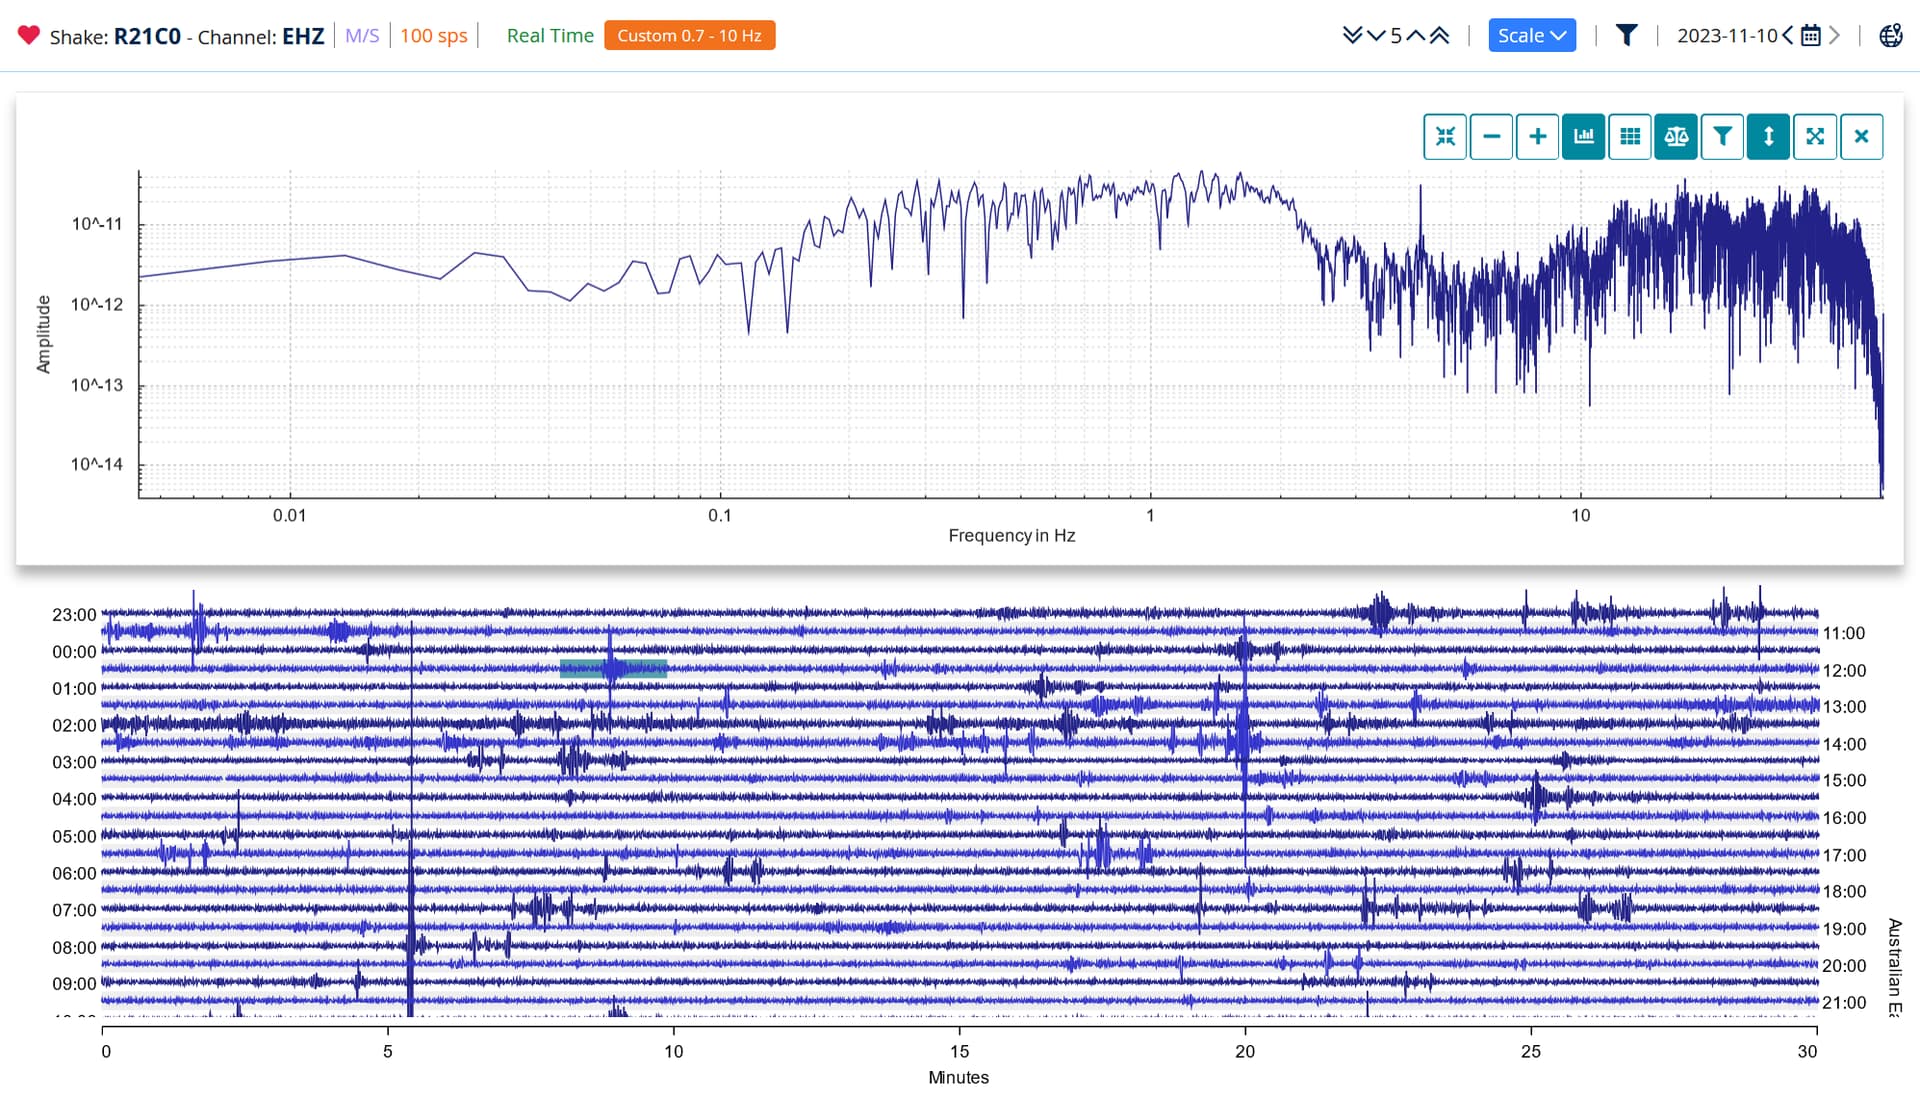
As you can see in the PSD plot, the line of noise is very evident at just over 4Hz. The plot has a saddle in it between about 2Hz and 10Hz which is a result of the width of the window I used including the noise from a passing car or truck at the start, and the short duration of the quake signal. Ordinarily, if the quake signal filled the duration of the window, the PSD would show a flat or steadily decreasing plot from about 1Hz upwards.
Al.
To add a couple more that you might see:
Helicopters are fairly distinctive in the shape of the vibration waveform, and VERY distinctive in the spectrum:
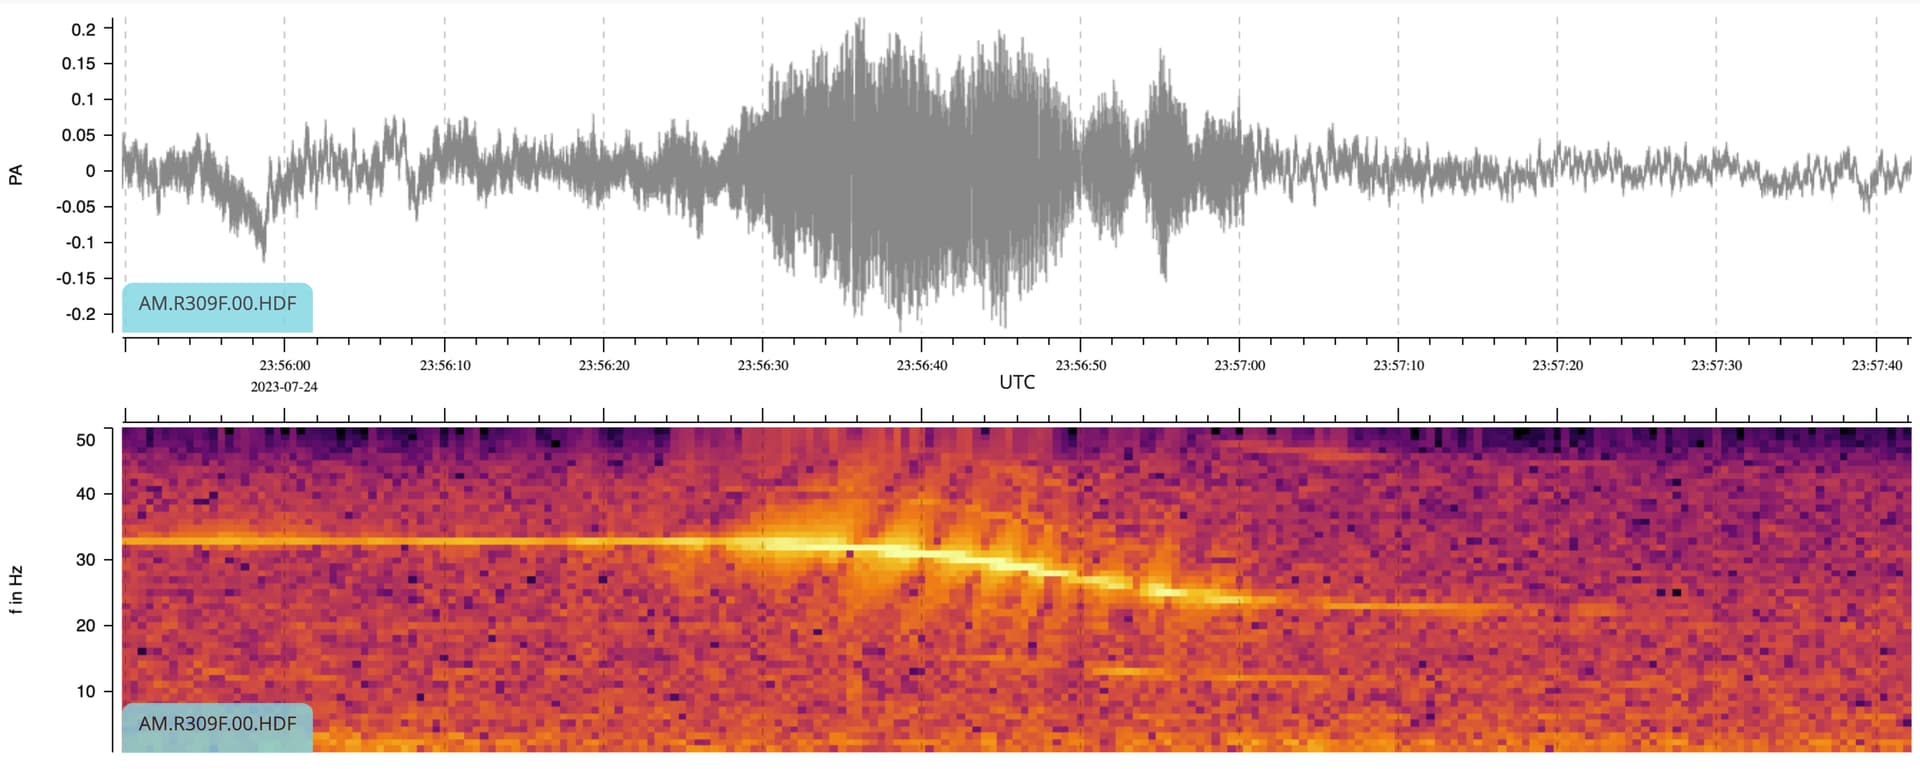
The dopper shift in the frequency of the vibration from the rotors is really distinctive.
Multi-rotor helicopters have several parallel lines in the spectrum.
Earthquakes are fairly easy to spot, looking at the frequency display:
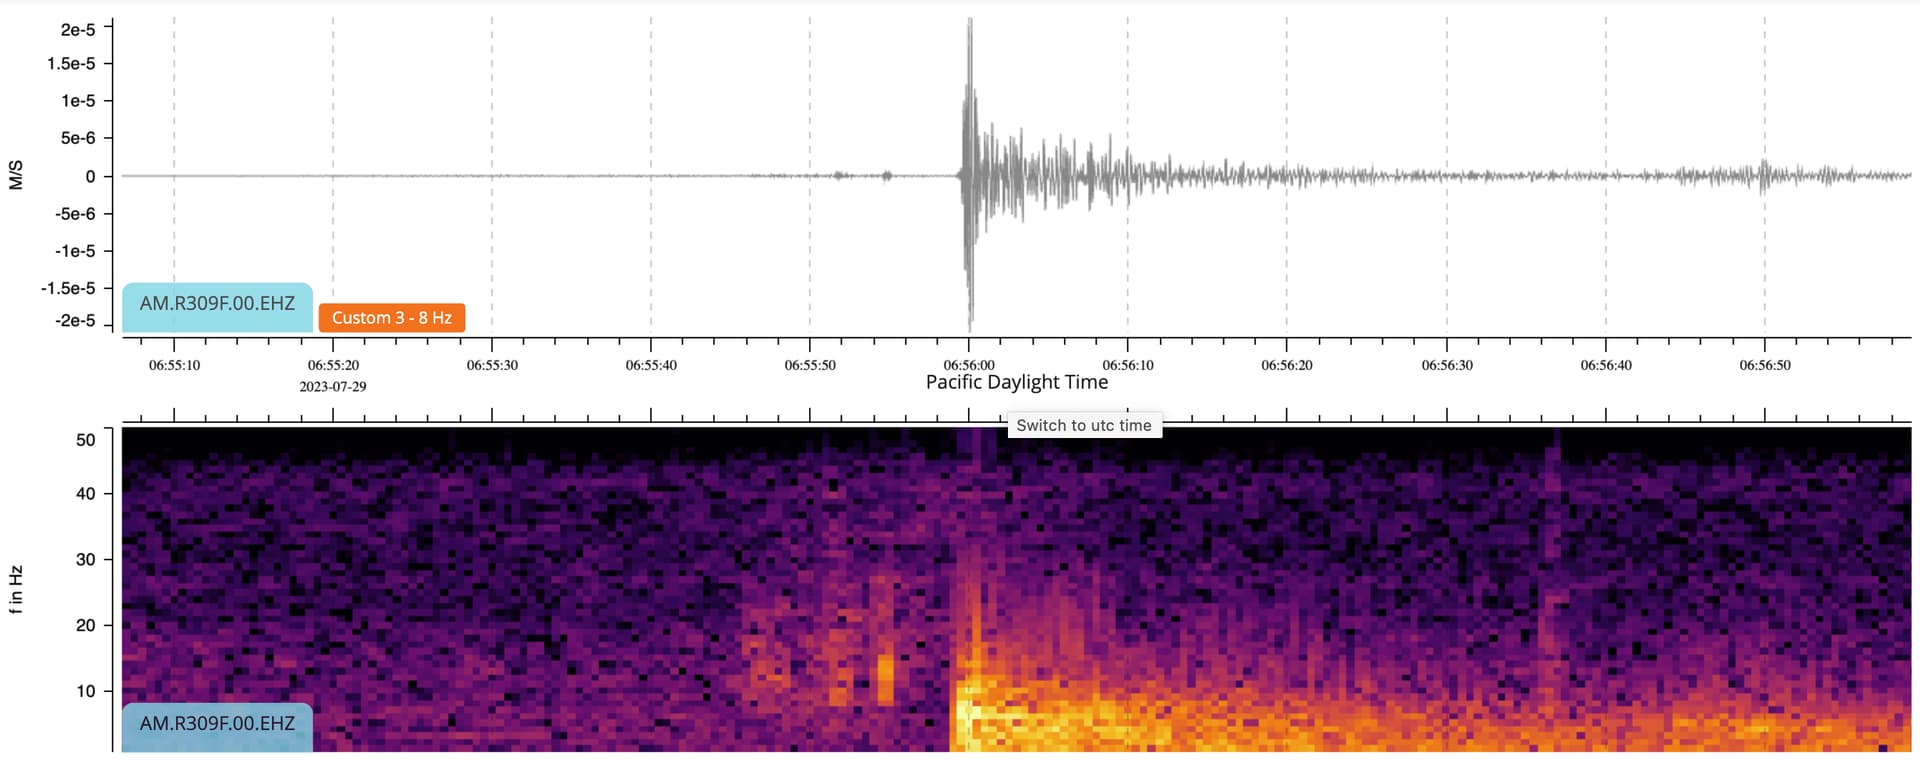
You may see things that produce a somewhat similar shape in the displacement graph, but when you look at the frequency graph, it has two distinctive features: The very sharp edge at the start, and the most energy being at very low frwquencies. Depending on how far away it was, you may see two sharp vertical edges - from the P and S waves.
Great explanations, thank you @fester , @sheeny , and @PhilipPeake !
There is some great information and examples here. These have helped me to clarify one of the mysteries that had confused me: Why are some earthquake signatures prominent across the spectrum and others not? I see that for distant earthquakes, the signature appears only at those low frequencies, where as nearer earthquakes may be more spread out.
Also, I wondered why two different units, seemingly close to each other, can show on one what looks to be a significant event, but completely missing on the other. A nearby event will feature prominently, even if it’s a relatively minor event in the immediate vicinity, such as a passing truck. I see it takes a bit of familiarity and comparison to tease out the stories.
I live in earthquake country and am very interested in the ambient, yet non-quake, earth vibrations that are almost constant, and that occasionally surge throughout the day. I think I will need to spend a few wakeful nights to see if I can catch those signatures in the early morning hours, when manmade interferences are fewer.
This has been a great help, and I also love the examples of the trucks and helicopters. It’s fascinating to see how these different signatures play out. I look forward to learning more.
Check to see if there are any other devices in your area. I find it useful (sometimes) to check surrounding 'shakes to see what they saw. I live on what the USGS classifies as an inactive fault line. In fact, it is quite active, but with very low level earthquakes. When I see one, checking the three stations close to me to verify that they saw something too ensures (at least in my mind) that it wasn’t something local to me. Checking stations further out, they tend to see something very weak, or nothing at all.
Example of a local 'quake:
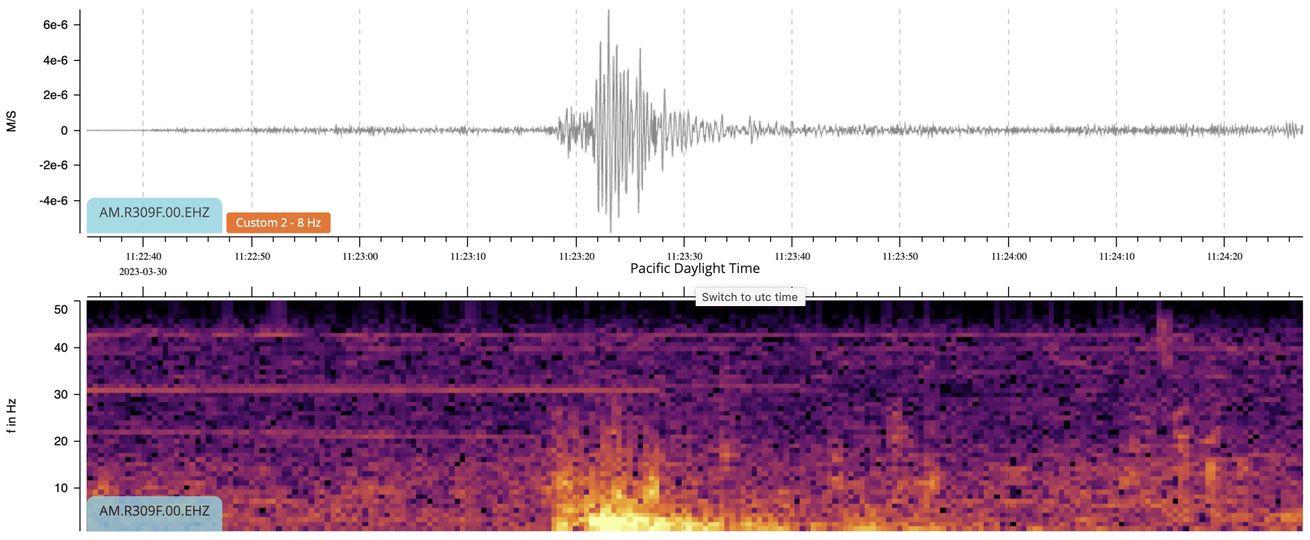
You can see (not particularly well on this example) two sharp edges to the spectrogram signal, the P then the stronger S wave … not very far apart, because it is close.