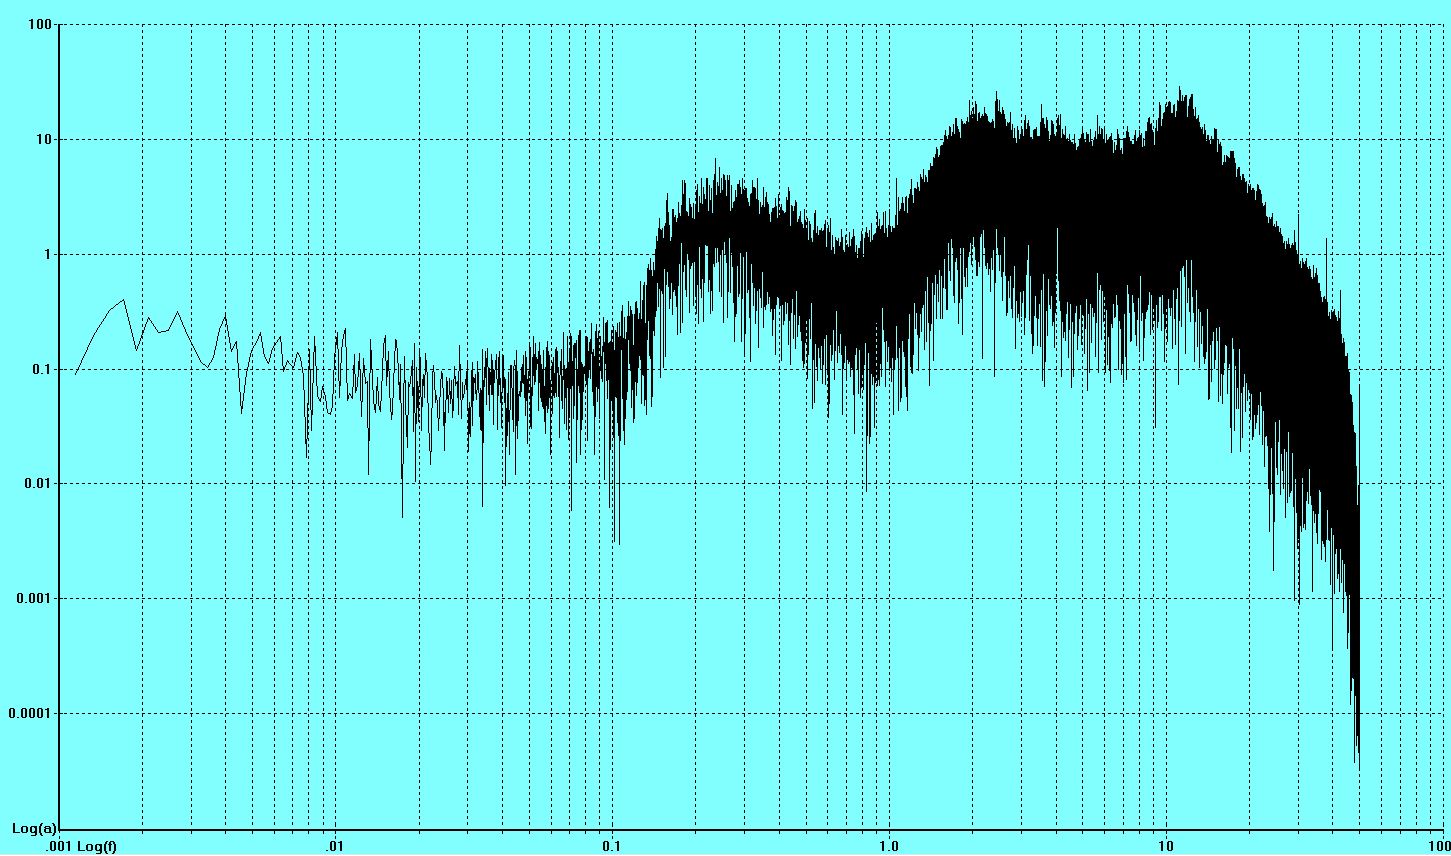
I got the noise spectrum from FTT. The signal is noise (no earthquake is recorded) and it is not filtered…
What could be the first pick at 0.25 Hz?
The signal from 2.0 to 11 Hz is clearly emergent, so it was filtered by an automatic Rarsberry shake algorithm. Is it right?
What should an unfiltered seismic signal spectrum look like?
1 Like
Yes, I noticed this as well and I wrote up what I found here.
Note my spectra are much smoother than yours. This is because I do ensemble averaging - split the record into windows, apply FFT to each window, then take the mean over all windows.
2 Likes
Hello Geobalocchi,
Onto your questions:
-
What could be the first pick at 0.25 Hz?
This is the seismic microseism (you can find more here: seismology - What generates the microseism? - Earth Science Stack Exchange)
-
The signal from 2.0 to 11 Hz is clearly emergent, so it was filtered by an automatic Rarsberry shake algorithm. Is it right?
No, as we provide raw and unfiltered data.
-
What should an unfiltered seismic signal spectrum look like?
The spectrum is a representation of the noise field at that specific point on the planet, and it can change based on local hourly/daily/seasonal cycles. For more information, you can check this paper here:
McNamara_etal_JGR2011.pdf (1.5 MB)
And as usual, if you have any other question(s), just let us know!
2 Likes
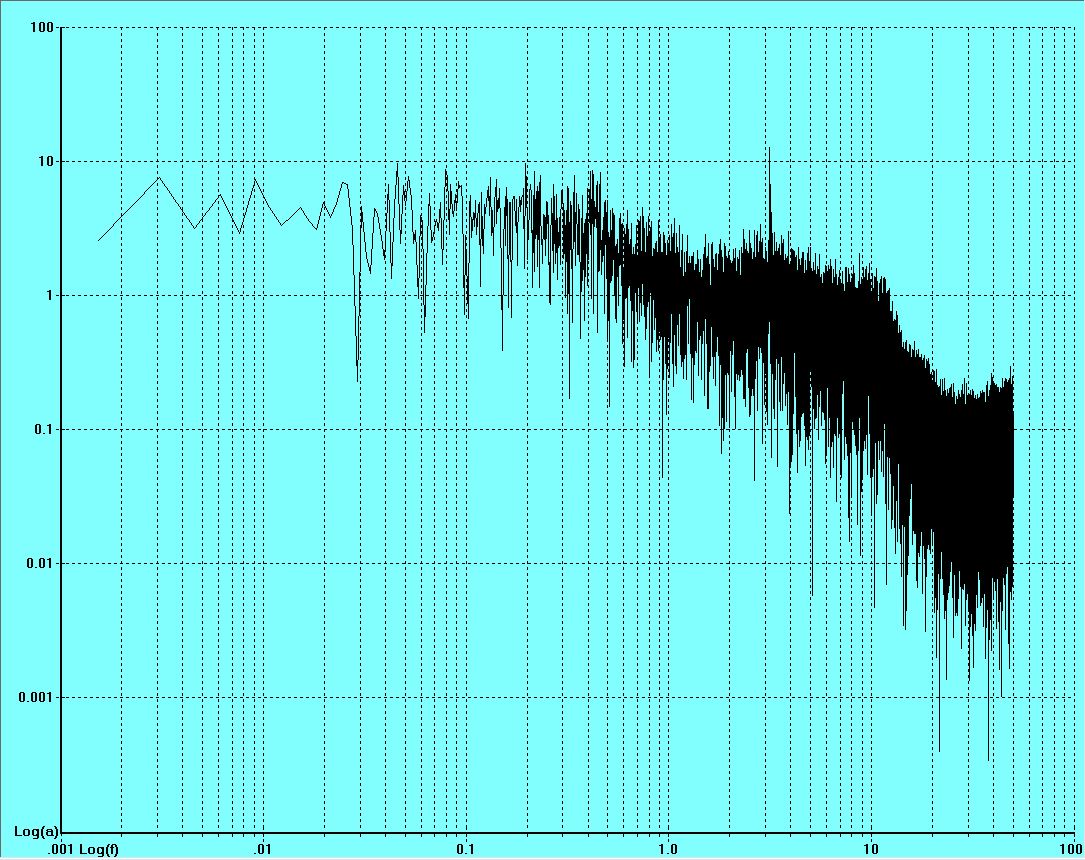
Thanks for documents. They are very intresting.
I see other FTT of noise seismogram, from geophone. It is located in the same place of my Raspberry Shake, but the FTT is very different:
You do not see the “hum” and microsismic zones (see link in previous posts).
Why?
1 Like
You’re welcome Geobalocchi.
Is this second geophone different from the one used in the Raspberry Shake? Do you have its maker/model information, or a picture of it?
Thank you.
Yes it is different from Raspberry Shake.
No, I have not.
1 Like