I’ve already checked the SWARM manual but nothing is mentioned about the power unit or ratio. Only found this:
The y-axis of the spectra plot is the ‘power’ or ‘amplitude’ of the frequency that contributes to the actual signal. Actual value is often less important than the relative value.
So I guess the Spectra chart Power axis is giving just an idea of the amplitude per frequency distribution but is not accurate for a dB perspective.
(As I am focusing on periodic events - wind turbines - with less power than earthquakes, the Spectra is useful!)
For RB the SWARM programs does not do anything about the instrument response at all. If you say “use calibrations” it will display pascals, but actually give you counts.
The python programs will take into account the calibration and instrument response but give you amplitude as a function of time over the whole passband. So you cannot say what the magnitudes of the various frequencies are. There may be a python function for filtering. It seems like a pretty powerful package, but quite a bit of work to get set up.
In some ways RB is simpler than RS. RS gives you velocity but what people are often interested in is acceleration or displacement. RB gives you (sound) pressure.directly and that is what is usually of interest.
There is a direct relationship between sound power (intensity) and sound pressure level. It is usually expressed in dB relative to 10^-12 watts/m^2.
Sound Intensity = (Sound Pressure)2 / 400
There is no explanation of what SWARM does about power. Hopefully they are squaring the readings and dividing by something …
I am going forward with Python… @Stormchaser:
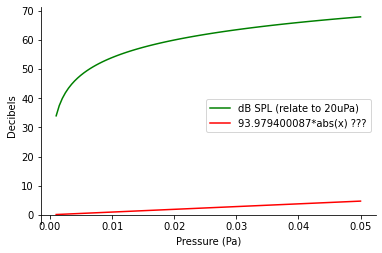
On my steps, I found that on the samples for developpers to convert counts to Pascals to Decibels (Developer’s corner) the calculation from pascal to decibal looks weird:
93.979400087*abs(st[0].data/56000)
As I understand it should be:
import numpy as np
20*np.log10(abs(st[0].data/56000)/0.00002)
thank you for pointing that out, it is indeed as you say. The example in the developer’s guide offered a linear approximation, to better highlight the impact that the pressure variation caused by the thunder made on the RBOOM sensor.
I will add a section with the formula you indicated, which represents the precise logarithmic approach to the Pascals to Decibels conversion.