I am working on correcting Shake and Boom data for instrument response, following the recently published Seismological Research Letters paper:
“Instrument Response Removal and the 2020 MLg 3.1 Marlboro, New Jersey, Earthquake”, by Alexander Burky, Jessica Irving, and Frederik Simons
The method requires downloading a “SAC_PZ” file for the specific instrument, containing information to correct for the instrument response using poles and zeros.
There must be some straightforward way to find those files because I already did it for one RS instrument (see below), and with it I got the method to work in Matlab but I can’t remember how I got that file
Does anybody here know how to get those SAC_PZ files for Shakes and Booms?
Let’s see, I have not found a previous topic in our community regarding this, but I have found something that matches the output you have on file on the IRIS website, here: TRANSFER more or less halfway down the page.
Good news is that I remembered how I did it
In ObsPy, I could get the SAC_PZ file with this:
%matplotlib inline
from obspy import read_inventory, UTCDateTime
from datetime import timedelta
sta = 'RCABD'
now = UTCDateTime.now() - timedelta(days=1)
inv = read_inventory('https://fdsnws.raspberryshakedata.com/fdsnws/station/1/query?network=AM&station=%s&level=resp&format=xml&nodata=404&starttime=%s' % (sta, str(now)))
inv.write("./RCABD_pz.txt", "SACPZ")
Next challenge is: That worked for RACBD, which is an RS-1D, but when I tried it for RAF39, which is a Shake&Boom, it seems that it got confused RE which channel (EHZ or HDF), and:
Gave me this error message:
//anaconda2/lib/python2.7/site-packages/obspy/io/sac/sacpz.py:78: UserWarning: AM.RAF39.00.HDF 2018-09-28T04:50:31.001000Z has unrecognized input units in response: PA. Skipping
warnings.warn(msg)
Produced a SAC_PZ file which looked to me like it might have been for HDF, when I thought I was asking for EHZ.
I was also thinking the issue might be that ObsPy doesn’t recognize the HDF data. That was part of my reason for working with the Matlab version of the code described in the SRL paper by Burky, et al., mentioned above. I am very new to ObsPy, but have been using Matlab for a long time, so:
It’s easier for me to follow what’s happening in Matlab, and
The paper includes a lot of good documentation and background RE what’s happening in their Matlab programs.
Anyway: When you say “download the response file manually”, do you mean downloading from SAC or from ObsPy? If from SAC, I was hoping to not have to get involved with installing SAC on my Mac. (I find that installing large, complex non-Apple programs on Macs usually gets complicated.) But, if that’s necessary, do you perhaps have access to good, clear instructions for installing SAC on a Mac?
To clarify what I am trying to do here: I have an RS1D (RCABD, EHZ), Shake&Boom (RAF39, EHZ and HDF), and a Trillium broadband, all on the Weston Observatory seismic pier, and I want to verify that they are all recording the data consistently. Also, I want to verify that the HDF recordings are well-calibrated.
So, do you perhaps have SAC running? If yes, would you be able to download the SAC_PZ files for RCABD (EHZ), RAF39 (EHZ and HDF), and WES (HHZ), and send them to me, so I can verify that the SAC_PZ files I’m trying to get are correct?
Yes, Obspy does not understand non-seismic data, like the sets recorded by the HDF channel in Pascals. If you want to analyze HDF calibration, then Obspy is not the solution that you are looking for, I’m afraid, and you will have to revert to your Matlab approach.
Once the .xml file is on your computer then you could modify accordingly to what you need for it to be understood by Obspy or by your Matlab code, and then proceed from there by feeding the edited response file from a local source instead of an online one.
I don’t have SAC installed on my pc (I tried installing the repository that I suggested a couple of posts above, but something even in a basic Python environment seems to not work well with it, so I’m still working on it) but I downloaded all the response files from RCABD and RAF39 and I have attached them here: RAF39_resp.xml (9.7 KB) RCABD_resp.xml (10.8 KB)
Unfortunately, I am unable to download the WES response file since it is not connected to StationView. You will have to acquire its response files in another way (unless you already have them available).
Thanks! This is VERY helpful, and it has what I’m looking for.
Having that URL example is most of what I was looking for. And, no problem with me experimenting with modifying it to be understood by ObsPy and/or Matlab. That’s what I’m working on. And, no problem with me getting response information for WES (there are other ways I can get the necessary files for that/only asked in case you had SAC runnning & easily avaialable).
My primary interest here is RE calibartion of RCABD (EHZ) & RAF39 (EHZ and HDF). Here’s some more about what I’m working on with this.
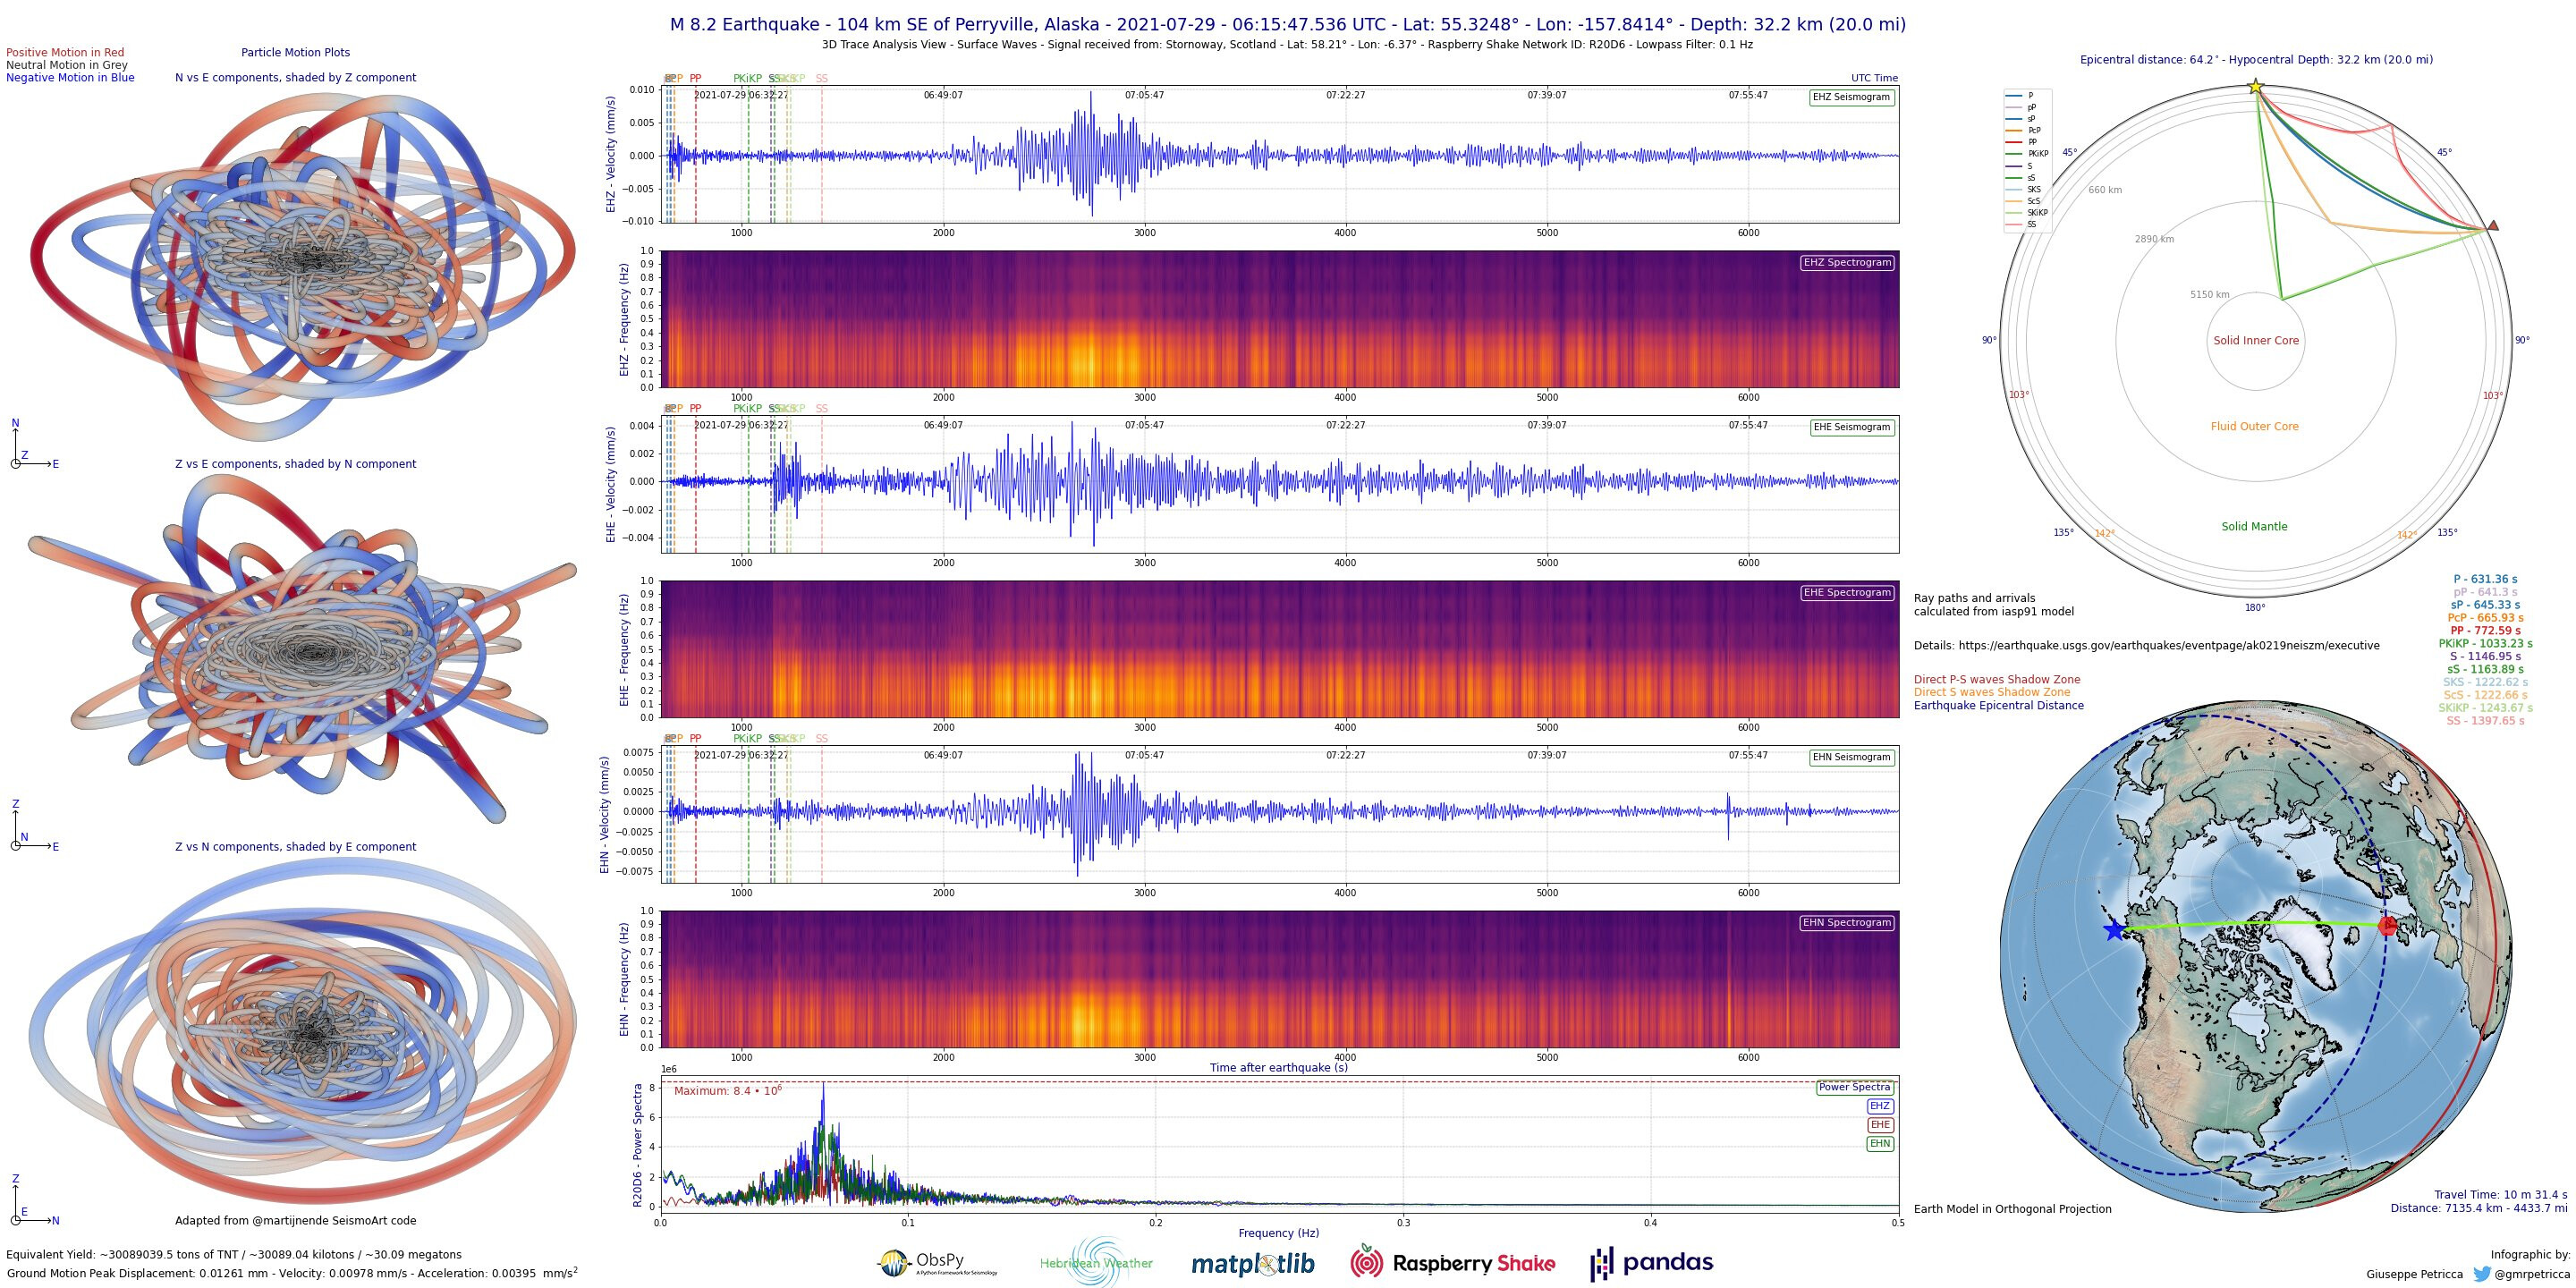
We have some very interesting long-period surface waves from the recent M8.2 Alaska quake, recorded on RAF39 - both EHZ and HDF (see below). And, we see the same kind of surface wave seismic/infrasound at other RS&Boom sites, and at other seismic/infrasound colocated sites. We are studying those seismic/infrasound interactions, and I want to make sure we have correctly calibrated data.
M8.2 Alaska quake:
Surface waves on both seismic and infrasound.
We also have some interesting observations of thunder recorded at Shake&Boom sites, and we are studyng that too and want to make sure we have correctly calibrated data.
Thunder on Shake&Boom (RF082):
Thanks for helping me with this, and for all the other help I am getting from raspberryshake.org, and for all of the great experiences I am having being part of this great Raspberry Shake adventure!
Always happy to help, both here and on socials, where I continue to thank you for your so extensive analysis work that you always do.
I also recorded the surface waves from the M8.1 Alaska major earthquake all the way here in Scotland, here’s what my RS3D has recorded on all its channels:
Unfortunately, I got my RSBOOM only after the lone thunderstorms that we had last year for the first time in more than 20 years, so I only got the vibrations produced by close thunder recorded with my old RS1D.
In any case, both projects are extremely interesting and I (we) look forward to their results.
If you need anything else, you know where to find me. And I agree, being part of what RaspberryShake is doing is definitely an inspiring adventure!
 for one RS instrument (see below), and with it I got the method to work in Matlab
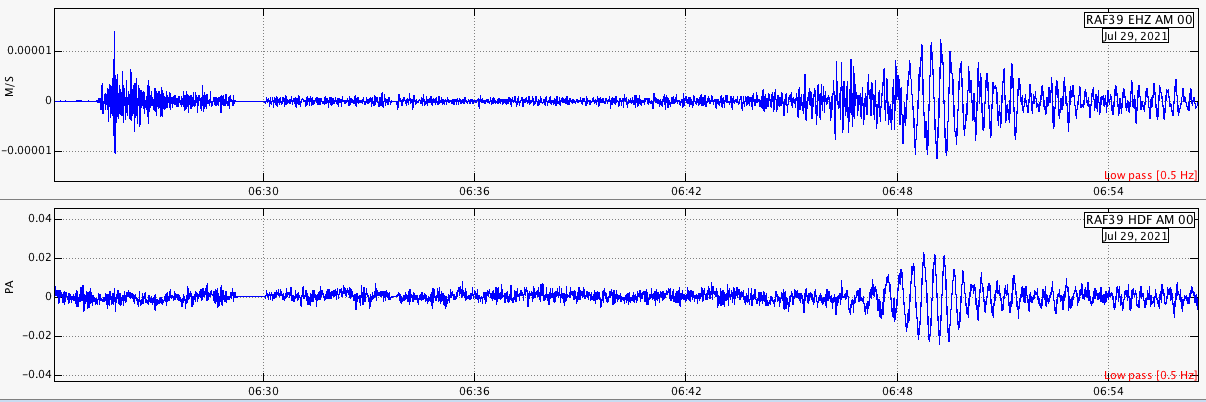