Pardon me if this is a stupid question - but if I am confused, maybe so are others - and would benefit from this discussion.
There was a big earthquake in Oaxaca yesterday at 15:29 UTC. I am almost 3000km distant and was interested to see what my RS4D registered. And sure, enough, there it was. As per theory, about 6 min later the P Wave was apparent here. The theory also indicates that the S-Wave ought to show up 4-5 minutes after that. Yet, as you can see, it seems to arrive a full 8 minutes later.
Can anybody explain this? It seem very weird to me.
My guess is that what you’re interpreting as S-waves are actually the much slower surface waves. Earth material wave velocity theories are often wrong, but for teleseismic events like this, the errors tend to be within the range of a few seconds. Minutes of difference suggests to me that it’s an entirely different type of wave.
I was leaning that way also. But I am an engineer, not a geologist, so I don’t know much. And even if it was something different, where the heck is the S-Wave? Shouldn’t it be there, and much bigger than the P-Wave? The first time I got a sizeable squiggle was for an earthquake about 400km from here, and I saw the P and S and they came at the exact right times etc. So I thought I had this figured out, and now this. 'Tis a puzzlement.
1 Like
Just popping in here with a question: Do you have any programming skills?
branden
Yes, but I am retired and lazy. (smirk)
3 Likes
Well, if you want to un-lazify yourself (lol), this might be a resource you would be interested in to learn more about the wave arrivals: https://twitter.com/wmvanstone/status/1275559567892582401 (see the links to @wmvanstone github account in the comments)
branden
2 Likes
Thank you so much. This was VERY helpful. Looks like my S-Wave got shadowed or depressed and what I am seeing is maybe the ScP-Wave. As I detect more earthquakes, I will reference this info and (slowly?) become smarter.
3 Likes
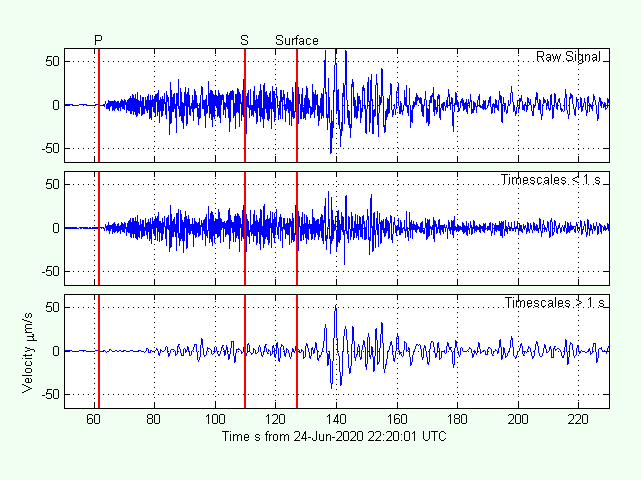
If you have access to Twitter, there are two tweets about the same earthquake that are interesting to look at 1) https://twitter.com/seismorost/status/1275677976315801602 shows the S-wave arrival in Leeds Uni with S-waves only visible on the horizontal geophones of a 3D shake, with nothing significant on the vertical. 2) https://twitter.com/seismo_steve/status/1275755768705318913 showing the surface waves arriving in SE England, with no appreciable S-waves on a vertical geophone (SHZ). It’s also worth noting the frequency ranges used for filtering, in the second plot the range is from 0.03Hz to 1.0Hz to pick out the surface waves. In the plot with P and S-waves, the frequency range was 0.7-2.0Hz. Hopefully this is useful information. The seismologists on Twitter are worth following. Best wishes, Mark
2 Likes
Yes, thank you. I hope you saw my helicorder graphs above. I believe I am 27deg from Oaxaca, almost due north. I was trying to line up my distinctive pattern with the ones you captured in the 25-30deg range. None match exactly but I am beginning to understand more. I know a lot of engineering and a little geology. I got my Raspberry Shake about a month ago so I am pretty new at this. I live in a geologically active region - just outside Zion National Park in Utah. In addition to the occasional earthquake, we have huge rockfalls and landslides from time to time. Hoping to catch some of that action also.
3 Likes
Here’s the record of a mag 5.9 event that just occurred off Milford Sound (South Island, New Zealand), 444 km from my RS1D, RC144. There are no apparent S waves, but the longer-period surface waves (Rayleigh and/or Love waves) are quite evident. The times were calculated using [NSF SAGE: IRISWS: Traveltime: Docs: v. 1].
3 Likes