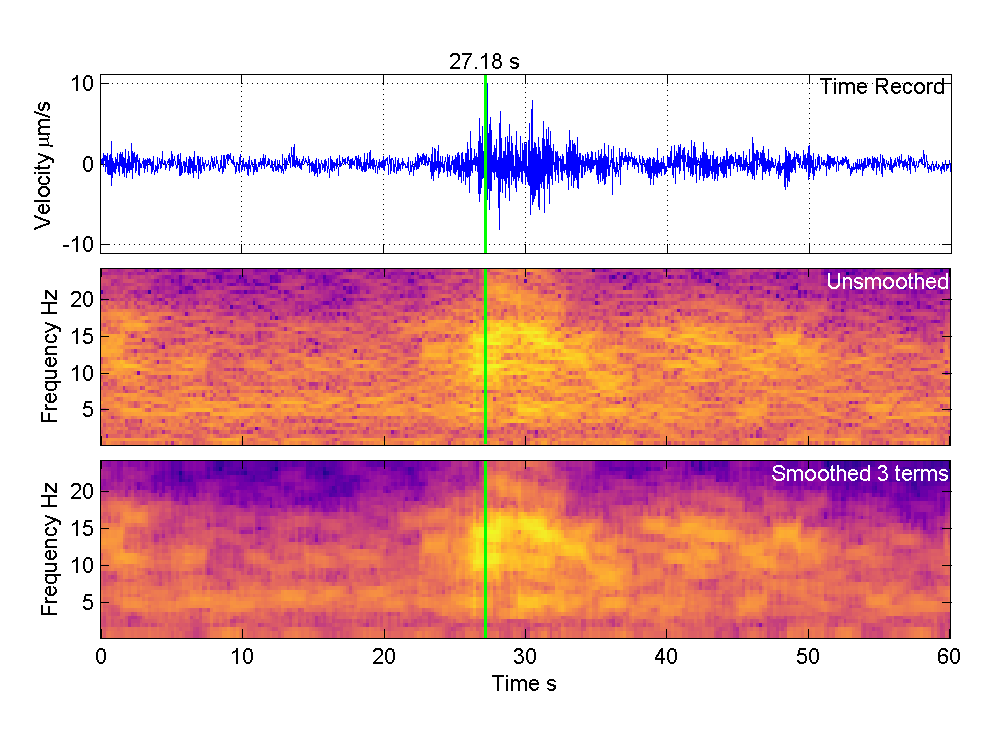
Notice the blues dots throughout the spectrogram. These indicate a very noisy spectrum and are meaningless. They could be eliminated by smoothing, either using ensemble averaging or by frequency averaging.
Swarm uses 86% overlap to achieve ensemble averaging. What is the setting for rsudp?
Frequency averaging is achieved by taking 3 (or 5 or 7) term running means down each column of data.
I played around quite a bit with the specgram() function in order to try and eliminate them but perhaps I tried the wrong things. I welcome improvements!
I’m revising this issue because I’ve been having fun with the new version of Rsudp on Windows, but I find the presence of those negative spikes quite irritating. So I thought I’d explain what’s happening.
Here’s a piece of record with its raw spectrogram and below that a smoothed version - this has been done in Matlab, not Python, so it looks a bit different to Rsudp plots.
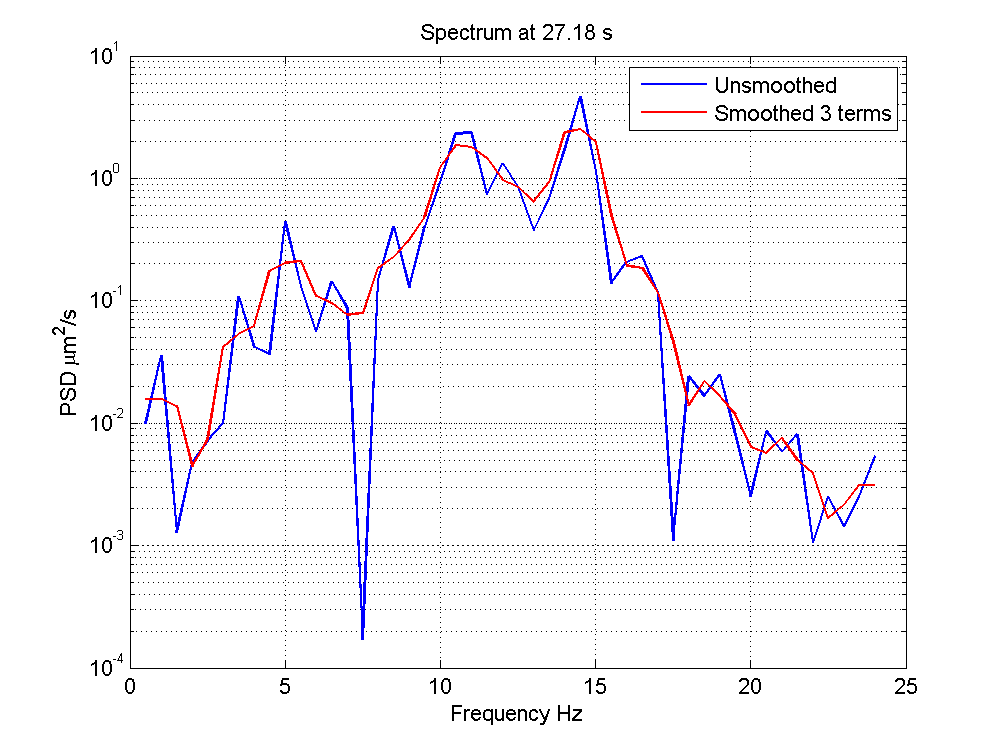
The difference between unsmoothed and smoothed is that smoothing has removed the negative spikes which are of no interest to anybody, while retaining the overall shape of the spectrum.
In the specgram() routine used by Rsudp, there is no facility for smoothing, so this would need to be done on the spectrogram matrix that comes out of the routine. In Matlab, this is a one-line operation involving the convolution of the spectrogram matrix with a vector [0.333 0.333 0.333] (for 3-term smoothing). I imagine there is a similar process in Python? A Google search on “moving average” or “rolling mean” revealed quite a few options in NumPy and SciPy.
I note that there is a facility in specgram to output an image. Is that what Rsudp uses? If so, things are not quite so straightforward…