Hello!
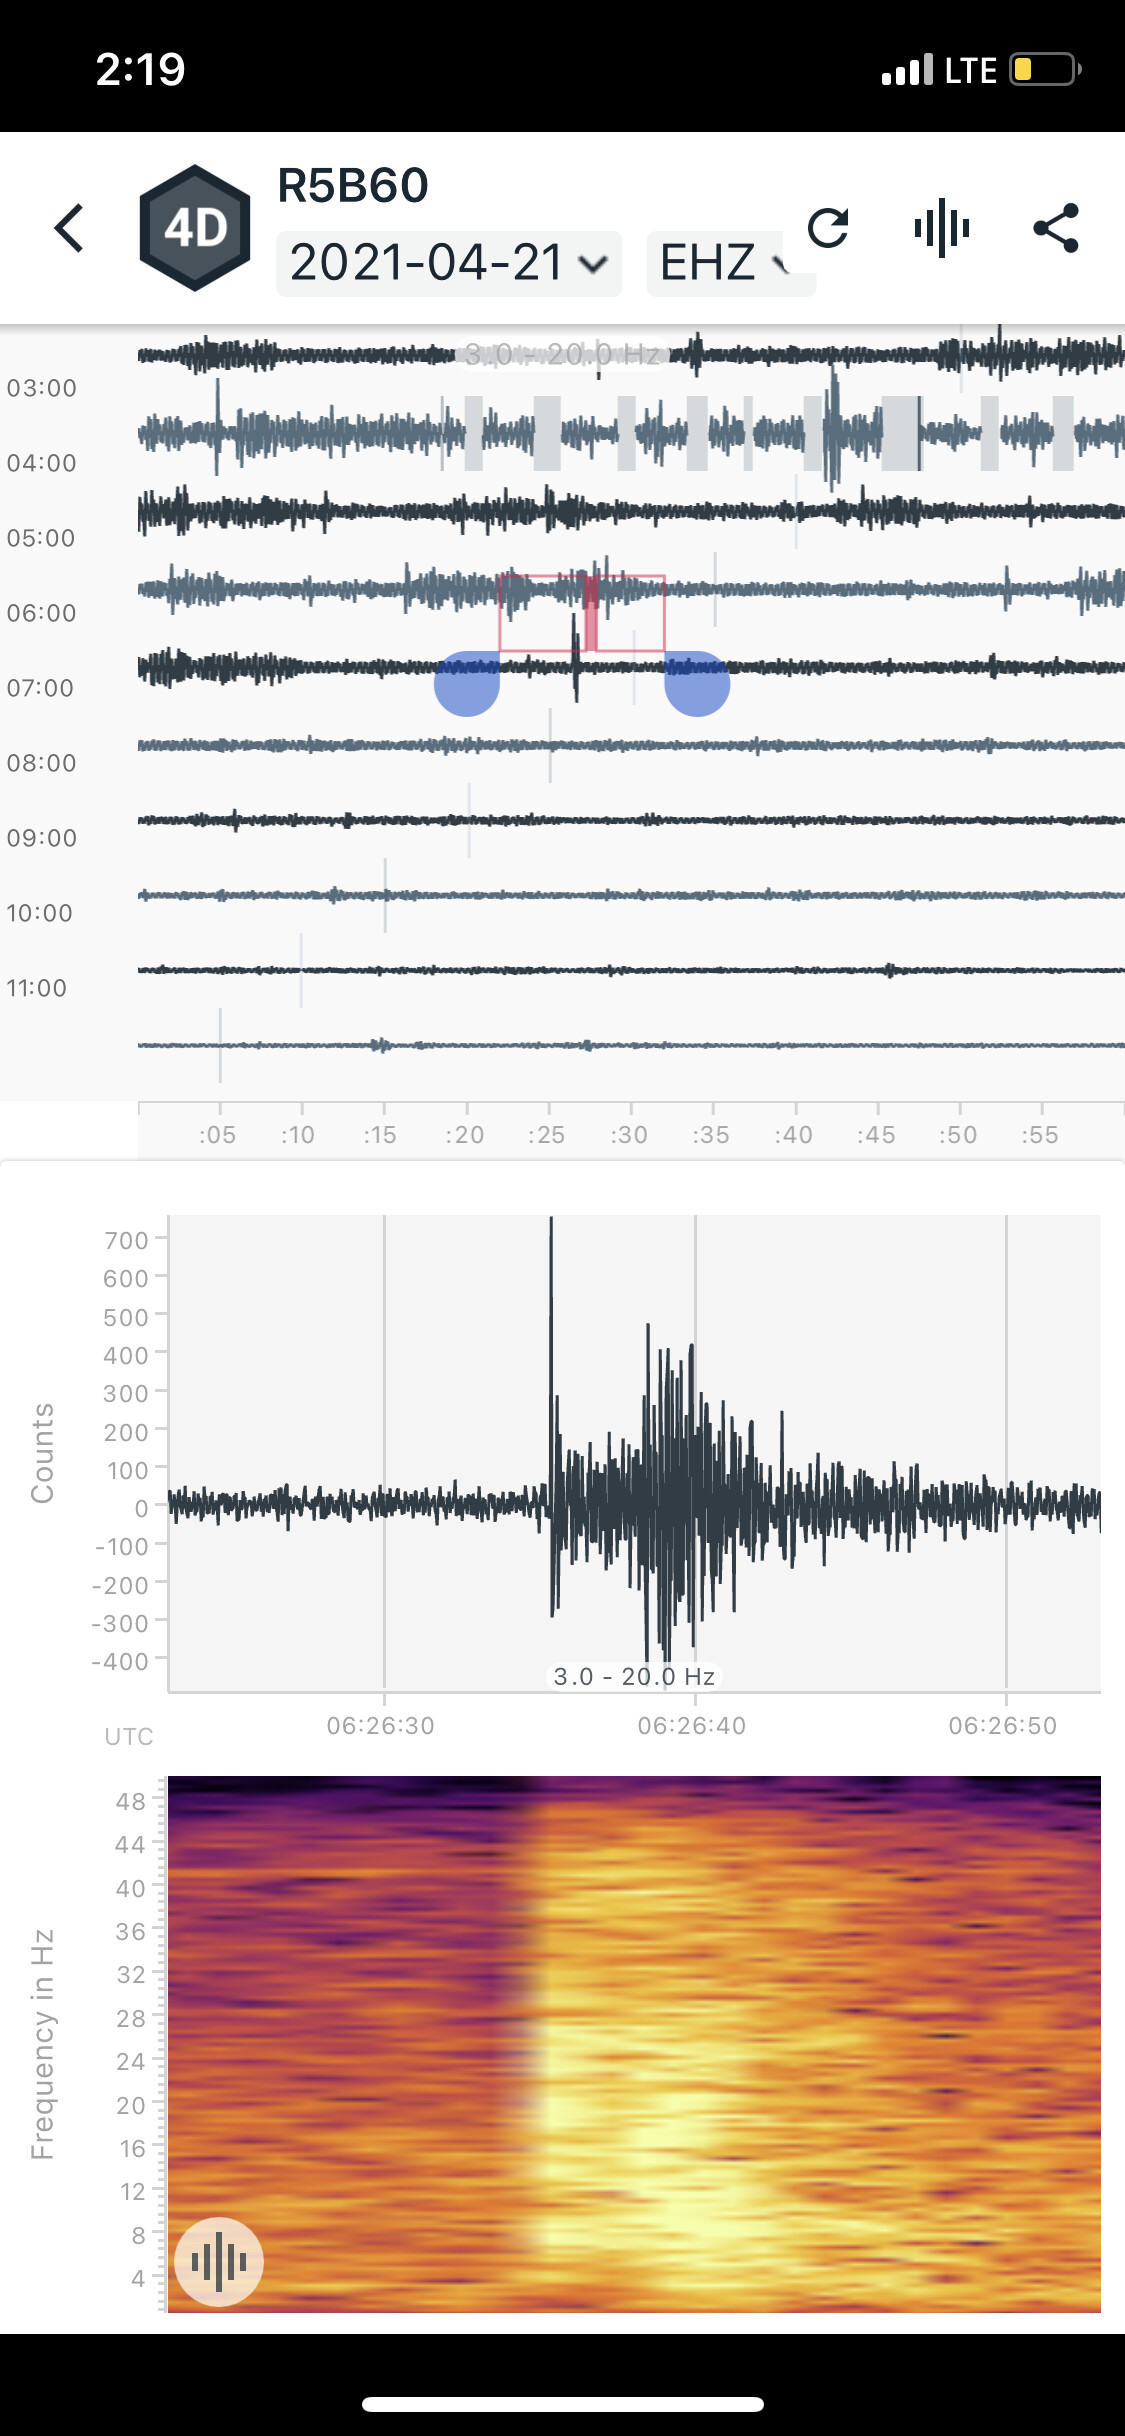
I have an RS4D and I am interested in local tremors close to my station. Due to their small magnitude, they are not picked up and reported by the global and local agencies here so I have no way of knowing the exact event other than what I pick up. A couple times a month I pick up what I believe to be nearby tremors in the hyperlocal filter (attached below)? By looking at the P and S wave arrival I am able to get a rough distance, however, I wanted to know more about the count. What are they and what does a higher count number mean? Some tremors can have a count of less than 100 with some going as high as 700 - what do these mean and does the count correlate with the magnitude? I am just trying to understand how the count and frequency are able to give me some sort of info on the quake itself because they seem to be quite close but never felt.
VS1, I feel your pain seeking non-manmade events! My RS3D is installed in the basement of a suburban home in a aseismic area, and patterns similar to these in my case reflect vehicles of all sizes passing the house. Our road has a slight dip which rattle the trucks with trailers as they pass, and the garbage trucks automatically picking up our garbage cans and banging them to dislodge garbage only to drop them back to the curb offer an frequently repeatable event.
Interesting stuff you’re picking up!
I do live in a seismically active area and I am quite sure what I am getting are small tremors as they seem to be picked up on another seismograph available on the “station monitor” page on the IRIS earthquake website too. It is quite frustrating to pick these tremors up but not know anything about them because our local agency never reports small tremors! Hence, trying to figure out if the counts/frequency can give me any insight into the tremors…
Full disclosure: I am a geologist, not a seismologist but I am picking up seismology as a COVID hobby, lol
Counts: This is a unit-less measure and a represents raw data
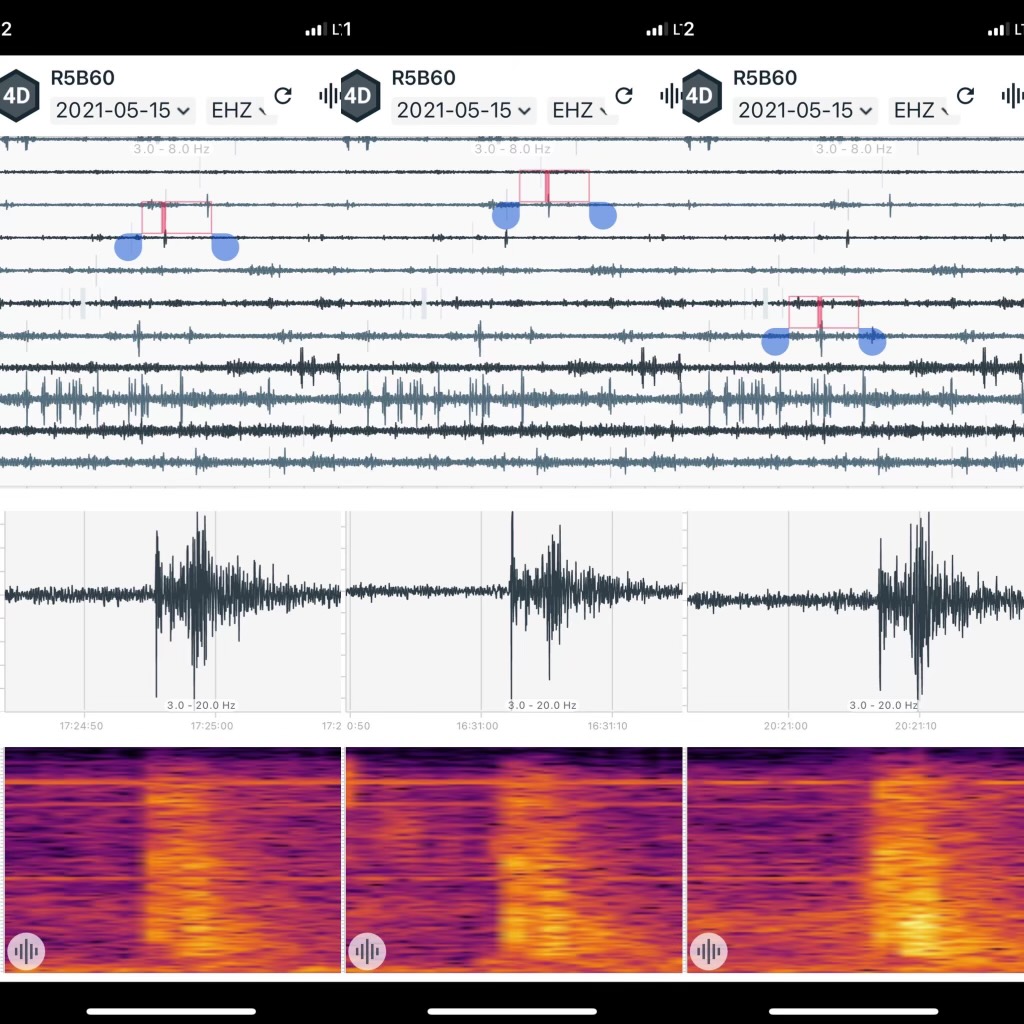
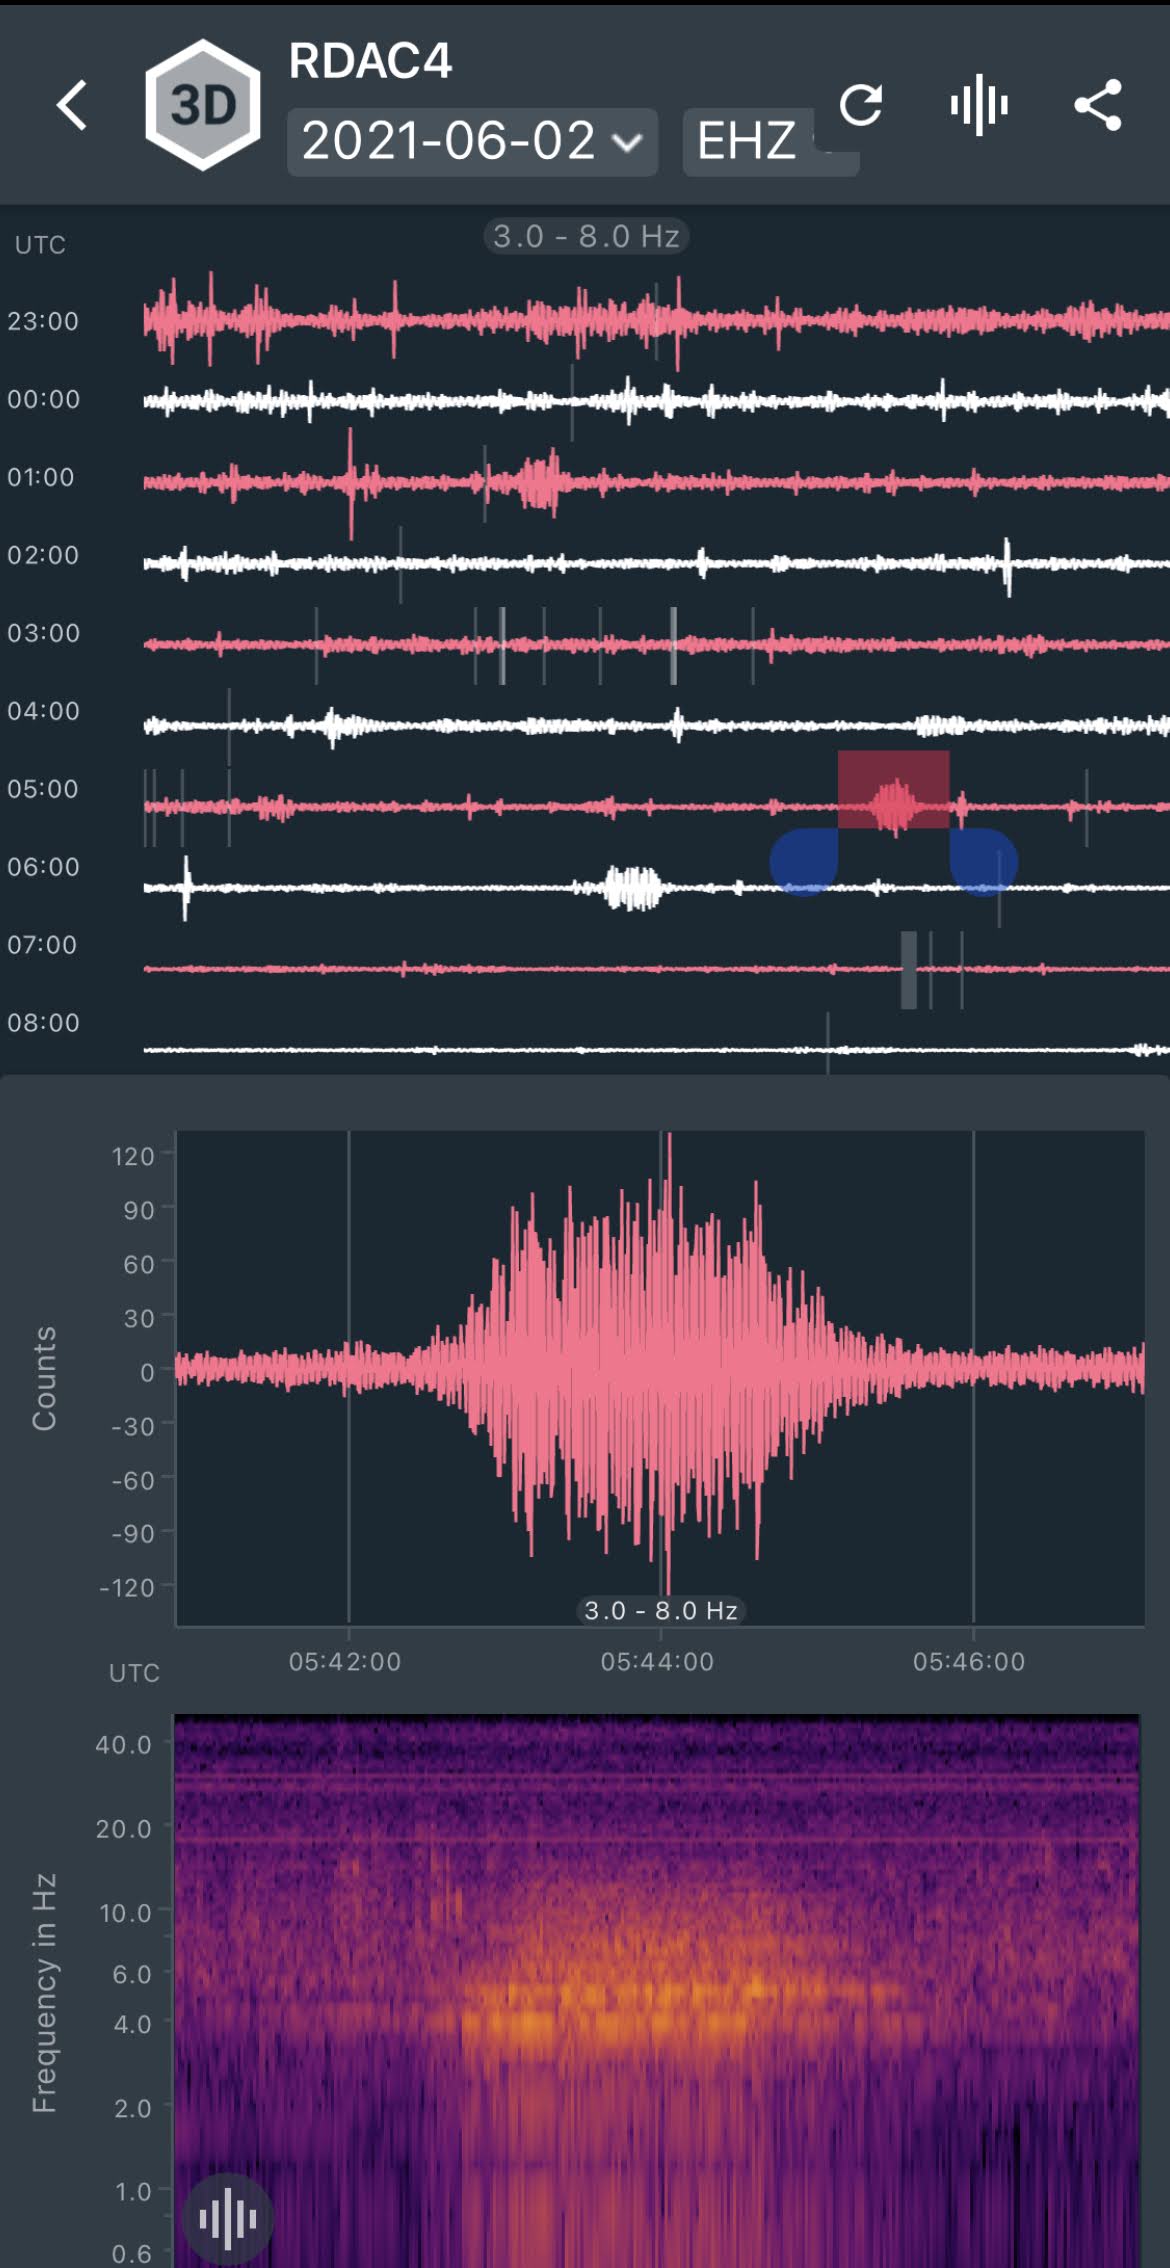
I would say, just from the appearance, they are definitely small temblors. When I look at my seismograph, the key indicator, IMO, is the distinct tail (ie. exponential decay). This combined with the sudden onset shows that it is in high likelihood, a temblor. Anything M2.0 or less generally can’t be felt by humans and only show up on a seismograph. The associated frequency spike is also supporting evidence. As a contrast, take a look at this from my station. This is clearly not an earthquake, it is actually a train (I live about 400m away from train tracks). You can see how the signal slowly appears, then disappears as the train comes and goes. The frequency response is very localized as well.
You are fortunate (scientifically speaking that is!) to live in a seismically active area, where I live, I can pick up global events >M6.0 and blasts from the local rock quarry.
Yes seismology is quite interesting and I have been looking into it more during this Covid time!
Ok so counts doesn’t really have anything to do with the size, distance etc of the quake?
I agree with what you say - definitely does look like tremors. Interesting to see the train on your shake! While you may not have local quakes we don’t have any trains here so I don’t see that haha.
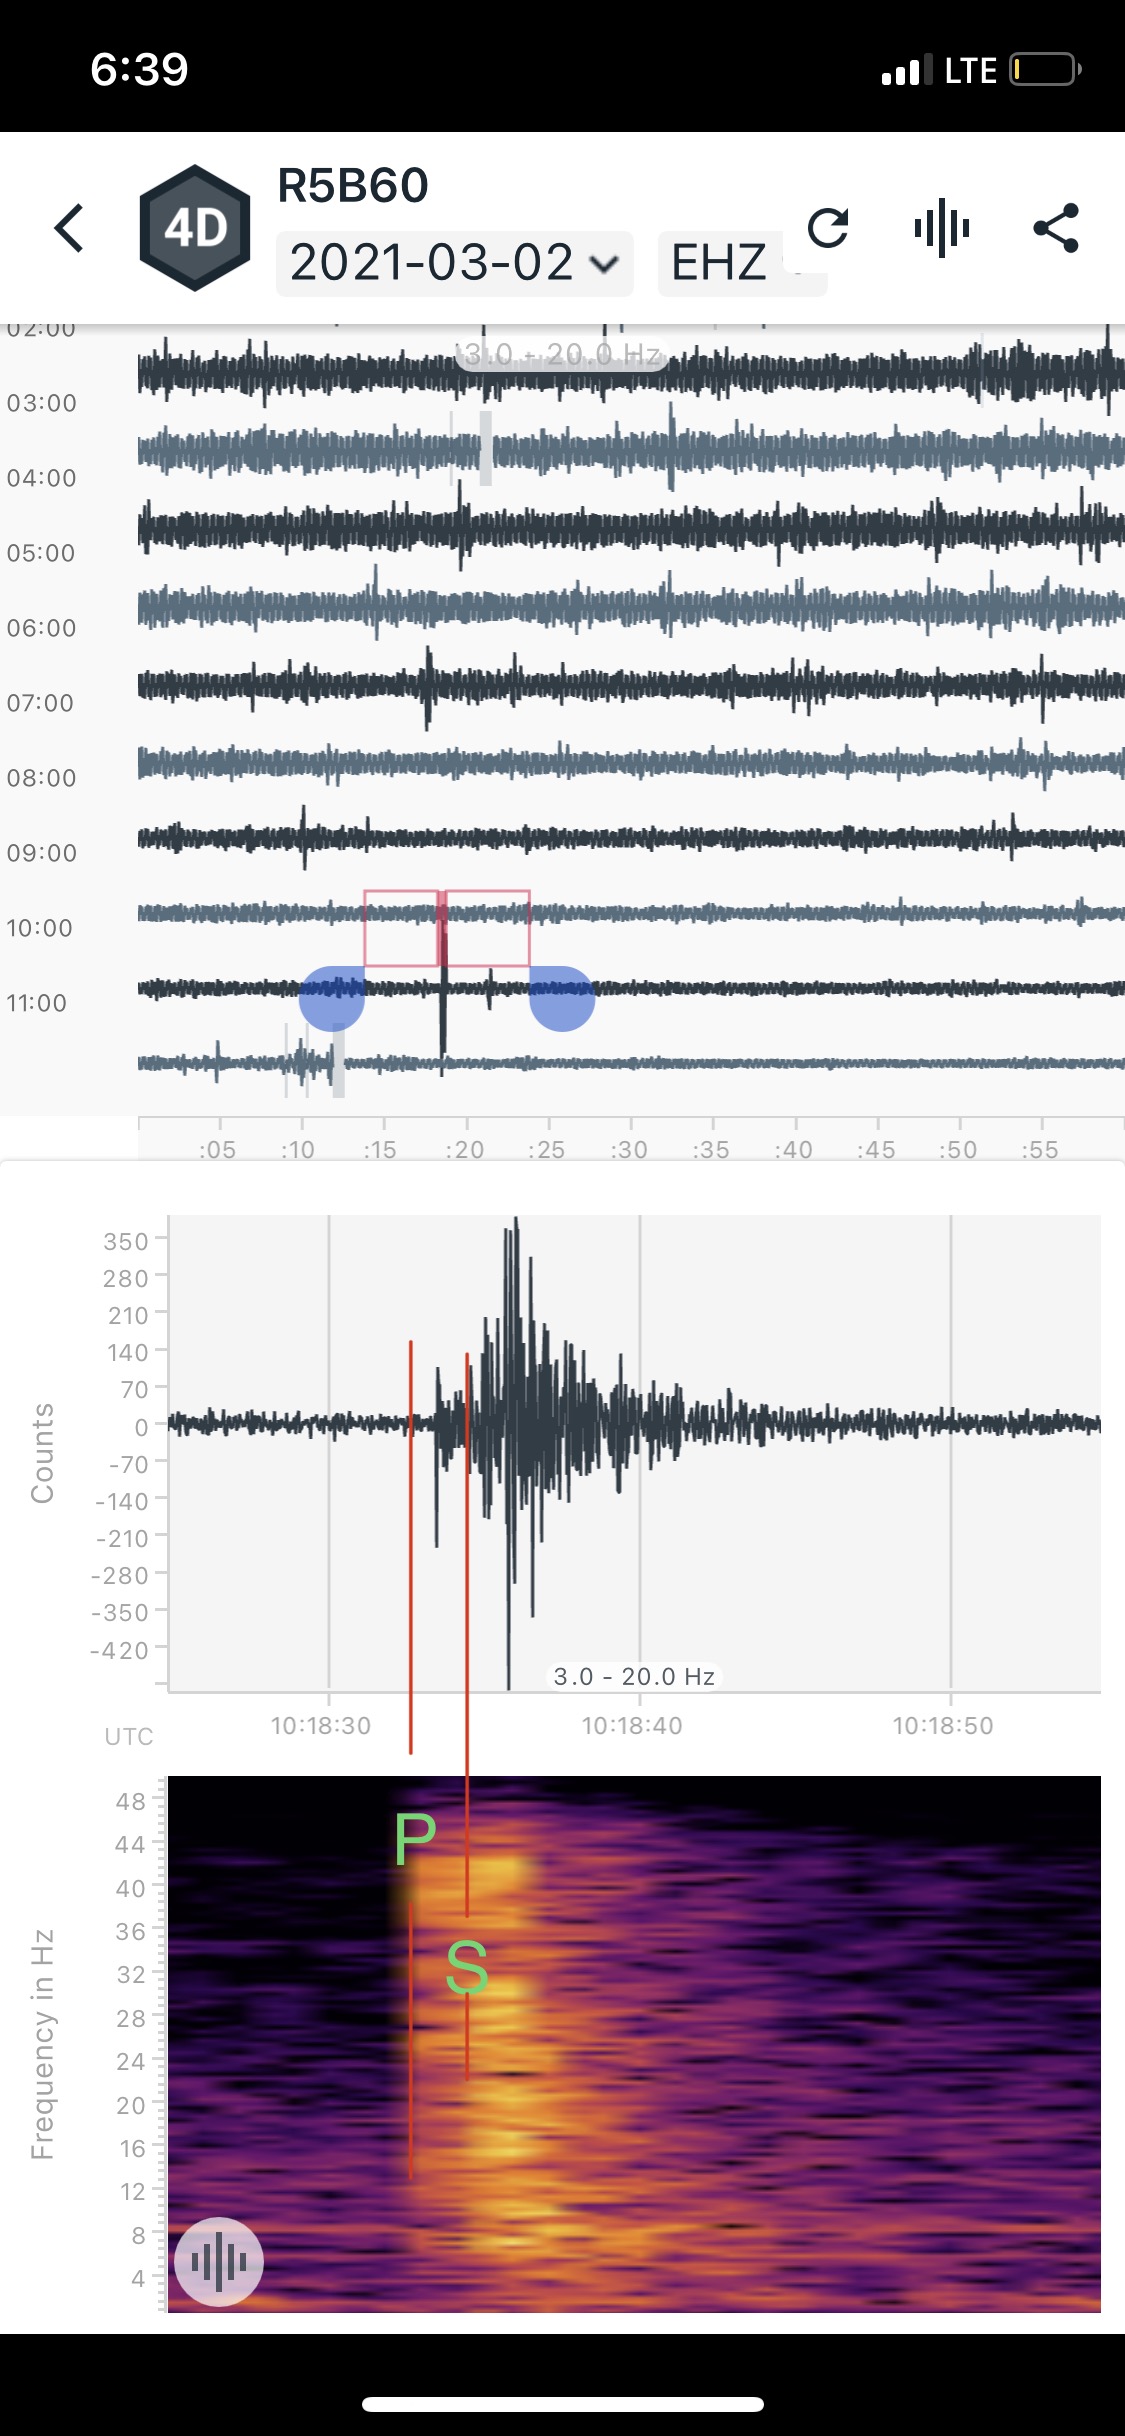
When it comes to getting a rough idea of their distance to me I try to make out the P and S wave arrival time and use the formula to work out distance. I’ve attached two images. Sometimes it is easy to tell as their P and S wave have two distinct spikes both in the counts and frequency view like in the first pic however, sometimes they are closer together like the second pic. These are my guesses. Do you also think they are the P and S wave arrivals which I have marked with the red line and labeled “P” and “S”? They generally seem to be 20-30km from where I am so quite close but that means they must have a low magnitude - guessing less than 3 as they don’t seem to be felt, at least where I am.
It also seems that the frequency always spikes just a second or less before the count spikes. I don’t know if that’s an error in the formatting and view or if that’s actually how the earthquakes occur with frequency spiking first.
Counts. Correct, just a number that indicates what is high and what is low.
2a) Locations - Have you used the Raspberry Shake Locator web app? It’s fun to play around with as you get to see signals from other shakes to triangulate positions. With only one station, you will get general area (circle around your station), ideally, you use three stations. Give it a try here if you haven’t used it before: https://locator.raspberryshake.org/
RE: Frequency spikes occurring first. These will be the first compressional (=higher energy=higher frequency) P waves. If you were to reduce the scale of the X axis (time) to only the time between the P & S (red lines) in your images, I bet you would see a small kick in counts just before the big spike.
I have tried the locator but it always gives me “no events listed” so I figured because these tremors I detect aren’t listed they don’t come on the locator web app?