RS4D earthquake channels and interpretation

Hello!

Today we had a magnitude 4ish quake, 6km deep and about 20km away from my RS4D which certainly felt the quake. The whole house shook too and it was interesting to see it live on the waveform.

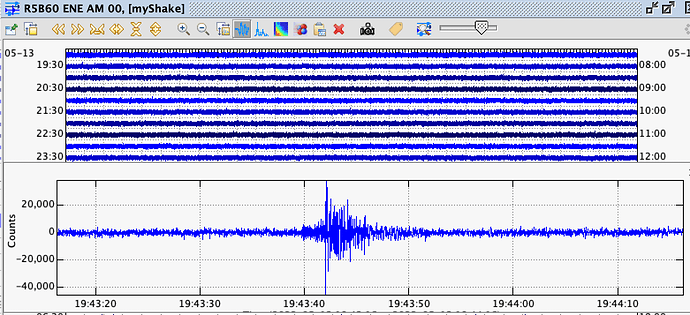
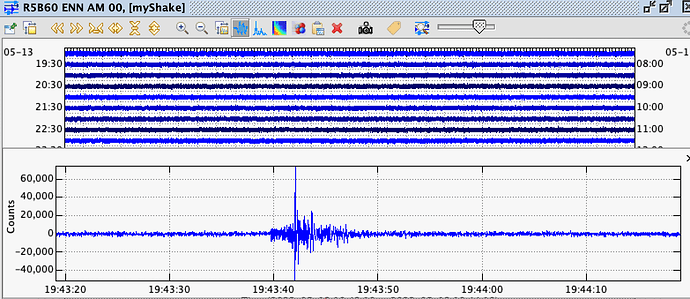
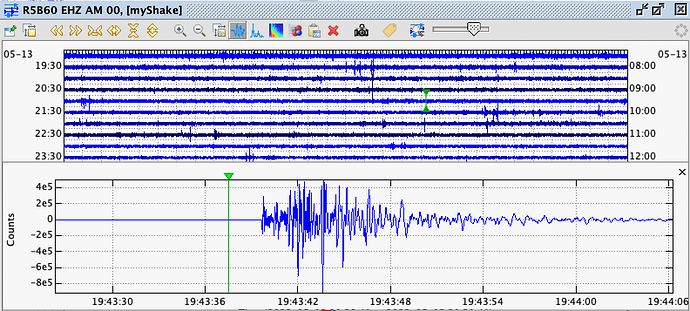
My RS4D detected it on its EHZ, ENN and ENE channels. EHZ had the most significant amplitude. I wanted to know the difference of each channel and what it means for this quake and what I can learn about the earthquake itself e.g. what the difference values for each channel means - EHZ largest spike was downwards with a value of -8e5, ENE was downwards too at 40,000 counts and ENN was upwards at 60,000 counts. What does the difference between these channels, their count numbers and upward/downward motions mean? Below I have taken a screenshot of each channel.

Thank you for your help.
1 Like

I can give you my understanding - which may be corrected by others that are more expert than myself in seismology.

The three channels are the three sensors (fgeophones) that you can see inside the device. They are mounted at 90° to each other, one vertical (the Z channel), one faci g North-South (the N channel) and one facing East-West (the E channel). So you get measurements in all three dimensions.

Earthquakes propagate in multiple ways, the result is that the ground moves in different ways at different times - like taking a tray and moving it back and forth, like taking the tray and moving it up and down and side to side. Because the shock is transmitted in different ways, the different motions travel at different rates. So further away from the earthquake, you can see distinct different types of shaking. Measuring the time between these is how you measure how far away from you an event was. Looking at your traces, it appears that you were very close, so you don’t see the different signals, they are all on top of each other.

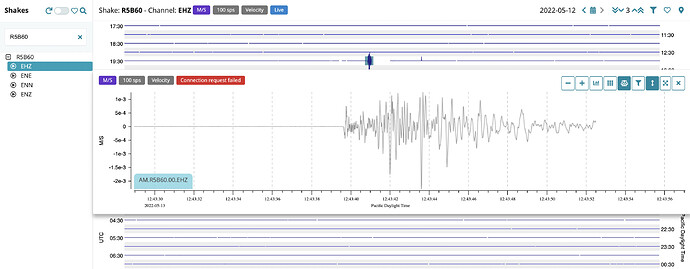
What the counts represent is the acceleration of the ground movement (in each dimension). The counts are the raw data from the analog to digital converters monitoring the geophones. Your device has calibration data that can be used to convert those counts to movement speed in M/S. This conversion is done for you if you look at your traces on the DataView website:

Here: https://dataview.raspberryshake.org/#/AM/R5B60/00/EHZ

Unfortunately, it looks like there was a brief network outage right after the earthquake (earthquakes do that…), but it did capture enough data to be interesting.

Whether the movement velocity is any more meaningful than the count value is debatable – it is when comparing values from two different types/makes of device, but when looking just at your own I can’t decide. I will say that 60,000 is big.

Hope this helps a bit.

3 Likes

Thank you so much for your in-depth response. Helps a lot.

I wonder if the counts/velocity of the waveform can be converted to other units like PGA to understand the acceleration values experienced and know what sort of quake we experienced (light, moderate etc)?

1 Like

It is possible to convert the counts output of any of our Shake models to different units, such as displacement (in meters), velocity (in meters per second), or acceleration (in meters per second squared).

We have a sample code in Python that utilizes the Obspy package to do so: Developer’s corner — Instructions on Setting Up Your Raspberry Shake

Playing with it a bit a display of three different charts, one for each unit listed above, could be created, providing what you are looking for.

1 Like

Being a newbie, I’ve been looking for what the values in the EHZ channel represent, ie 2e-5, etc and this is the first I’ve found. Can someone please elaborate what ‘e’ means and are the values log or linear?
Thank you

1 Like

Hello rjoe, good question!

The raw data output of all our sensors (and their associated channels) is counts, a unitless number that is essentially an analogue for the amount of voltage on the circuit of the given channel at the given time. You can find more information here: NSF SAGE: Frequently Answered Question.

After processing the raw data, the unit of measure is expressed in, usually, µm/s (micrometers per second) for geophone channels measuring velocity (EHZ, EHE, EHN), Pa (Pascals) for the infrasound channels (HDF) measuring pressure, and µm/s^2 (micrometers per second squared) measuring acceleration (ENZ, ENE, ENN).

Sometimes, particularly with ObsPy, or even on our mobile/web app(s), that notation 1e-6, 2e-5, etc., can appear to help keep the vertical y-axis “cleaner” and more understandable.

It’s scientific “e” notation (where the “e” stands for “exponent”), meaning that you have to multiply what you read on the y-axis by that number to obtain the correct value. For example:

  • the value on the y-axis reads 1.4
  • the notation shows 2e-5

So:

The “e” notation stands for: 2e-5 = 2 x 10^-5 = 2 x 0.00001 = 0.00002

Multiplied for the number on the y-axis gives you the final result of: 0.00002 x 1.4 = 0.000028

As you can see, it’s easier to have this kind of notation on the axis 1.4 x 2e-5 than having potentially “long” small or large numbers, cluttering the view.

If you want, you can expand on the “e” notation here: Scientific notation - Wikipedia.

I hope this was of help! If you have any other questions, let me know.