RPi Zero W still supported?

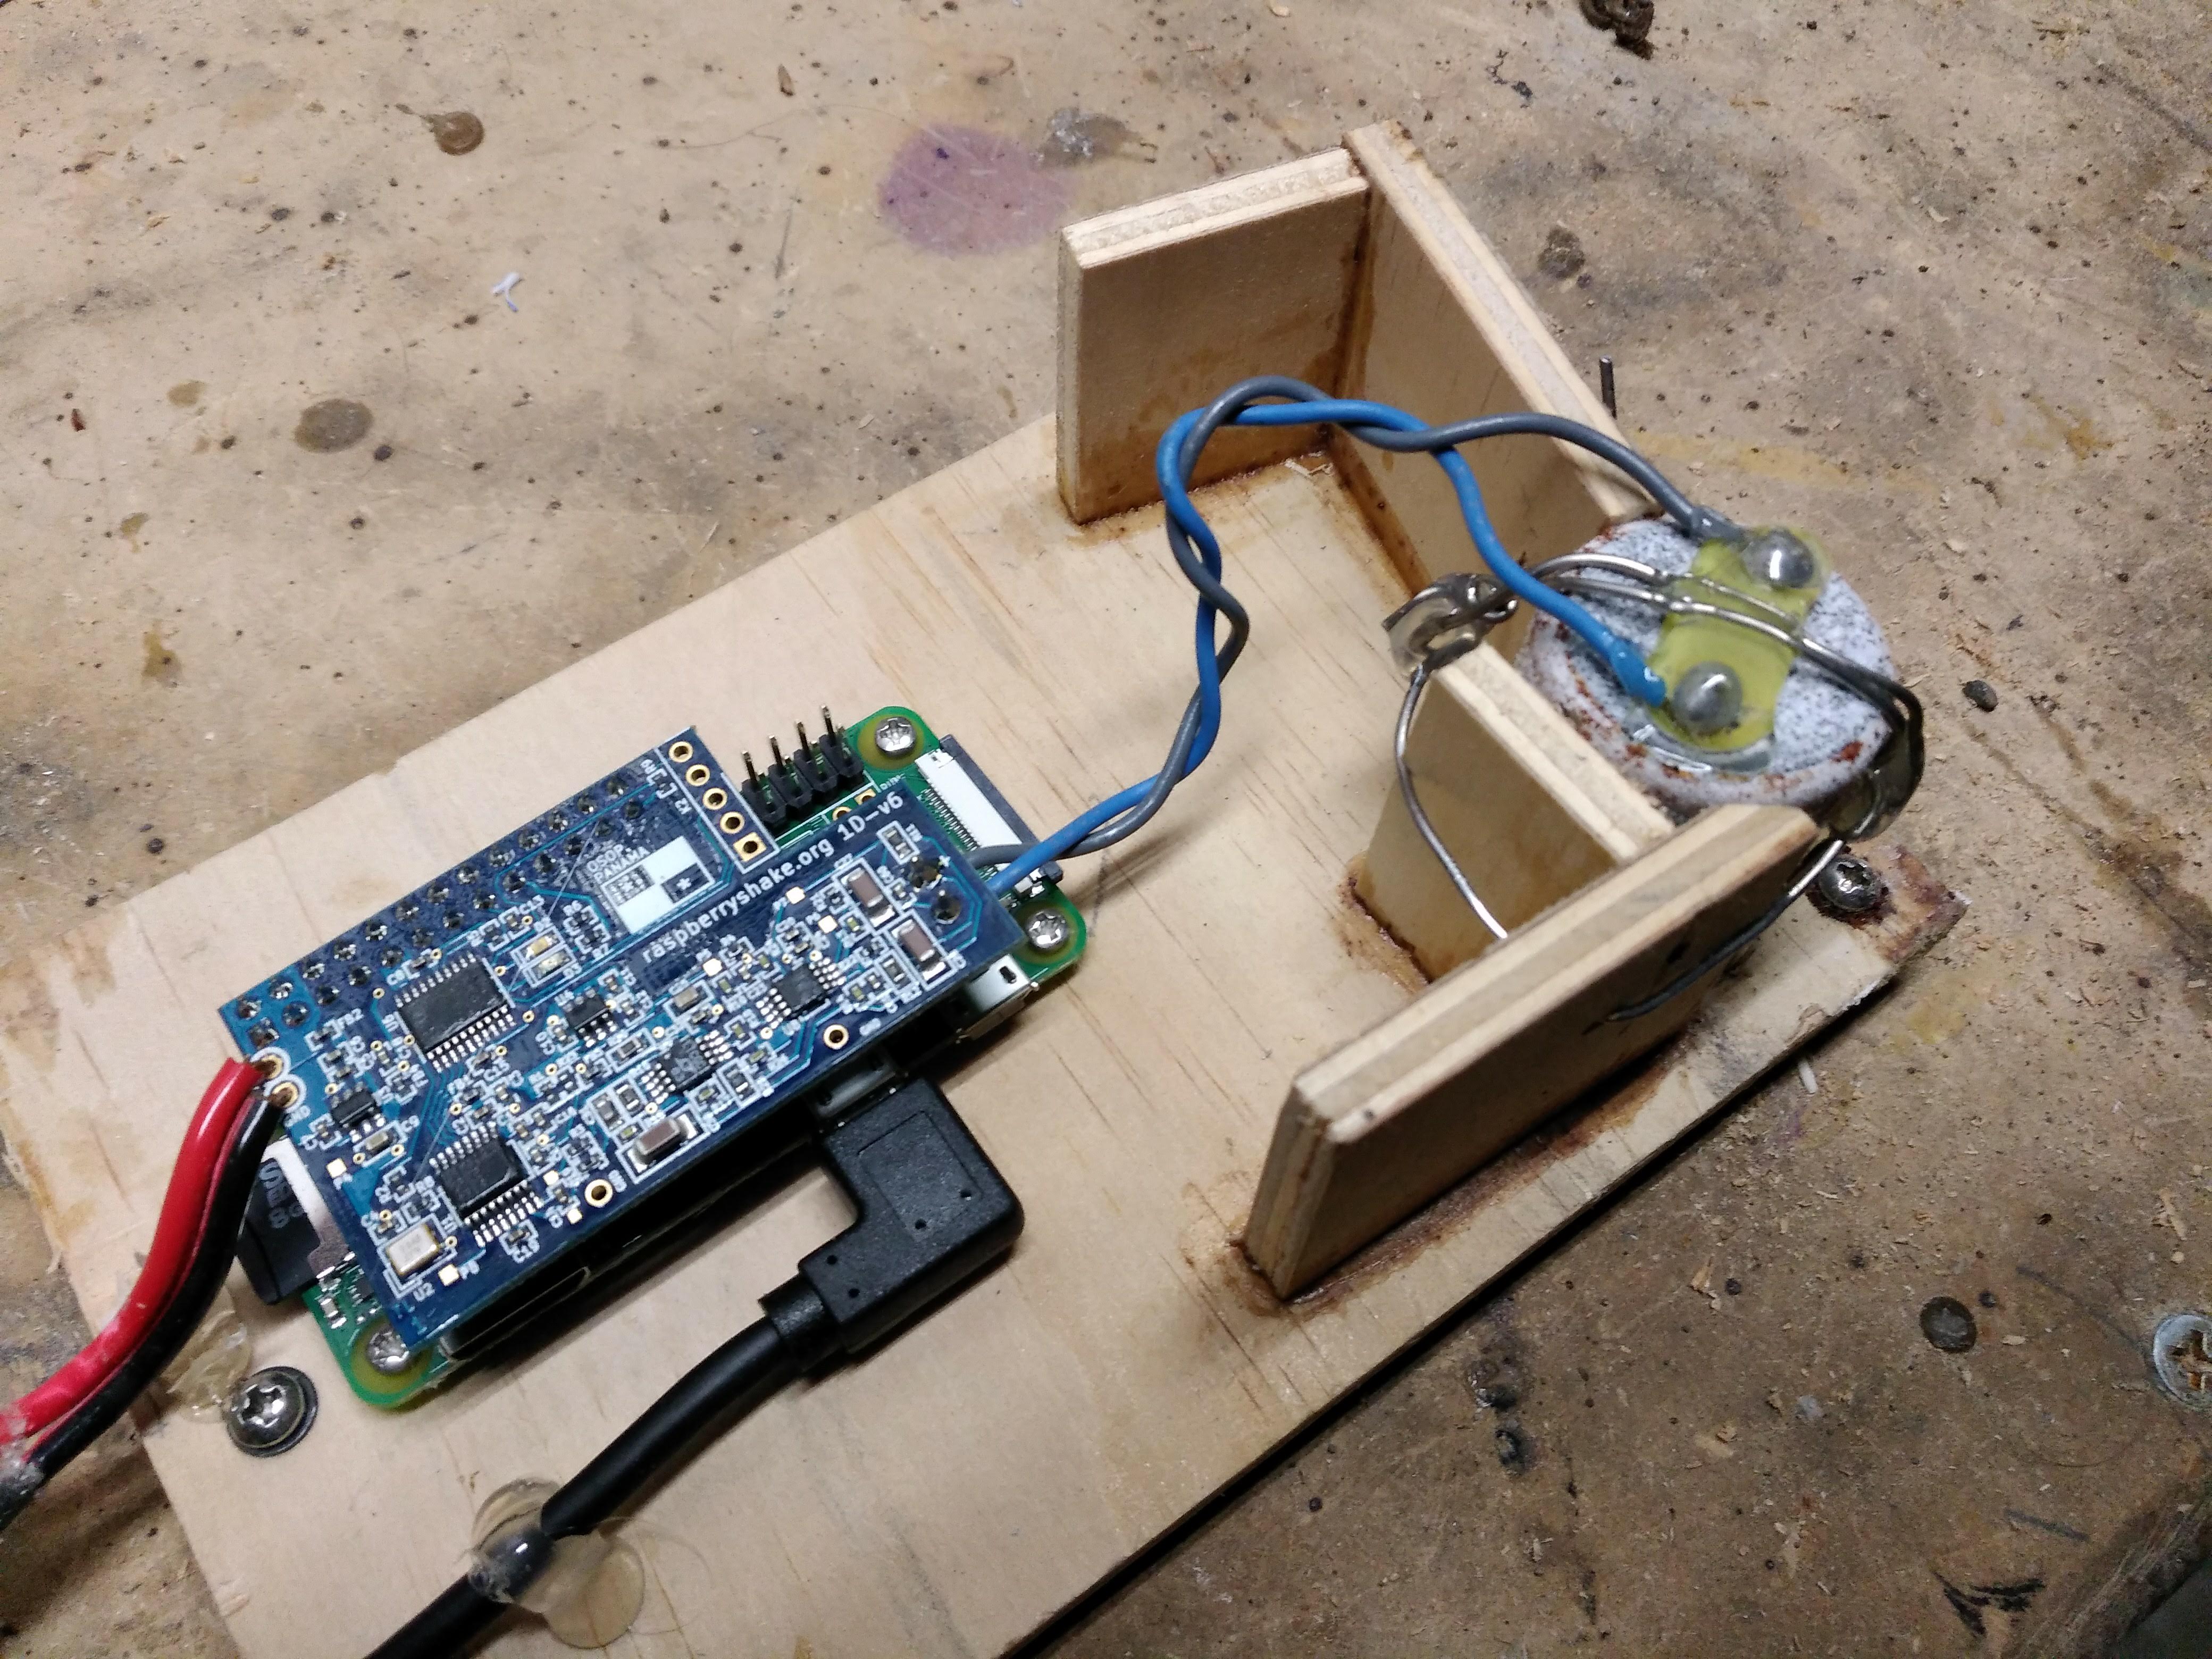
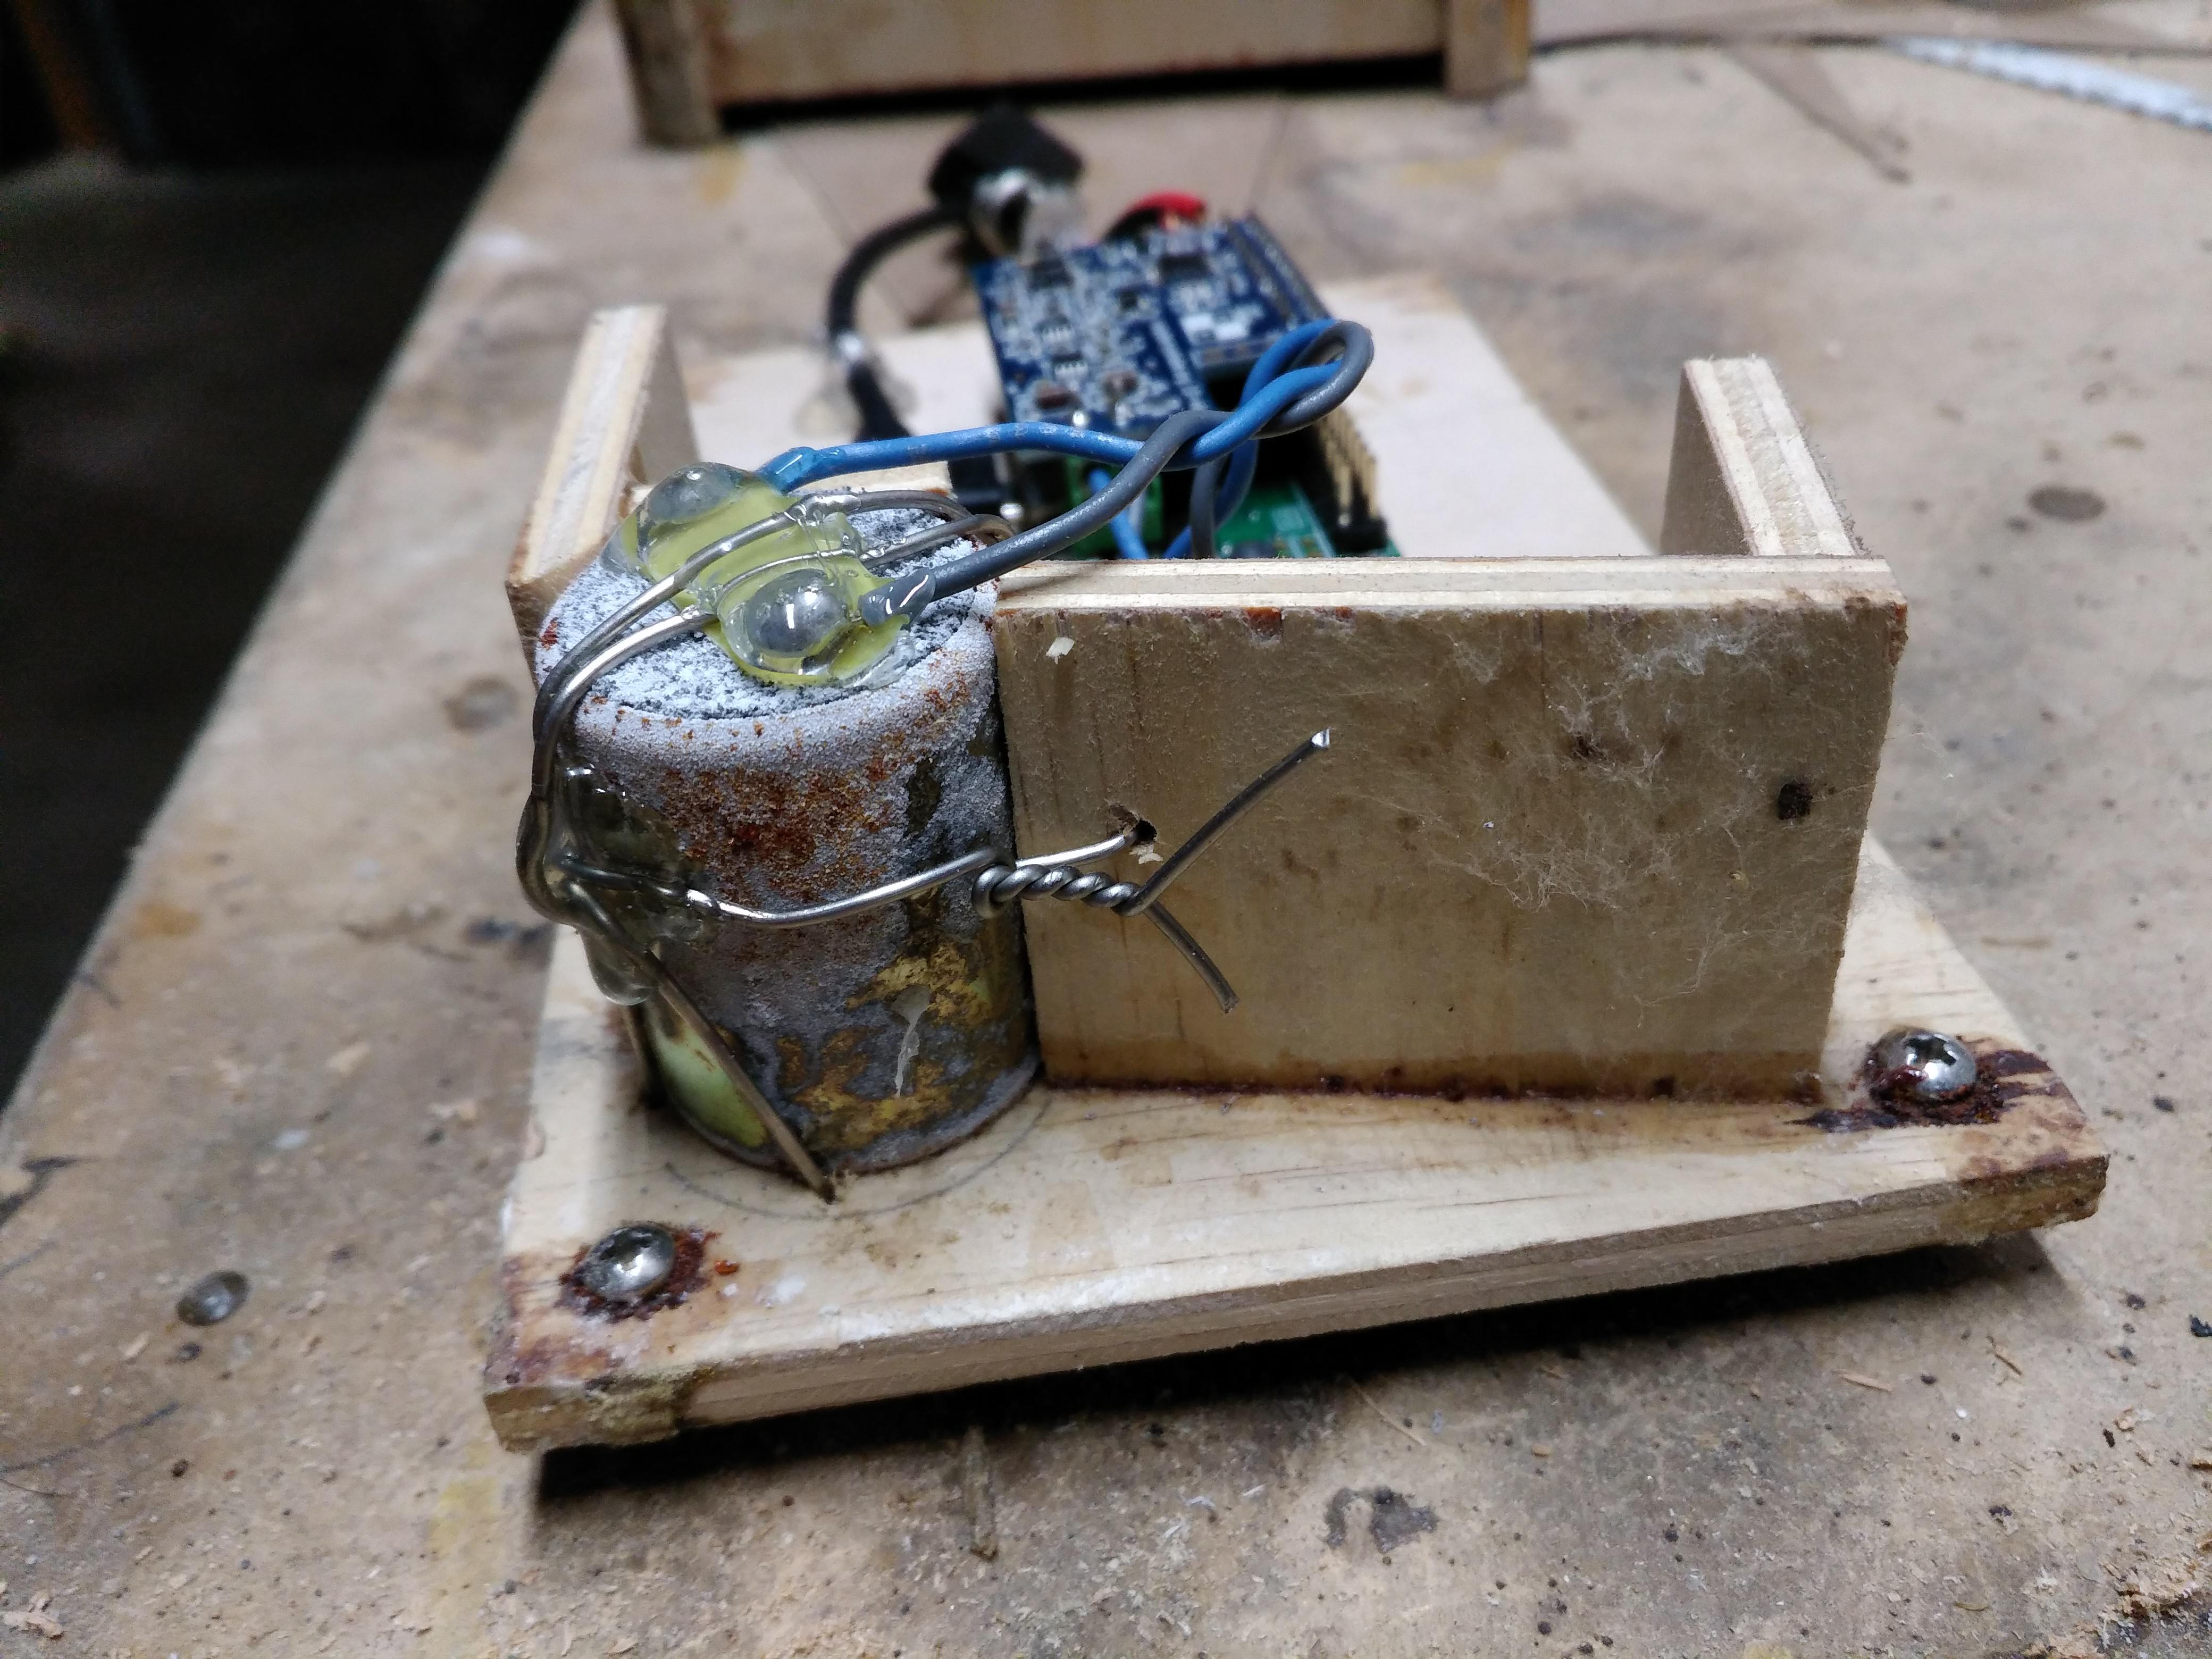
I notice that my R-Shake STATION: AM.R79D5.00.EHZ running on “Machine model: Raspberry Pi Zero W Rev 1.1” will no longer display a web page on my LAN, although I can still ssh into it. This is using a USB-Ethernet adaptor, not the wifi link. It doesn’t look like the normal data acquisition process is running. It had been working OK for about a year or so, but I haven’t been monitoring it actively in recent months.

I’m wondering if there was some auto-update in recent months that may not work properly on a Pi Zero, as that is probably uncommon hardware for most? Below is /opt/log/myshake.out

System Report: Wed Mar 18 00:00:02 UTC 2020

Versioning

  OS Version : Raspbian GNU/Linux 8 (jessie)

Kernel version : Linux raspberryshake 4.14.61+ #1132 Tue Aug 7 15:07:20 BST 2018 armv6l GNU/Linux
Software Version : v0.2
Firmware Version : RS1D-6-4.5
ODF Version : 2020.045

Computer Info

RPi revision : 9000c1 (Zero W)
ODF Serial Port : /dev/ttyS0
MAC Address : 00:0e:c6:b4:79:d5
UpTime : 00:00:03 up 1 min, 0 users, load average: 0.94, 0.38, 0.14
System time : Wed Mar 18 00:00:03 UTC 2020:
Disc usage : /dev/root 7.2G 2.3G 4.7G 33% /
CPU Temp : 38 C

System Info

heli_ewII : NOT Running
OWS : NOT Running
SeedLink : NOT Running
ODF : NOT Running
slarchive : NOT Running
SL info:
NONE Available

crontab Info:

@daily /usr/local/bin/myShake
@hourly /usr/local/bin/clean-logs
7 14 * * 6 /usr/local/bin/rsh-sw-fetcher C >/dev/null 2>&1

Station Info

Data-Sharing Mode : ON
Data Server Conn : OFF
Save Data Days : 7
Heli Scale : 0.1
Station Name : AM.R79D5.00.EHZ
Geophone : OSOP

Clock Info

  • ntpdate.service - Network Time Service
    Loaded: loaded (/lib/systemd/system/ntpdate.service; enabled)
    Active: active (exited) since Tue 2020-03-17 23:58:54 UTC; 1min 12s ago
    Process: 579 ExecStart=/usr/sbin/ntpd -u ntp:ntp -q -g -x -t 5 (code=exited, status=0/SUCCESS)

Mar 17 23:17:20 raspberryshake ntpd[579]: ntpd 4.2.6p5@1.2349-o Mon Jul 25 22:35:28 UTC 2016 (1)
Mar 17 23:17:20 raspberryshake ntpd[579]: proto: precision = 1.000 usec
Mar 17 23:17:20 raspberryshake ntpd[579]: Listen and drop on 0 v4wildcard 0.0.0.0 UDP 123
Mar 17 23:17:20 raspberryshake ntpd[579]: Listen and drop on 1 v6wildcard :: UDP 123
Mar 17 23:17:20 raspberryshake ntpd[579]: Listen normally on 2 lo 127.0.0.1 UDP 123
Mar 17 23:17:20 raspberryshake ntpd[579]: Listen normally on 3 eth0 192.168.1.130 UDP 123
Mar 17 23:17:20 raspberryshake ntpd[579]: peers refreshed
Mar 17 23:17:20 raspberryshake ntpd[579]: Listening on routing socket on fd #20 for interface updates
Mar 17 23:58:54 raspberryshake systemd[1]: Started Network Time Service.
Mar 17 23:58:54 raspberryshake ntpd[579]: ntpd: time set +2487.070333s

  • ntpd.service - Network Time Service
    Loaded: loaded (/lib/systemd/system/ntpd.service; enabled)
    Active: active (running) since Tue 2020-03-17 23:58:54 UTC; 1min 12s ago
    Process: 719 ExecStart=/usr/sbin/ntpd -u ntp:ntp -f /etc/ntp.conf -p /run/ntpd.pid (code=exited, status=0/SUCCESS)
    Main PID: 720 (ntpd)
    CGroup: /system.slice/ntpd.service
    `-720 /usr/sbin/ntpd -u ntp:ntp -f /etc/ntp.conf -p /run/ntpd.pid

Mar 17 23:58:54 raspberryshake ntpd[720]: proto: precision = 1.000 usec
Mar 17 23:58:54 raspberryshake ntpd[720]: format error frequency file /etc/ntp.conf
Mar 17 23:58:54 raspberryshake ntpd[720]: Listen and drop on 0 v4wildcard 0.0.0.0 UDP 123
Mar 17 23:58:54 raspberryshake systemd[1]: Started Network Time Service.
Mar 17 23:58:55 raspberryshake ntpd[720]: Listen and drop on 1 v6wildcard :: UDP 123
Mar 17 23:58:55 raspberryshake ntpd[720]: Listen normally on 2 lo 127.0.0.1 UDP 123
Mar 17 23:58:55 raspberryshake ntpd[720]: Listen normally on 3 eth0 192.168.1.130 UDP 123
Mar 17 23:58:55 raspberryshake ntpd[720]: Listen normally on 4 docker0 172.17.0.2 UDP 123
Mar 17 23:58:55 raspberryshake ntpd[720]: peers refreshed
Mar 17 23:58:55 raspberryshake ntpd[720]: Listening on routing socket on fd #21 for interface updates

 remote           refid      st t when poll reach   delay   offset  jitter

==============================================================================
*backup04.cblue. 193.190.230.66 2 u 2 64 3 173.170 0.820 2.920
216.126.233.109 128.227.205.3 2 u 4 64 3 92.874 8.731 0.190
hazmester-vlan1 .INIT. 16 u - 64 0 0.000 0.000 0.000

Network Info

Stand-Alone Mode : OFF
Ethernet UP : YES
WiFi UP : NO
DNS Available : YES
Network Accessible : YES
Nameservers : 192.168.1.1

=== ifconfig =======
docker0 Link encap:Ethernet HWaddr 02:42:ba:2b:44:64
inet addr:172.17.0.2 Bcast:0.0.0.0 Mask:255.255.0.0
UP BROADCAST MULTICAST MTU:1500 Metric:1
RX packets:0 errors:0 dropped:0 overruns:0 frame:0
TX packets:0 errors:0 dropped:0 overruns:0 carrier:0
collisions:0 txqueuelen:0
RX bytes:0 (0.0 B) TX bytes:0 (0.0 B)

eth0 Link encap:Ethernet HWaddr 00:0e:c6:b4:79:d5
inet addr:192.168.1.130 Bcast:192.168.1.255 Mask:255.255.255.0
UP BROADCAST RUNNING MULTICAST MTU:1500 Metric:1
RX packets:1106 errors:0 dropped:0 overruns:0 frame:0
TX packets:553 errors:0 dropped:0 overruns:0 carrier:0
collisions:0 txqueuelen:1000
RX bytes:193211 (188.6 KiB) TX bytes:64876 (63.3 KiB)

lo Link encap:Local Loopback
inet addr:127.0.0.1 Mask:255.0.0.0
UP LOOPBACK RUNNING MTU:65536 Metric:1
RX packets:11 errors:0 dropped:0 overruns:0 frame:0
TX packets:11 errors:0 dropped:0 overruns:0 carrier:0
collisions:0 txqueuelen:1000
RX bytes:2152 (2.1 KiB) TX bytes:2152 (2.1 KiB)

===== END ========

=== /etc/network/interfaces FILE ==========

interfaces(5) file used by ifup(8) and ifdown(8)

Please note that this file is written to be used with dhcpcd

For static IP, consult /etc/dhcpcd.conf and ‘man dhcpcd.conf’

Include files from /etc/network/interfaces.d:

source-directory /etc/network/interfaces.d

auto lo
iface lo inet loopback

iface eth0 inet manual

Start wlan0 definition

allow-hotplug wlan0
iface wlan0 inet dhcp

wpa-conf /etc/wpa_supplicant/wpa_supplicant.conf
===== END ========

WiFi Info

Kernel modules loaded : NO
Enablement : OFF

Docker Info

Docker version 1.11.1, build 5604cbe

IMAGE ID CREATED AT SIZE REPOSITORY
2b5af180f111 2020-02-14 13:30:13 +0000 UTC 83.41 MB registry.gitlab.com/rshake-public/rsh-fe-config
7b20e90e6a6a 2020-02-14 13:25:56 +0000 UTC 159.5 MB registry.gitlab.com/rshake-public/rsh-data-producer
79f3943a55c6 2019-01-30 19:16:42 +0000 UTC 140.8 MB registry.gitlab.com/rshake-public/rsh-fe-config
992d3d7c940f 2017-06-10 16:40:10 +0000 UTC 144.8 MB registry.gitlab.com/rshake-public/rsh-data-consumer

CONTAINER STATUS CREATED AT

…interestingly, I notice that this station R79D5 is still visible and streaming live data visible at https://shakenet.raspberryshake.org/my-shake
and the data is similar to, yet different from my other station RF7DC which is physically sitting right next to it.

So I guess R79D5 is actually working, and yet for some reason the local web server is not enabled or not working properly (?)

hi john,

what is strange in the myshake.out log is that it is reporting to be on v0.2. this is 16 versions behind. yet, your docker images have been properly updating.

can you send along some additional log files:

  1. postboot.log
  2. postboot.log.old
  3. upgrade.log

which might tell me what could be going on.

thanks in advance,

richard

I will try to attach the requested logs as a zip file here.
logs.zip (15.8 KB)

Also, if it means anything:

myshake@raspberryshake:/opt/log $ systemctl status rsh-fe-config.service
● rsh-fe-config.service - FE Config Service
Loaded: loaded (/lib/systemd/system/rsh-fe-config.service; disabled)
Active: failed (Result: exit-code) since Wed 2020-03-18 00:10:14 UTC; 17h ago
Process: 761 ExecStart=/usr/local/bin/./rsh-fe-config.start.sh (code=exited, status=203/EXEC)
Main PID: 761 (code=exited, status=203/EXEC)

Great to hear from you again @jbeale!

branden

hi john,

thanks for the log files, they were illuminating. it seems there’s a syntax error in the update script that is failing for your unit that i will need to look into further.

i will get back to you.

in the meantime, i wonder if it would be too much trouble for you to re-burn your SD card with the latest image and see if that doesn’t fix this problem. it’s entirely possible that the syntax error is caused by a file that has become corrupt, where the new image will fix this. instructions to burn the image can be found here.

richard

Thanks Richard. If there is any possibility for me to fix this remotely via ssh, that would be preferred. It would take some effort for me to physically reach the device at this point.

hi john,

would there be any way i could get access to this myself. it’s not entirely clear to me what could be going on from the logs, but if were able to get on, i could probably get the situation fixed.

zerotier works well, we have found.

thanks in advance,

richard

I went down to the site, and retrieved my R79D5 station which is based on a RPi-Zero. The site was outdoors but inside a wood box, inside a sheltered enclosure. It looks like high humidity is not good for the geophone sensor, just as a guess. The stainless steel aviation wire holding it in place against some wood braces is OK, but the case of the sensor itself looks pretty bad.


Update. I dried out the system in a +70 C convection oven for 2 hours, and I reformatted the SD card and reinstalled with the current software. Now station AM.R79D5.00 is back online and it seems to work, despite the rather desperate-looking condition of the sensor.

I have not re-installed it outdoors, pending some more thoughts about how to keep the average ambient humidity down. This is one area where the lower power dissipation of a Pi Zero is probably not good. I assume a higher power board would keep the internal volume warmer and its relative humidity lower in general, although I’m sure the case and shelter construction details matter as well.

1 Like

Hi @jbeale, that does not look like ordinary wear and tear, but instead like galvanic corrosion. If you combine unlike metals with an electrolyte without what’s called a “sacrificial” anode, the cathodic metal (brass in this case) will break down. The electrolyte could be almost anything dissolved in water (salt is most likely). The stainless is the anode in this case so I am guessing that’s why the it looks more or less okay.

If you were to use, for example, a plastic zip tie instead of the stainless wire, you would not see this level of corrosion. I highly recommend changing out the wire for something inert as soon as you can.

Incidentally, a similar galvanic reaction is also why your lock washers appear to be a lot more rusted than the screws.

I don’t remember high school chemistry but I did work in the marine survey industry for several years, and had to try to figure out a lot of weird boat engineering problems like this one… :smile:

Yes, what you say makes sense. I replaced the hold-down wire with a plastic zip-tie, and added a coat of outdoor latex paint too. I will also improve the enclosure. We’ll see how this holds up.

2 Likes

Good thinking on the paint, I think that should slow down the process greatly

After running for some days apparently normally, I noticed my R79D5 station stopped recording for a while, although it started again before I noticed it. ‘dmesg’ reveals the following. I guess it is some kind of SD card failure, perhaps.

[ 125.443105] IPv6: ADDRCONF(NETDEV_UP): eth0: link is not ready
[ 125.443219] IPv6: ADDRCONF(NETDEV_CHANGE): eth0: link becomes ready
[ 125.443579] docker0: port 3(veth434eb72) entered blocking state
[ 125.443596] docker0: port 3(veth434eb72) entered forwarding state
[998528.787929] INFO: task kworker/0:1:7766 blocked for more than 120 seconds.
[998528.787951] Tainted: G C 4.19.97+ #1294
[998528.787956] “echo 0 > /proc/sys/kernel/hung_task_timeout_secs” disables this message.
[998528.787965] kworker/0:1 D 0 7766 2 0x00000000
[998528.788012] Workqueue: events_freezable mmc_rescan
[998528.788067] [] (__schedule) from [] (schedule+0x50/0xa8)
[998528.788088] [] (schedule) from [] (__mmc_claim_host+0xbc/0x288)
[998528.788108] [] (__mmc_claim_host) from [] (mmc_get_card+0x38/0x3c)
[998528.788127] [] (mmc_get_card) from [] (mmc_sd_detect+0x24/0x7c)
[998528.788143] [] (mmc_sd_detect) from [] (mmc_rescan+0x28c/0x498)
[998528.788176] [] (mmc_rescan) from [] (process_one_work+0x130/0x3a0)
[998528.788196] [] (process_one_work) from [] (worker_thread+0x34/0x530)
[998528.788216] [] (worker_thread) from [] (kthread+0x11c/0x158)
[998528.788234] [] (kthread) from [] (ret_from_fork+0x14/0x28)
[998528.788242] Exception stack(0xda781fb0 to 0xda781ff8)
[998528.788251] 1fa0: 00000000 00000000 00000000 00000000
[998528.788262] 1fc0: 00000000 00000000 00000000 00000000 00000000 00000000 00000000 00000000
[998528.788271] 1fe0: 00000000 00000000 00000000 00000000 00000013 00000000
[998651.668929] INFO: task kworker/0:1:7766 blocked for more than 120 seconds.
[998651.668951] Tainted: G C 4.19.97+ #1294
[998651.668957] “echo 0 > /proc/sys/kernel/hung_task_timeout_secs” disables this message.
[998651.668965] kworker/0:1 D 0 7766 2 0x00000000
[998651.669013] Workqueue: events_freezable mmc_rescan
[998651.669064] [] (__schedule) from [] (schedule+0x50/0xa8)
[998651.669087] [] (schedule) from [] (__mmc_claim_host+0xbc/0x288)
[998651.669105] [] (__mmc_claim_host) from [] (mmc_get_card+0x38/0x3c)
[998651.669126] [] (mmc_get_card) from [] (mmc_sd_detect+0x24/0x7c)
[998651.669145] [] (mmc_sd_detect) from [] (mmc_rescan+0x28c/0x498)
[998651.669174] [] (mmc_rescan) from [] (process_one_work+0x130/0x3a0)
[998651.669195] [] (process_one_work) from [] (worker_thread+0x34/0x530)
[998651.669215] [] (worker_thread) from [] (kthread+0x11c/0x158)
[998651.669235] [] (kthread) from [] (ret_from_fork+0x14/0x28)
[998651.669243] Exception stack(0xda781fb0 to 0xda781ff8)
[998651.669252] 1fa0: 00000000 00000000 00000000 00000000
[998651.669263] 1fc0: 00000000 00000000 00000000 00000000 00000000 00000000 00000000 00000000
[998651.669272] 1fe0: 00000000 00000000 00000000 00000000 00000013 00000000
[998774.550507] INFO: task kworker/0:1:7766 blocked for more than 120 seconds.
[998774.550528] Tainted: G C 4.19.97+ #1294
[998774.550534] “echo 0 > /proc/sys/kernel/hung_task_timeout_secs” disables this message.
[998774.550542] kworker/0:1 D 0 7766 2 0x00000000
[998774.550592] Workqueue: events_freezable mmc_rescan
[998774.550645] [] (__schedule) from [] (schedule+0x50/0xa8)
[998774.550667] [] (schedule) from [] (__mmc_claim_host+0xbc/0x288)
[998774.550689] [] (__mmc_claim_host) from [] (mmc_get_card+0x38/0x3c)
[998774.550709] [] (mmc_get_card) from [] (mmc_sd_detect+0x24/0x7c)
[998774.550725] [] (mmc_sd_detect) from [] (mmc_rescan+0x28c/0x498)
[998774.550756] [] (mmc_rescan) from [] (process_one_work+0x130/0x3a0)
[998774.550777] [] (process_one_work) from [] (worker_thread+0x34/0x530)
[998774.550799] [] (worker_thread) from [] (kthread+0x11c/0x158)
[998774.550820] [] (kthread) from [] (ret_from_fork+0x14/0x28)
[998774.550828] Exception stack(0xda781fb0 to 0xda781ff8)
[998774.550837] 1fa0: 00000000 00000000 00000000 00000000
[998774.550848] 1fc0: 00000000 00000000 00000000 00000000 00000000 00000000 00000000 00000000
[998774.550857] 1fe0: 00000000 00000000 00000000 00000000 00000013 00000000
[998897.431001] INFO: task kworker/0:1:7766 blocked for more than 120 seconds.
[998897.431022] Tainted: G C 4.19.97+ #1294
[998897.431028] “echo 0 > /proc/sys/kernel/hung_task_timeout_secs” disables this message.
[998897.431037] kworker/0:1 D 0 7766 2 0x00000000
[998897.431083] Workqueue: events_freezable mmc_rescan
[998897.431136] [] (__schedule) from [] (schedule+0x50/0xa8)
[998897.431158] [] (schedule) from [] (__mmc_claim_host+0xbc/0x288)
[998897.431177] [] (__mmc_claim_host) from [] (mmc_get_card+0x38/0x3c)
[998897.431196] [] (mmc_get_card) from [] (mmc_sd_detect+0x24/0x7c)
[998897.431214] [] (mmc_sd_detect) from [] (mmc_rescan+0x28c/0x498)
[998897.431244] [] (mmc_rescan) from [] (process_one_work+0x130/0x3a0)
[998897.431265] [] (process_one_work) from [] (worker_thread+0x34/0x530)
[998897.431285] [] (worker_thread) from [] (kthread+0x11c/0x158)
[998897.431303] [] (kthread) from [] (ret_from_fork+0x14/0x28)
[998897.431312] Exception stack(0xda781fb0 to 0xda781ff8)
[998897.431321] 1fa0: 00000000 00000000 00000000 00000000
[998897.431331] 1fc0: 00000000 00000000 00000000 00000000 00000000 00000000 00000000 00000000
[998897.431340] 1fe0: 00000000 00000000 00000000 00000000 00000013 00000000
[999020.311582] INFO: task kworker/0:1:7766 blocked for more than 120 seconds.
[999020.311603] Tainted: G C 4.19.97+ #1294
[999020.311609] “echo 0 > /proc/sys/kernel/hung_task_timeout_secs” disables this message.
[999020.311618] kworker/0:1 D 0 7766 2 0x00000000
[999020.311664] Workqueue: events_freezable mmc_rescan
[999020.311717] [] (__schedule) from [] (schedule+0x50/0xa8)
[999020.311739] [] (schedule) from [] (__mmc_claim_host+0xbc/0x288)
[999020.311758] [] (__mmc_claim_host) from [] (mmc_get_card+0x38/0x3c)
[999020.311776] [] (mmc_get_card) from [] (mmc_sd_detect+0x24/0x7c)
[999020.311793] [] (mmc_sd_detect) from [] (mmc_rescan+0x28c/0x498)
[999020.311826] [] (mmc_rescan) from [] (process_one_work+0x130/0x3a0)
[999020.311901] [] (process_one_work) from [] (worker_thread+0x34/0x530)
[999020.311926] [] (worker_thread) from [] (kthread+0x11c/0x158)
[999020.311949] [] (kthread) from [] (ret_from_fork+0x14/0x28)
[999020.311958] Exception stack(0xda781fb0 to 0xda781ff8)
[999020.311968] 1fa0: 00000000 00000000 00000000 00000000
[999020.311979] 1fc0: 00000000 00000000 00000000 00000000 00000000 00000000 00000000 00000000
[999020.311989] 1fe0: 00000000 00000000 00000000 00000000 00000013 00000000
[999143.192493] INFO: task kworker/0:1:7766 blocked for more than 120 seconds.
[999143.192515] Tainted: G C 4.19.97+ #1294
[999143.192521] “echo 0 > /proc/sys/kernel/hung_task_timeout_secs” disables this message.
[999143.192530] kworker/0:1 D 0 7766 2 0x00000000
[999143.192575] Workqueue: events_freezable mmc_rescan
[999143.192628] [] (__schedule) from [] (schedule+0x50/0xa8)
[999143.192651] [] (schedule) from [] (__mmc_claim_host+0xbc/0x288)
[999143.192670] [] (__mmc_claim_host) from [] (mmc_get_card+0x38/0x3c)
[999143.192689] [] (mmc_get_card) from [] (mmc_sd_detect+0x24/0x7c)
[999143.192706] [] (mmc_sd_detect) from [] (mmc_rescan+0x28c/0x498)
[999143.192739] [] (mmc_rescan) from [] (process_one_work+0x130/0x3a0)
[999143.192760] [] (process_one_work) from [] (worker_thread+0x34/0x530)
[999143.192780] [] (worker_thread) from [] (kthread+0x11c/0x158)
[999143.192798] [] (kthread) from [] (ret_from_fork+0x14/0x28)
[999143.192807] Exception stack(0xda781fb0 to 0xda781ff8)
[999143.192816] 1fa0: 00000000 00000000 00000000 00000000
[999143.192827] 1fc0: 00000000 00000000 00000000 00000000 00000000 00000000 00000000 00000000
[999143.192836] 1fe0: 00000000 00000000 00000000 00000000 00000013 00000000
[999266.073660] INFO: task kworker/0:1:7766 blocked for more than 120 seconds.
[999266.073682] Tainted: G C 4.19.97+ #1294
[999266.073687] “echo 0 > /proc/sys/kernel/hung_task_timeout_secs” disables this message.
[999266.073697] kworker/0:1 D 0 7766 2 0x00000000
[999266.073741] Workqueue: events_freezable mmc_rescan
[999266.073792] [] (__schedule) from [] (schedule+0x50/0xa8)
[999266.073815] [] (schedule) from [] (__mmc_claim_host+0xbc/0x288)
[999266.073835] [] (__mmc_claim_host) from [] (mmc_get_card+0x38/0x3c)
[999266.073853] [] (mmc_get_card) from [] (mmc_sd_detect+0x24/0x7c)
[999266.073869] [] (mmc_sd_detect) from [] (mmc_rescan+0x28c/0x498)
[999266.073900] [] (mmc_rescan) from [] (process_one_work+0x130/0x3a0)
[999266.073922] [] (process_one_work) from [] (worker_thread+0x34/0x530)
[999266.073942] [] (worker_thread) from [] (kthread+0x11c/0x158)
[999266.073962] [] (kthread) from [] (ret_from_fork+0x14/0x28)
[999266.073970] Exception stack(0xda781fb0 to 0xda781ff8)
[999266.073979] 1fa0: 00000000 00000000 00000000 00000000
[999266.073990] 1fc0: 00000000 00000000 00000000 00000000 00000000 00000000 00000000 00000000
[999266.073999] 1fe0: 00000000 00000000 00000000 00000000 00000013 00000000
[999388.954492] INFO: task kworker/0:1:7766 blocked for more than 120 seconds.
[999388.954514] Tainted: G C 4.19.97+ #1294
[999388.954520] “echo 0 > /proc/sys/kernel/hung_task_timeout_secs” disables this message.
[999388.954528] kworker/0:1 D 0 7766 2 0x00000000
[999388.954573] Workqueue: events_freezable mmc_rescan
[999388.954626] [] (__schedule) from [] (schedule+0x50/0xa8)
[999388.954648] [] (schedule) from [] (__mmc_claim_host+0xbc/0x288)
[999388.954667] [] (__mmc_claim_host) from [] (mmc_get_card+0x38/0x3c)
[999388.954685] [] (mmc_get_card) from [] (mmc_sd_detect+0x24/0x7c)
[999388.954702] [] (mmc_sd_detect) from [] (mmc_rescan+0x28c/0x498)
[999388.954735] [] (mmc_rescan) from [] (process_one_work+0x130/0x3a0)
[999388.954756] [] (process_one_work) from [] (worker_thread+0x34/0x530)
[999388.954776] [] (worker_thread) from [] (kthread+0x11c/0x158)
[999388.954793] [] (kthread) from [] (ret_from_fork+0x14/0x28)
[999388.954802] Exception stack(0xda781fb0 to 0xda781ff8)
[999388.954811] 1fa0: 00000000 00000000 00000000 00000000
[999388.954821] 1fc0: 00000000 00000000 00000000 00000000 00000000 00000000 00000000 00000000
[999388.954831] 1fe0: 00000000 00000000 00000000 00000000 00000013 00000000
[999511.835464] INFO: task kworker/0:1:7766 blocked for more than 120 seconds.
[999511.835486] Tainted: G C 4.19.97+ #1294
[999511.835492] “echo 0 > /proc/sys/kernel/hung_task_timeout_secs” disables this message.
[999511.835501] kworker/0:1 D 0 7766 2 0x00000000
[999511.835550] Workqueue: events_freezable mmc_rescan
[999511.835601] [] (__schedule) from [] (schedule+0x50/0xa8)
[999511.835623] [] (schedule) from [] (__mmc_claim_host+0xbc/0x288)
[999511.835641] [] (__mmc_claim_host) from [] (mmc_get_card+0x38/0x3c)
[999511.835661] [] (mmc_get_card) from [] (mmc_sd_detect+0x24/0x7c)
[999511.835680] [] (mmc_sd_detect) from [] (mmc_rescan+0x28c/0x498)
[999511.835710] [] (mmc_rescan) from [] (process_one_work+0x130/0x3a0)
[999511.835730] [] (process_one_work) from [] (worker_thread+0x34/0x530)
[999511.835750] [] (worker_thread) from [] (kthread+0x11c/0x158)
[999511.835768] [] (kthread) from [] (ret_from_fork+0x14/0x28)
[999511.835778] Exception stack(0xda781fb0 to 0xda781ff8)
[999511.835787] 1fa0: 00000000 00000000 00000000 00000000
[999511.835799] 1fc0: 00000000 00000000 00000000 00000000 00000000 00000000 00000000 00000000
[999511.835808] 1fe0: 00000000 00000000 00000000 00000000 00000013 00000000
[999634.716626] INFO: task kworker/0:1:7766 blocked for more than 120 seconds.
[999634.716648] Tainted: G C 4.19.97+ #1294
[999634.716653] “echo 0 > /proc/sys/kernel/hung_task_timeout_secs” disables this message.
[999634.716662] kworker/0:1 D 0 7766 2 0x00000000
[999634.716708] Workqueue: events_freezable mmc_rescan
[999634.716761] [] (__schedule) from [] (schedule+0x50/0xa8)
[999634.716783] [] (schedule) from [] (__mmc_claim_host+0xbc/0x288)
[999634.716802] [] (__mmc_claim_host) from [] (mmc_get_card+0x38/0x3c)
[999634.716821] [] (mmc_get_card) from [] (mmc_sd_detect+0x24/0x7c)
[999634.716837] [] (mmc_sd_detect) from [] (mmc_rescan+0x28c/0x498)
[999634.716869] [] (mmc_rescan) from [] (process_one_work+0x130/0x3a0)
[999634.716890] [] (process_one_work) from [] (worker_thread+0x34/0x530)
[999634.716910] [] (worker_thread) from [] (kthread+0x11c/0x158)
[999634.716928] [] (kthread) from [] (ret_from_fork+0x14/0x28)
[999634.716936] Exception stack(0xda781fb0 to 0xda781ff8)
[999634.716945] 1fa0: 00000000 00000000 00000000 00000000
[999634.716956] 1fc0: 00000000 00000000 00000000 00000000 00000000 00000000 00000000 00000000
[999634.716965] 1fe0: 00000000 00000000 00000000 00000000 00000013 00000000
[1005216.427706] kthreadd invoked oom-killer: gfp_mask=0x7080c0(GFP_KERNEL_ACCOUNT|__GFP_ZERO), nodemask=(null), order=1, oom_score_adj=0
[1005216.427733] CPU: 0 PID: 2 Comm: kthreadd Tainted: G C 4.19.97+ #1294
[1005216.427739] Hardware name: BCM2835
[1005216.427790] [] (unwind_backtrace) from [] (show_stack+0x20/0x24)
[1005216.427817] [] (show_stack) from [] (dump_stack+0x20/0x28)
[1005216.427843] [] (dump_stack) from [] (dump_header+0x74/0x210)
[1005216.427861] [] (dump_header) from [] (oom_kill_process+0x2a0/0x2f0)
[1005216.427878] [] (oom_kill_process) from [] (out_of_memory+0x118/0x36c)
[1005216.427901] [] (out_of_memory) from [] (__alloc_pages_nodemask+0xd1c/0xea0)
[1005216.427931] [] (__alloc_pages_nodemask) from [] (copy_process.part.5+0x158/0x1858)
[1005216.427951] [] (copy_process.part.5) from [] (_do_fork+0xc4/0x3cc)
[1005216.427967] [] (_do_fork) from [] (kernel_thread+0x3c/0x44)
[1005216.427989] [] (kernel_thread) from [] (kthreadd+0xe4/0x150)
[1005216.428007] [] (kthreadd) from [] (ret_from_fork+0x14/0x28)
[1005216.428016] Exception stack(0xdacfbfb0 to 0xdacfbff8)
[1005216.428026] bfa0: 00000000 00000000 00000000 00000000
[1005216.428036] bfc0: 00000000 00000000 00000000 00000000 00000000 00000000 00000000 00000000
[1005216.428046] bfe0: 00000000 00000000 00000000 00000000 00000013 00000000
[1005216.428054] Mem-Info:
[1005216.428080] active_anon:85978 inactive_anon:4713 isolated_anon:0
active_file:269 inactive_file:424 isolated_file:18
unevictable:0 dirty:0 writeback:0 unstable:0
slab_reclaimable:3653 slab_unreclaimable:4431
mapped:360 shmem:6360 pagetables:974 bounce:0
free:5791 free_pcp:152 free_cma:1374
[1005216.428097] Node 0 active_anon:343912kB inactive_anon:18852kB active_file:1076kB inactive_file:1696kB unevictable:0kB isolated(anon):0kB isolated(file):72kB mapped:1440kB dirty:0kB writeback:0kB shmem:25440kB writeback_tmp:0kB unstable:0kB all_unreclaimable? no
[1005216.428119] Normal free:23164kB min:16384kB low:20480kB high:24576kB active_anon:343912kB inactive_anon:18852kB active_file:1076kB inactive_file:1696kB unevictable:0kB writepending:0kB present:458752kB managed:442820kB mlocked:0kB kernel_stack:1712kB pagetables:3896kB bounce:0kB free_pcp:608kB local_pcp:608kB free_cma:5496kB
[1005216.428123] lowmem_reserve[]: 0 0
[1005216.428135] Normal: 13094kB (MEHC) 6018kB (UMEHC) 5616kB (UMEHC) 5032kB (MEHC) 3064kB (UEC) 14128kB (UEC) 9256kB (UEHC) 5512kB (UHC) 21024kB (HC) 02048kB 0*4096kB = 23164kB
[1005216.428194] 7071 total pagecache pages
[1005216.428200] 0 pages in swap cache
[1005216.428207] Swap cache stats: add 0, delete 0, find 0/0
[1005216.428211] Free swap = 0kB
[1005216.428214] Total swap = 0kB
[1005216.428219] 114688 pages RAM
[1005216.428222] 0 pages HighMem/MovableOnly
[1005216.428225] 3983 pages reserved
[1005216.428229] 2048 pages cma reserved
[1005216.428233] Tasks state (memory values in pages):
[1005216.428237] [ pid ] uid tgid total_vm rss pgtables_bytes swapents oom_score_adj name
[1005216.428266] [ 74] 0 74 8046 326 57344 0 0 systemd-journal
[1005216.428279] [ 108] 0 108 4487 157 16384 0 -1000 systemd-udevd
[1005216.428291] [ 198] 0 198 1634 93 16384 0 0 rpcbind
[1005216.428303] [ 218] 65534 218 1239 53 12288 0 0 thd
[1005216.428313] [ 220] 0 220 3372 184 20480 0 0 systemd-logind
[1005216.428324] [ 221] 0 221 6271 236 22528 0 0 rsyslogd
[1005216.428334] [ 223] 104 223 1800 134 16384 0 -900 dbus-daemon
[1005216.428345] [ 225] 105 225 1635 126 16384 0 0 avahi-daemon
[1005216.428355] [ 228] 0 228 2070 55 16384 0 0 cron
[1005216.428365] [ 233] 0 233 2681 101 18432 0 0 wpa_supplicant
[1005216.428376] [ 267] 105 267 1602 73 14336 0 0 avahi-daemon
[1005216.428387] [ 338] 0 338 531 31 10240 0 0 hciattach
[1005216.428398] [ 339] 0 339 2448 97 16384 0 0 bluetoothd
[1005216.428408] [ 394] 0 394 780 170 10240 0 0 dhcpcd
[1005216.428419] [ 405] 0 405 231594 2366 79872 0 0 docker
[1005216.428430] [ 421] 0 421 5637 73 26624 0 0 nmbd
[1005216.428441] [ 435] 0 435 2728 149 18432 0 -1000 sshd
[1005216.428451] [ 441] 0 441 1160 33 12288 0 0 agetty
[1005216.428462] [ 529] 0 529 212482 390 36864 0 0 docker-containe
[1005216.428472] [ 727] 106 727 2178 146 16384 0 0 ntpd
[1005216.428482] [ 828] 0 828 210332 428 43008 0 0 exe
[1005216.428492] [ 853] 0 853 210332 375 45056 0 0 exe
[1005216.428502] [ 860] 0 860 210332 377 49152 0 0 exe
[1005216.428512] [ 867] 0 867 210332 384 43008 0 0 exe
[1005216.428522] [ 874] 0 874 210332 385 43008 0 0 exe
[1005216.428532] [ 893] 0 893 210332 383 40960 0 0 exe
[1005216.428543] [ 900] 0 900 210332 385 49152 0 0 exe
[1005216.428553] [ 907] 0 907 210332 376 49152 0 0 exe
[1005216.428564] [ 914] 0 914 210332 383 43008 0 0 exe
[1005216.428574] [ 921] 0 921 210332 383 40960 0 0 exe
[1005216.428584] [ 928] 0 928 210332 391 49152 0 0 exe
[1005216.428595] [ 935] 0 935 210332 391 40960 0 0 exe
[1005216.428605] [ 942] 0 942 210332 380 49152 0 0 exe
[1005216.428615] [ 949] 0 949 210332 376 49152 0 0 exe
[1005216.428625] [ 954] 0 954 211073 143 22528 0 0 docker-containe
[1005216.428635] [ 967] 0 967 419 9 6144 0 0 sh
[1005216.428645] [ 1001] 0 1001 1758 127 12288 0 0 nginx
[1005216.428657] [ 1003] 0 1003 864 44 8192 0 0 vsftpd
[1005216.428667] [ 1004] 0 1004 4317 2304 24576 0 0 gunicorn
[1005216.428678] [ 1005] 100 1005 1828 197 12288 0 0 nginx
[1005216.428689] [ 1034] 0 1034 2592 88 16384 0 0 sudo
[1005216.428700] [ 1044] 0 1044 5862 2300 30720 0 0 python
[1005216.428710] [ 1111] 112 1111 1644 73 12288 0 0 gpsd
[1005216.428721] [ 1197] 0 1197 6277 3793 34816 0 0 gunicorn
[1005216.428732] [ 1200] 0 1200 6277 3791 34816 0 0 gunicorn
[1005216.428742] [ 1695] 0 1695 212381 467 45056 0 0 exe
[1005216.428752] [ 1712] 0 1712 211073 152 30720 0 0 docker-containe
[1005216.428763] [ 1724] 0 1724 1280 63 12288 0 0 entry.sh
[1005216.428773] [ 1764] 0 1764 453 16 10240 0 0 sh
[1005216.428785] [ 1765] 0 1765 1356 139 12288 0 0 rsh-data-produc
[1005216.428795] [ 1968] 0 1968 210332 376 49152 0 0 exe
[1005216.428807] [ 2050] 0 2050 211073 160 26624 0 0 docker-containe
[1005216.428817] [ 2078] 0 2078 1281 64 10240 0 0 entry.sh
[1005216.428827] [ 2238] 0 2238 453 16 8192 0 0 sh
[1005216.428838] [ 2244] 0 2244 1346 129 12288 0 0 rsh-data-consum
[1005216.428998] [ 3412] 0 3412 1434 217 12288 0 0 purge_datafiles
[1005216.429014] [ 3424] 0 3424 1268 51 12288 0 0 purge_datafiles
[1005216.429025] [ 3453] 0 3453 1380 100 12288 0 0 seedlink
[1005216.429037] [ 3462] 0 3462 785 27 8192 0 0 run_with_lock
[1005216.429047] [ 3465] 0 3465 439 17 10240 0 0 slarchive
[1005216.429060] [ 3467] 0 3467 15237 651 30720 0 0 odf_SL_plugin
[1005216.429071] [ 22240] 0 22240 71032 59951 278528 0 0 ows
[1005216.429081] [ 21957] 0 21957 854 16 10240 0 0 sleep
[1005216.429094] [ 8621] 0 8621 2389 79 16384 0 0 cron
[1005216.429105] [ 8623] 0 8623 1346 129 12288 0 0 rsh-data-consum
[1005216.429115] [ 8625] 0 8625 2399 82 16384 0 0 cron
[1005216.429126] [ 8628] 0 8628 1116 63 10240 0 0 modprobe
[1005216.429137] [ 8630] 0 8630 2399 80 16384 0 0 cron
[1005216.429143] Out of memory: Kill process 22240 (ows) score 542 or sacrifice child
[1005216.429200] Killed process 22240 (ows) total-vm:284128kB, anon-rss:239584kB, file-rss:220kB, shmem-rss:0kB
[1005216.698523] oom_reaper: reaped process 22240 (ows), now anon-rss:0kB, file-rss:0kB, shmem-rss:0kB
[1005218.254702] systemd[1]: systemd-journald.service: Main process exited, code=killed, status=6/ABRT
[1005218.280010] systemd[1]: systemd-journald.service: Failed with result ‘watchdog’.
[1005218.349460] systemd[1]: systemd-journald.service: Service has no hold-off time (RestartSec=0), scheduling restart.
[1005218.350346] systemd[1]: systemd-journald.service: Scheduled restart job, restart counter is at 1.
[1005218.398959] systemd[1]: systemd-journal-flush.service: Succeeded.
[1005218.401213] systemd[1]: Stopped Flush Journal to Persistent Storage.
[1005218.427110] systemd[1]: Stopping Flush Journal to Persistent Storage…
[1005218.437901] systemd[1]: Stopped Journal Service.
[1005218.443467] systemd[1]: Condition check resulted in Journal Audit Socket being skipped.
[1005218.606266] systemd[1]: Starting Journal Service…
[1005221.575086] systemd-journald[8652]: File /run/log/journal/fe1d4a4d0ac7441e817d011e70da2471/system.journal corrupted or uncleanly shut down, renaming and replacing.

hi john,

that would appear to be the case, but i would like to see your log files to confirm, when that’s possible.

if it is still working after “fixing itself”, can you send along the log files?

thanks in advance,

richard

Ok. I did also manually reboot the device from the web page last night, after noticing the gap earlier.RSH.R79D5.2020-04-26T14_04_30.logs.tar (1.2 MB)