I was wondering if the Boom registered changes in atmospheric pressure, so I took 10-min medians and compared with pressure from the weather station mounted alongside the boom. I found no real correlation with pressure. However, the signal had a strong diurnal effect, which turned out to be the inverse of the air temperature. The results are presented here:
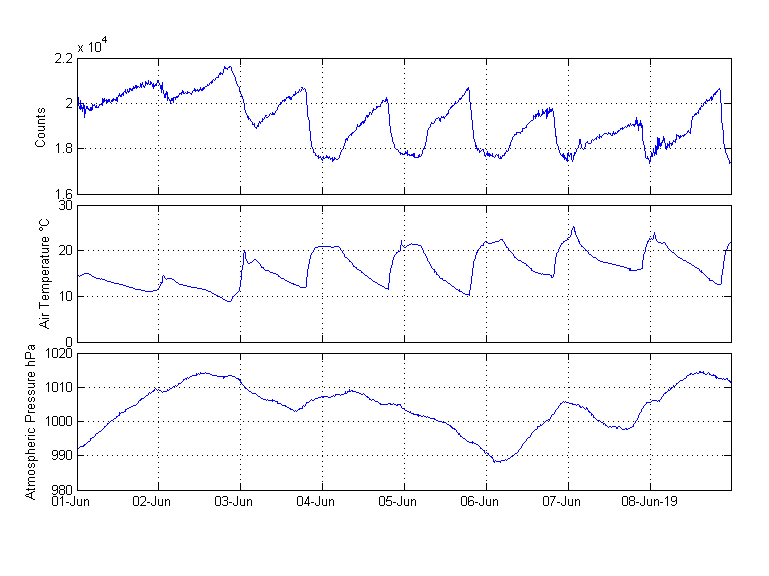
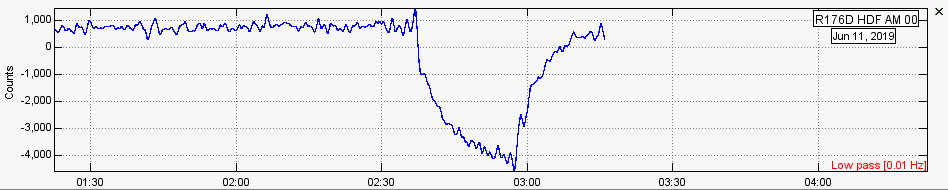
The upper panel shows 10-min median Boom counts - taking medians instead of means reduces/eliminates the effect of spikes.
The middle panel shows air temperature. We were away on the first two days, so the range is low, but on succeeding days, you can see the effect of the aircon (its Southern Hemisphere winter right now). We are UTC + 12, so temperature peaks occur just after midnight UTC (i.e., noon UTC+12).
The bottom panel shows atmospheric pressure. The large changes in pressure that occurred over the period do not appear to be reflected in the Boom signal. And this is reinforced in the plot below which compares Boom and pressure that have been low-pass filtered to remove diurnal effects.
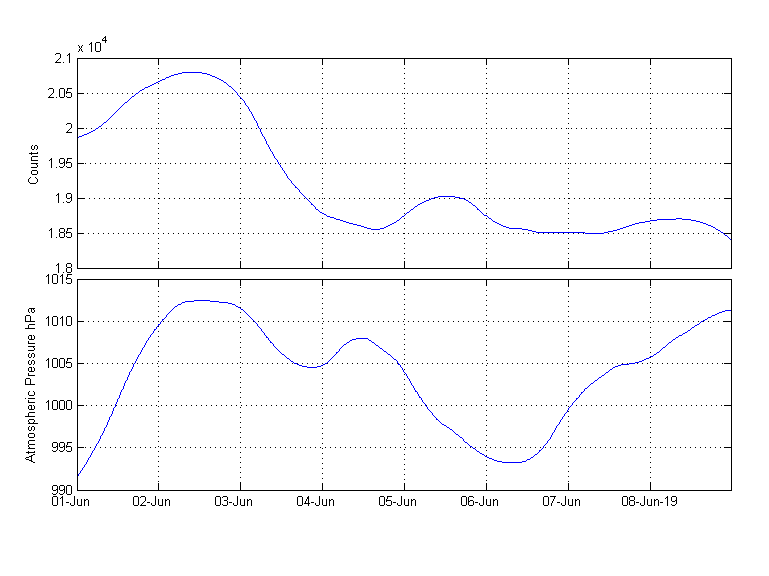
So, my conclusion is that the RBoom shows no significant response to changes in atmospheric pressure, but has a strong inverse correlation with changes in temperature.
At present my Boom is located under my desk, but when the ethernet switch arrives I’ll be moving it to be alongside my RShake in a cupboard in the spare bedroom where the temperature will be more even.