Rate My Seismogram

Hello,

I’m nearing completion of the vault for my Shake (S8B94) and am to the point where the Shake is in place and recording data. I have a few more ancillary things to finish to call it complete…

Anyway, I am curious to know from those more experienced in reading the data what they think of what my Shake is outputting.

I’m having some trouble teasing out if I’m seeing an earthquake not. Even a 3.5 off the coast of Oregon, 414km away, does not seem completely obvious to me… Wondering if I am have excessive noise, misaligned expectations, or lacking some skill/knowledge.

I did watch the recent webinar, which was helpful but still can’t point and say for sure “oh, that’s definitely a quake…”

Here are some random samples (no filter applied):

This first one shows a fairly constant 40Hz signal on the spectrogram. Looking back, I found that it had been present for sometime, but seems to have disappeared after my last round of work on the vault, which was just cleaning some (Ethernet) cabling up and plugging the conduit coming into the vault with duct seal (to keep out any potential drafts from the the surface):

These next two are just ones I grabbed at random, but were after the last bit of work when the 40Hz signal went away:

Here is a snippet (local filter applied) of a 3.5 off the coast of OR (11-23-2024, 15:29:49), 414km away from my Shake. The S and P wave are based on the where the ShakeNet app marked them…

Thanks

Adam

1 Like

Hello Adam,

First, thank you for your webinar feedback! We’re always eager to hear how such events go and what we can do to improve.

Onto your data:

  1. Yes, that’s something local that clearly went away as you continued to work on the vault. Good job!
  1. & 3. Some low frequency signal in the second random screenshot, but difficult to say what it is. And very good spectra in the third
  1. Yes, I can see the P wave arrival (even if it appears weak).

As there are many possible factors that contribute to seismic signal detection (installation position, location, type of material upon which the Shake is positioned, soil type and density, depth to bedrock, structural footing and attachment to bedrock, bedrock type, and more), you will start to notice what you can effectively detect (in terms of magnitude vs distance) as time goes on and you “eye” gets trained more and more.

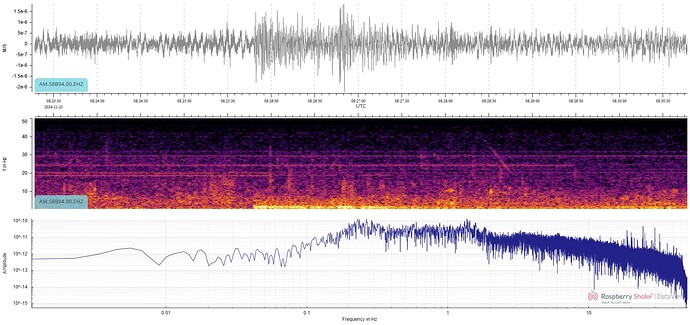
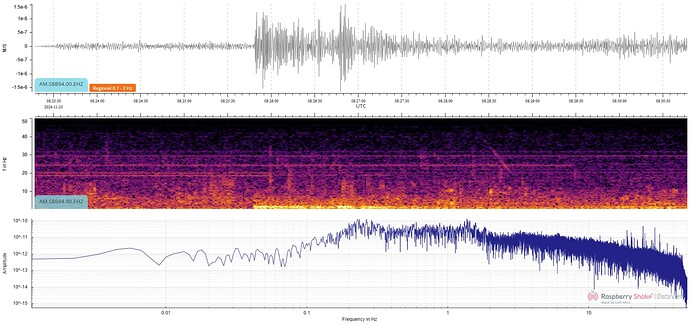
For example, your Shake perfectly captured the M4.6 around 500km away this morning, which can be noticed even in unfiltered data, but emerges with no issue when a Regional filter is applied:

It can also be appreciated in the low frequencies, as shown in the spectrogram below the trace plot.

3 Likes

Thanks for your insight, glad to know things are working ok and I just need to train my eye better :slight_smile:. We’re in the rainy season here in OR, be interesting to see what the difference is in the dry months.

2 Likes