Has anyone had any luck generating helicorder plots using drumplot in Gismo?
I’ve been going through the tutorials at https://github.com/geoscience-community-codes/GISMO/wiki/Tutorials with data from my RS and get:
Index exceeds the number of array elements (0).
Error in drumplot/plot (line 100)
w(1)
Error in waveform/plot_helicorder (line 10)
plot(drumobj0);
Other than that, Gismo is working fine so far.
Thanks!
Kevin
Hi Kevin—first, a disclaimer. Although I “come from an academic background,” I know very little about MATLAB like others in academia do, for one reason: when I was learning to code, Python was free for me and MATLAB wasn’t. Therefore I am not the best person to be answering this question. However since others have not yet responded, I do have a couple of recommendations based on experience with other software:
- Test whether other parts of GISMO work with the data (if so, perhaps the problem is with drumplot itself)
- Try using a converter from obspy to MATLAB object as is discussed here (perhaps there is a problem with GISMO reading MSEED—our files are created through libmseed, which is the industry standard)
- Check to see whether other MSEED data (from IRIS, for example) works with drumplot
- Have other MATLAB folks try to reproduce the issue (@jpulli, @TideMan)
- If nothing else, file a bug report with GISMO that mentions the results from 1-3 to get an answer from the experts themselves
Thanks Ian! Other parts of GISMO do seem to work, I’m only having issues with drumplot. I downloaded MSEED data from IRIS and drumplot isn’t working on that either so I suspect it is a GISMO issue. I requested assess to GISMO’s user group and will pursue there. I’ll follow up here with what I learn.
Cheers!
Kevin
1 Like
I found an issue in plot.m for drumplot. Evidently there are some debug lines that are causing the program to fail. Commenting out lines 100 and 101 will fix this. The correct version of GISMO may not be what is served up by GitHub. Investigations continue…
Did you download directly from github? The latest version may not always be stable. Maybe this version is better: http://geoscience-community-codes.github.io/GISMO/
Would love to see some drumplots if you manage to get it working.
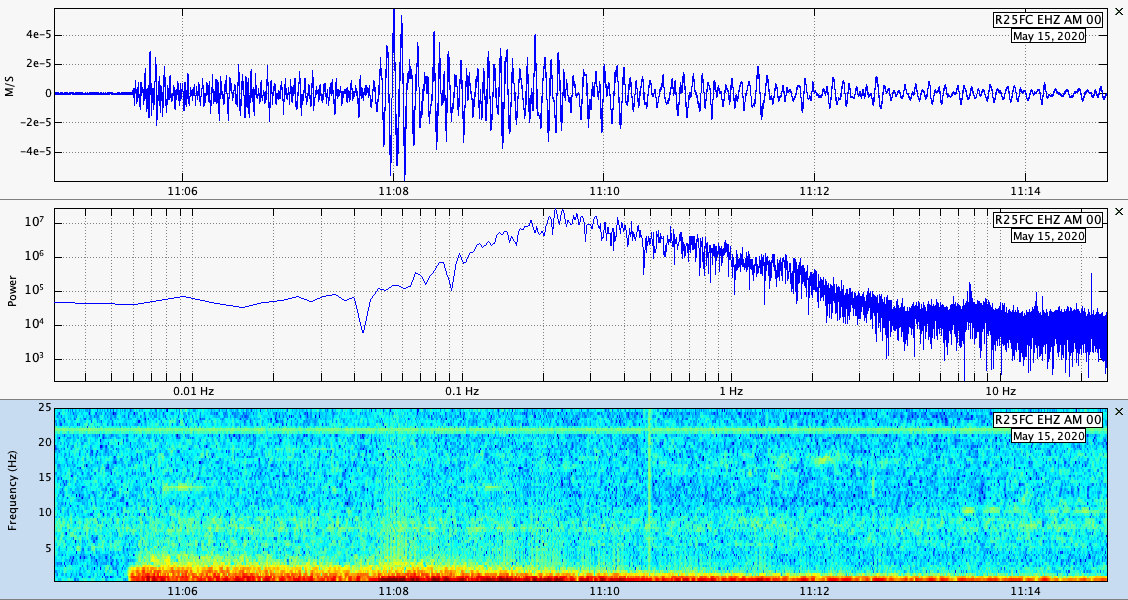
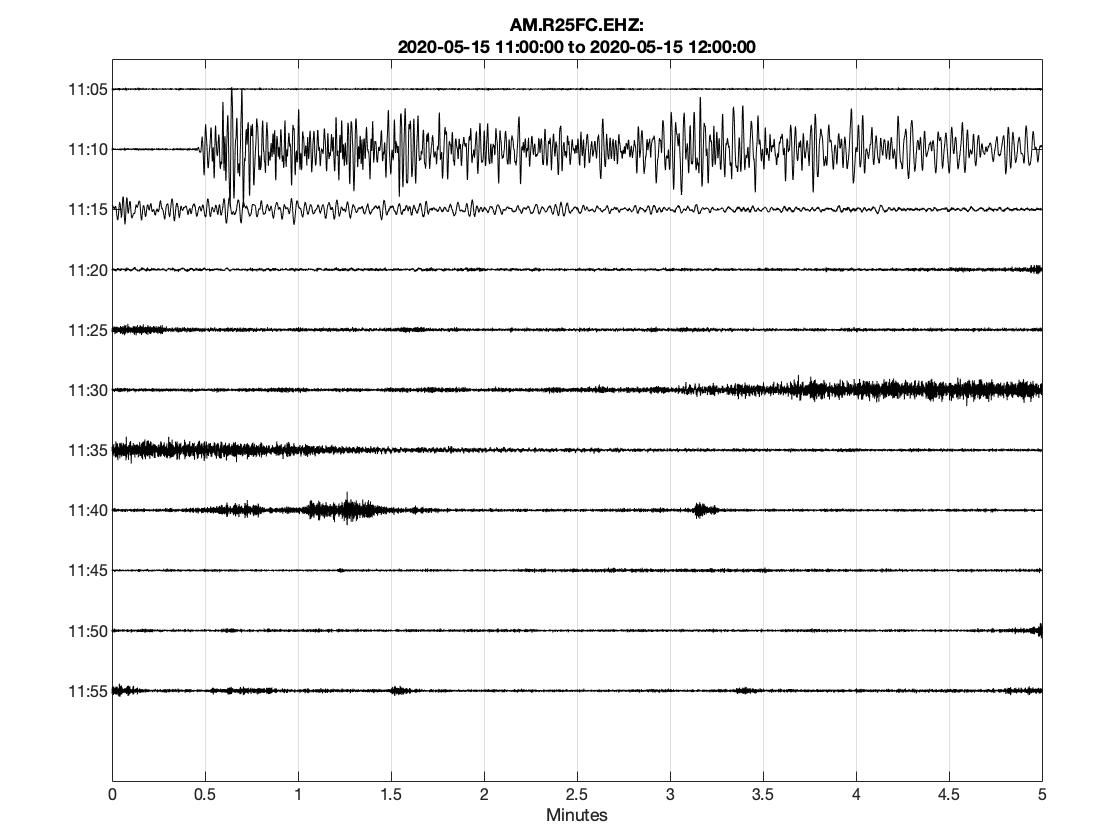
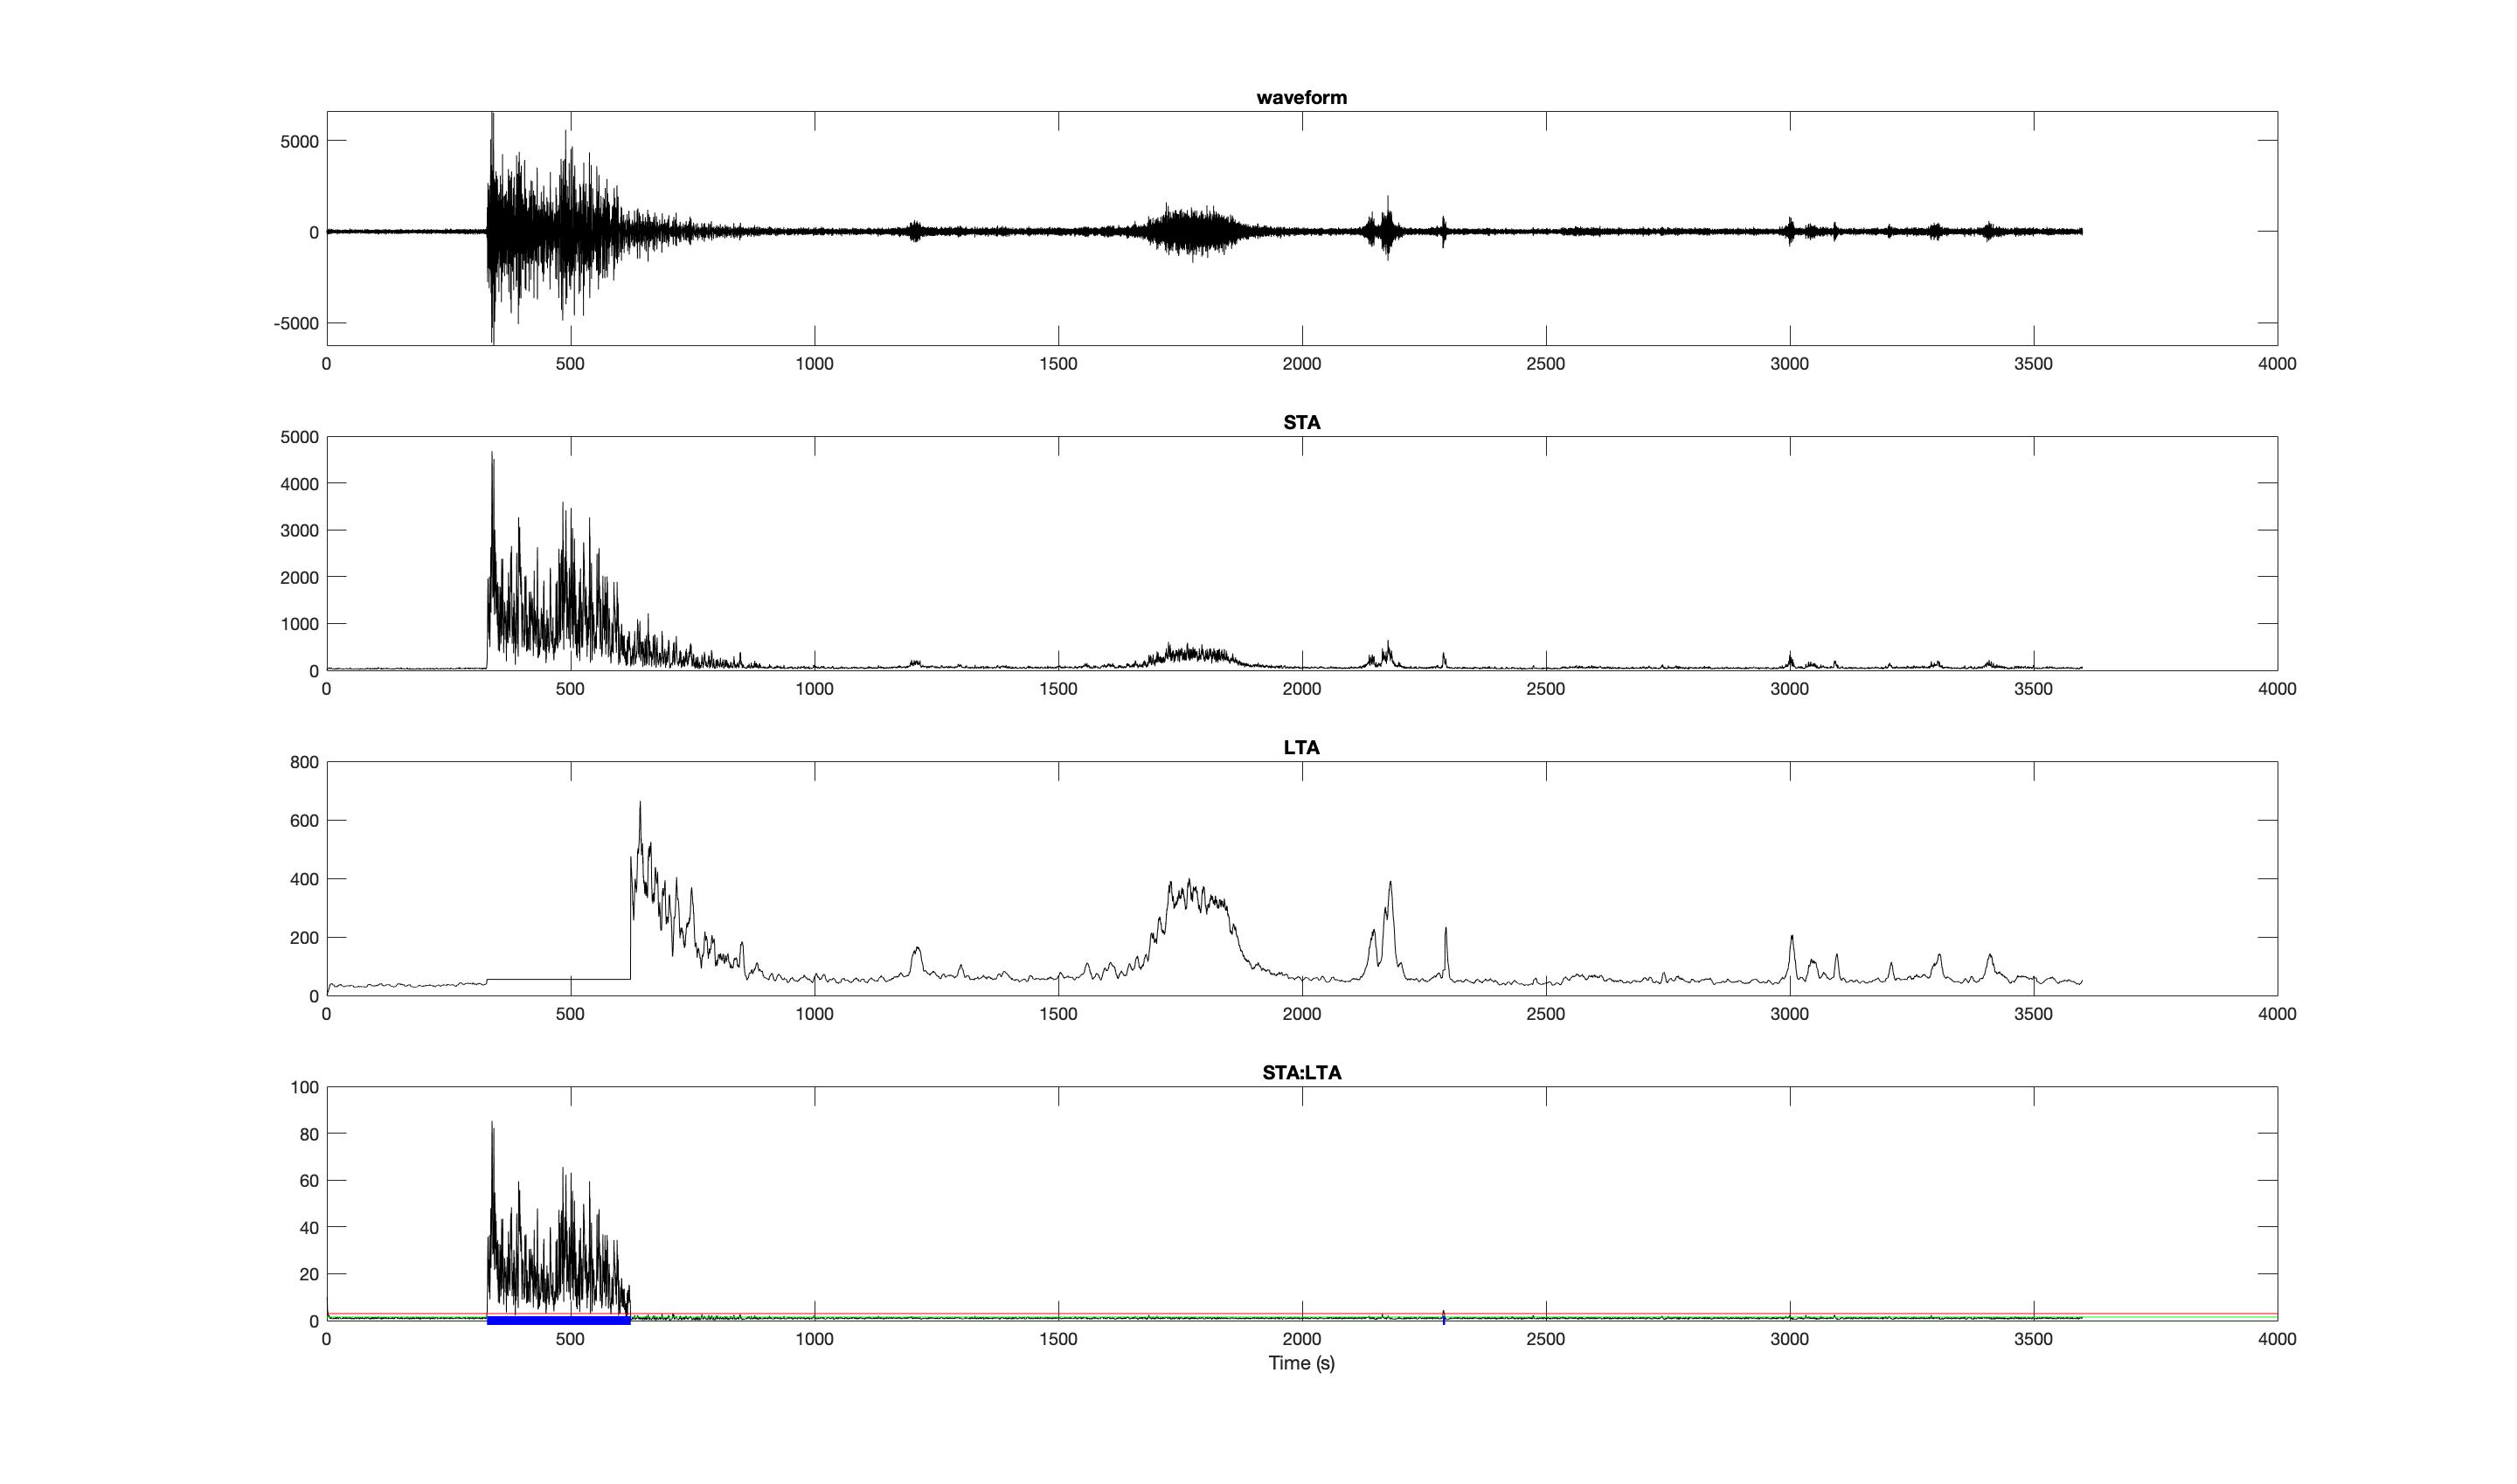
Yes directly from Github. Attached are the Matlab plots from my RS from the 5.15.2020 Nevada earthquake. Also attached is plot of the same data from Swarm. There are differences that I’m trying to understand but that is fun!
1 Like
My guess is that the differences are due to Swarm’s automatic instrument response removal (units are m/s instead of counts). I’m not sure how to do a response removal in GISMO but I imagine when you do that, the waveform will look much more similar.
@kbwidener if you have any ideas for how we could more closely integrate the RS with GISMO, we would be interested. For example, we saw an opportunity to make it easier for users to pull Raspberry Shake data into ObsPy just by listing the datacenter under their URL_MAPPINGS: https://docs.obspy.org/packages/obspy.clients.fdsn.html. Pulling RS data into ObsPy has never been easier.
branden
Hi Branden,
I’m probably don’t have much to add about GISMO. I’m a retired electrical engineer that used MATLAB a lot and wanted to compare my RS to a local U of Washington seismometer. I thought I would be writing filters and detection algorithms but then found GISMO already did this. Now Rsudp also does this for RS! I’ll also start looking at ObsPy. Thanks!
2 Likes