I have posted some RB/RS recordings of this before. But recently have been looking at the sound wave close-up and wonder if my RB connections are “upside down” ? The typical sound wave from a quarry explosion at ~10 km distance looks like this:
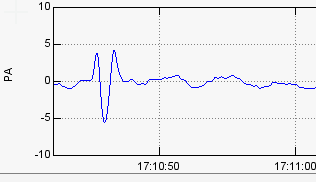
The peak amplitude is usually strongest in the negative direction although the initial direction is positive. Area under the + and - curves seems to add to zero, as you would expect. This sort of wave seems not to be of much interest in literature since it cannot be heard and does not do any damage.
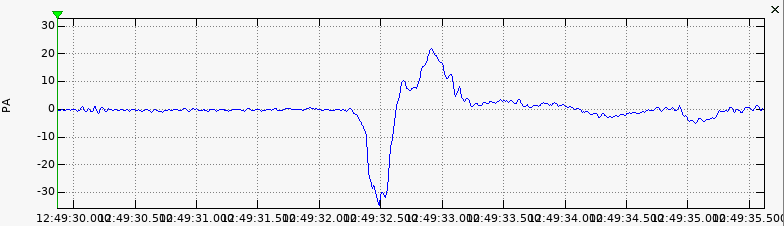
Although all RBoom connections are made on the Shake/Boom board itself, the easiest way to test the polarity is to put it in a room and open or close the door to that room. Here is a Boom at our office recording a door opening. The initial pressure change is negative, followed by a positive as air rushes in to fill the depressurized space.
With respect to the quarry blast: I think the polarity is correct. The first phase is positive as the explosion sends material outward, then negative as air rushes in to fill the rarefaction, and positive again as it rebounds outwards again. Why the third phase is more strongly positive than the first I do not know, but 10 km can do a lot to modify a pressure wave in air, depending on the terrain.
OK - one vote for it being correct. Sometimes the first + wave is bigger. But the “rarification” phase is always the biggest magnitude.
 .
.
I am hoping for a technical reference explaining why that is.
1 Like
It looks like the band-pass filter response to the acoustic N wave. Notice the positive swing at the end. The total integral of the waveform is zero – since the air actually was not actually displaced by the pressure disturbance,
1 Like
Thanks for the comment.
Yes I had the same thought. So I tried turning the bandpass filter on and off, but there but there was no change in the fundamental shape. Just more noise on the baseline and sometimes a little more detail to the shape.
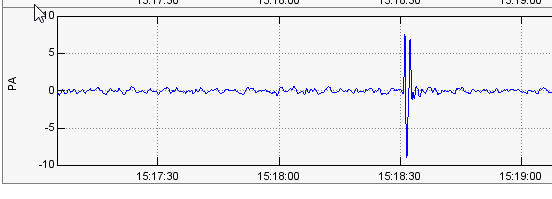
Here is a recent one - not very spectacular - but showing the effect of the bandpass filter. It is zoomed in a more than the first posting.
I have a theory that a blast at the bottom of a quarry shoots an air column upwards and that creates a suction effect, giving a substantial negative pressure wave. Then, as you say, the total area under the curves must add up to zero so there is another positive wave.
1 Like
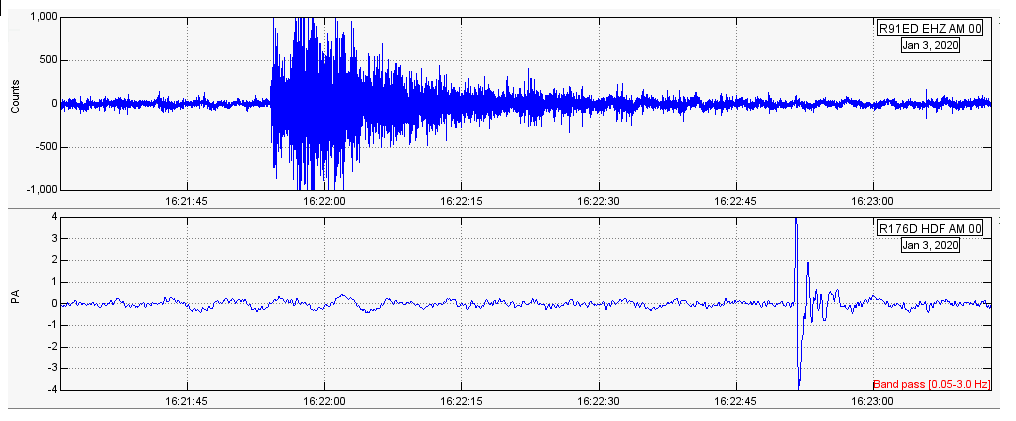
While on the topic, if you have both RS and RB, you can easily determine the range (distance) to the blast, considering the seismic P-wave travels at 5 miles/second and the sound wave at 5 seconds/mile (approximately - or 8 and 3 if you are metric).
Here is a quarry blast at about 13 miles (~20 km).
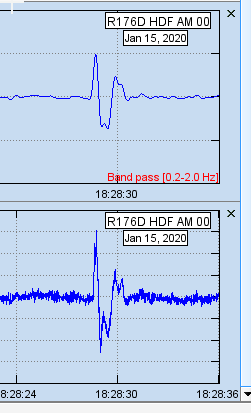
If you have only the RS and you get a good clean wave, you can also determine the range from a P wave and something similar to the S wave. This trailing low frequency pulse is a classic indication of an underground blast. Here is the same seismic wave with high and low frequencies separated out:
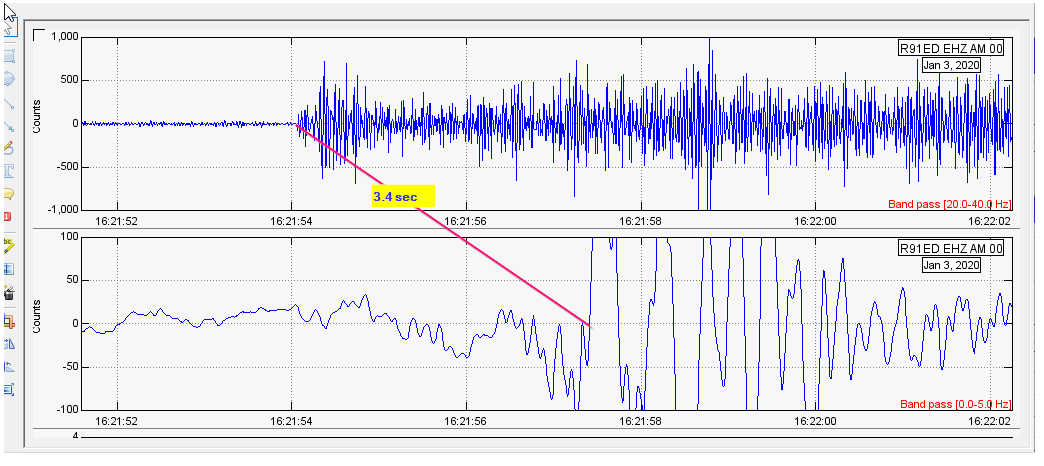
From this I am able to conclude that multiplying the time between the two waves by 3.8 miles (or 6.1 km)/second will give the range from my location (your mileage may differ depending on local geology).
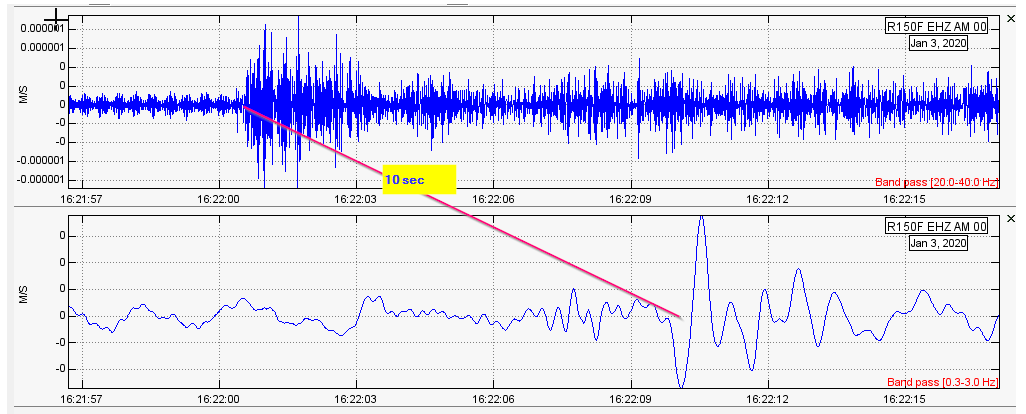
Here is the very same blast as seen by my neighbor who is 38 mies from the same quarry:
cheers
Ken
2 Likes
Love these images Ken!