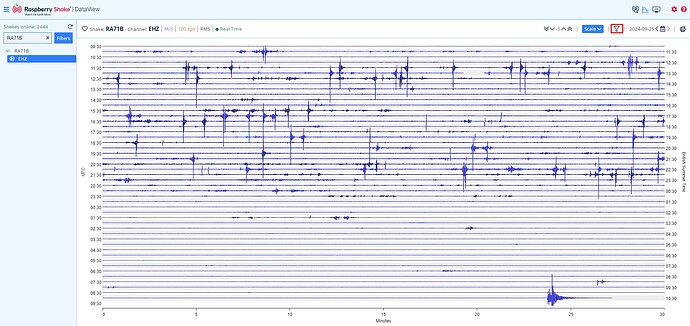
Hello Jorgegasi, and welcome to the community!
First, thank you for the logs. I can confirm your Shake is in perfect condition and working as expected.
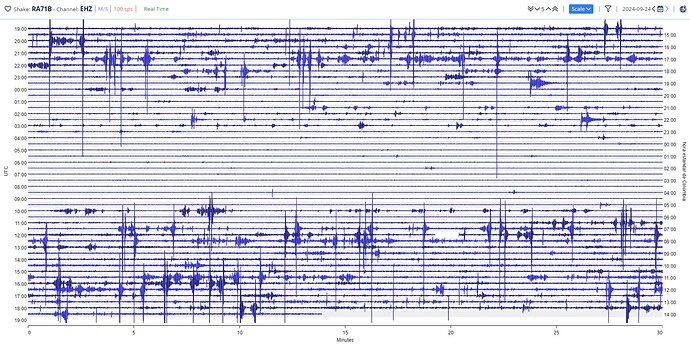
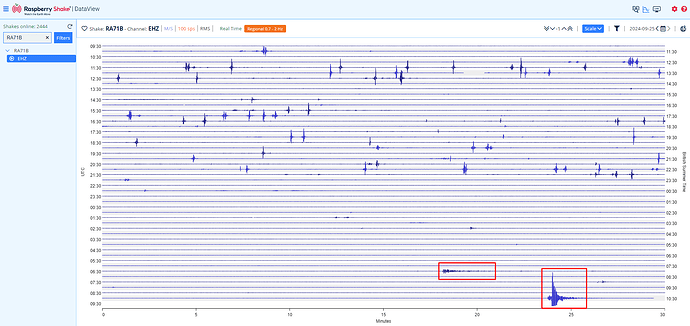
Regarding the noise you have noticed, I can see it in the second picture you posted:
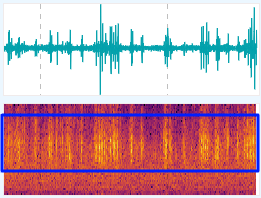
I highlighted the portion showing the most prominent signal, which appears to cover all others. As all our Raspberry Shakes come factory-calibrated (to guarantee the highest level of accuracy), it’s not possible to change the gain of the instrument.
To address the situation, you can do two things. The first is (if you haven’t already) to “explore” your Shake location and try to find the quietest spot. I had the same noise issue in my home, and after some trial and error, I managed to set up the Shake in a good place, which helped me lower my overall noise levels.
However, if this is not possible, or if your Shake is already in the quietest spot, you can then use filters to help you “remove” the noise.
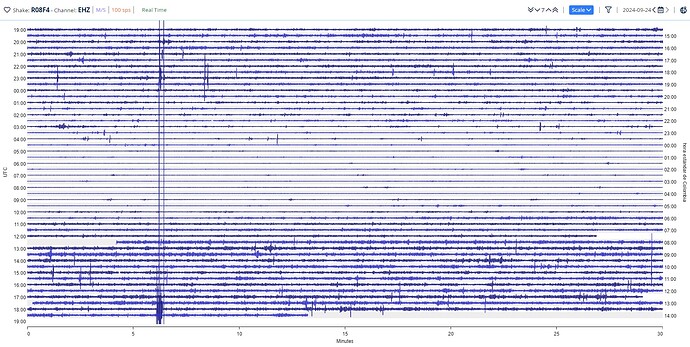
For example, if we use the same picture above, you can see that the area below the blue box is very clean, so we can use a “Regional Filter” from this menú here:
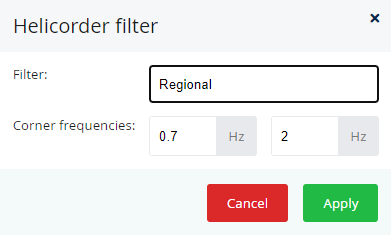
That will transform your helicorder view into this!
As you can see, most of the noise has disappeared, and only some peaks remain (and you got quite a nice couple of earthquakes this UTC morning).
You can play with the filters to see what values (using the “Custom” option) are best for your location and use them to find possible “hidden” earthquakes that would not be immediately noticeable due to local noise.
You can then refine and remove the peaks on DataView using the “Clip” option:

However, be aware that this could also remove the high peaks from very local events, so, again, experiment and see what values are best for you! I recommend (if you haven’t already done it) to check the DataView interactive guide reachable with this button

that will show you all that’s possible to do with this powerful web tool.
If you have any other questions, I remain available.
