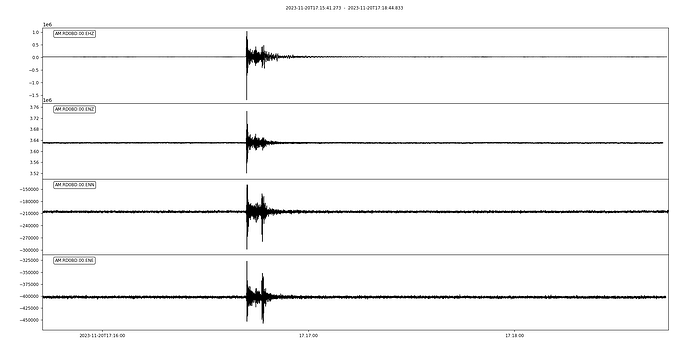
I’ve downloaded a mseed file of a mild earthquake, as the plot shows below.
how to design a properly filter to this mseed.
I’ve tried a highpass filter use
tr_filt.filter(‘highpass’, freq=40.0, corners=2, zerophase=True)
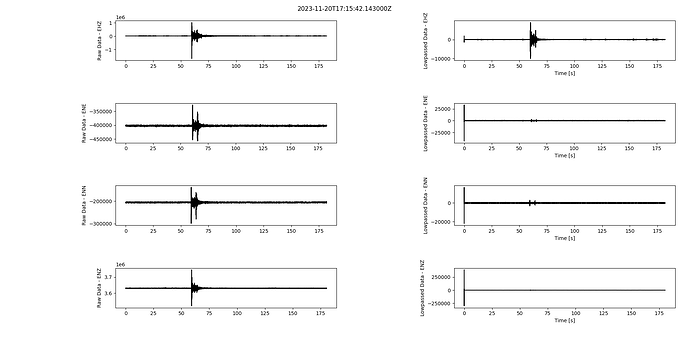
the result shows below
Why they have peak and valley at time = 0 sec ?
1 Like
Hello Yang-Rui-Jia,
If I remember correctly, the initial transient spike you are observing is due to the impulse response of the filter itself. You are practically observing the output of the filter you have applied before it converges to the signal it has to filter, creating this spurious (and erroneous) spike.
To solve it, you can either plot the signal starting just after the spike transient ends (in your case, I think that delaying the start to the plot to 1.5 or 2 seconds -instead of 0- should be enough) so that you extract only the relevant signal portion, or you can try to set up the filter in a way that minimizes/disables the initial spike transient.
The second method, however, can be complex and time-consuming, so the first approach is preferred as all filters have a delay (and memory), so the initial output is not your signal yet and can be excluded.
OK. Thanks.
I’ll make the starttime at 1.5 or 2 seconds, and try the other method again sometime.
2 Likes
No problem at all.
For anything else, we remain available.

