I can’t speak to Obspy, but that does look familiar from my experiments writing code to detect events.
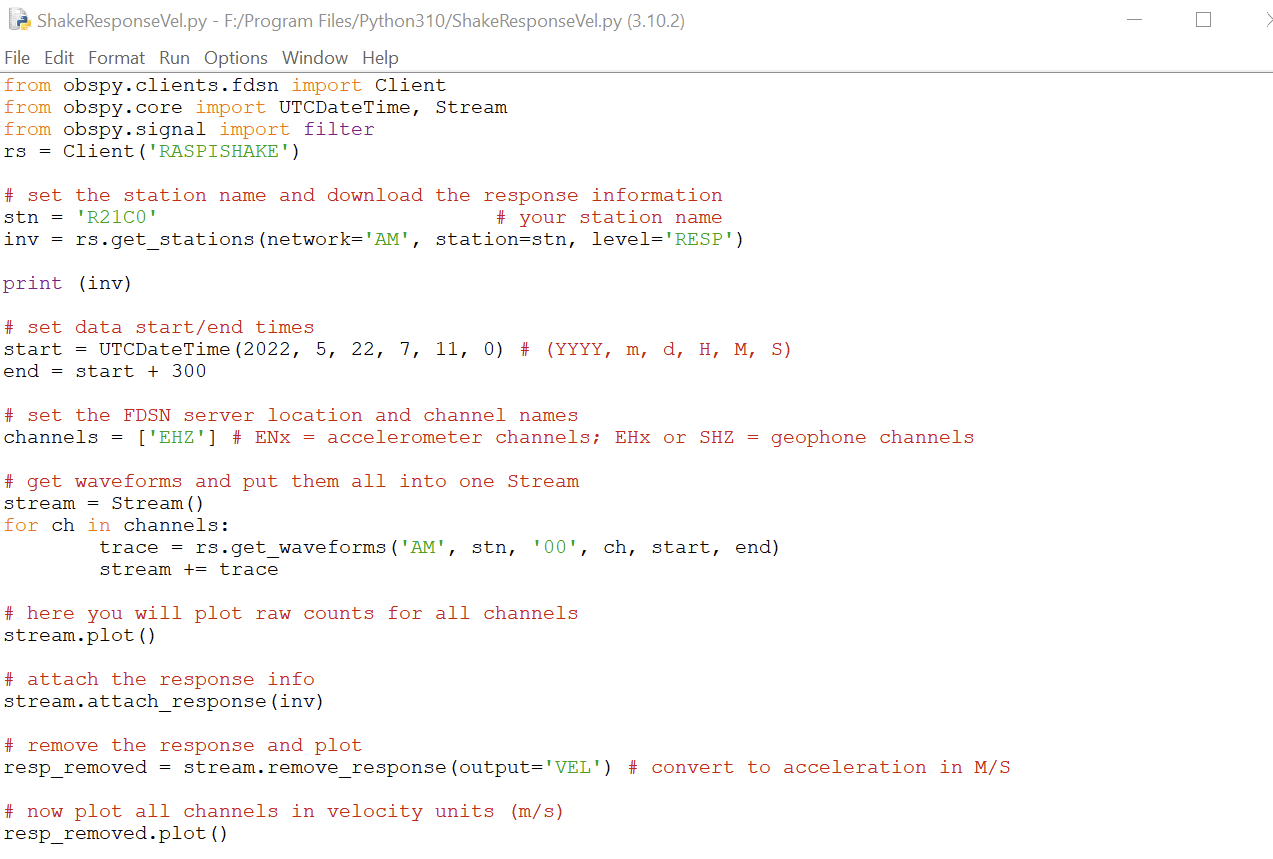
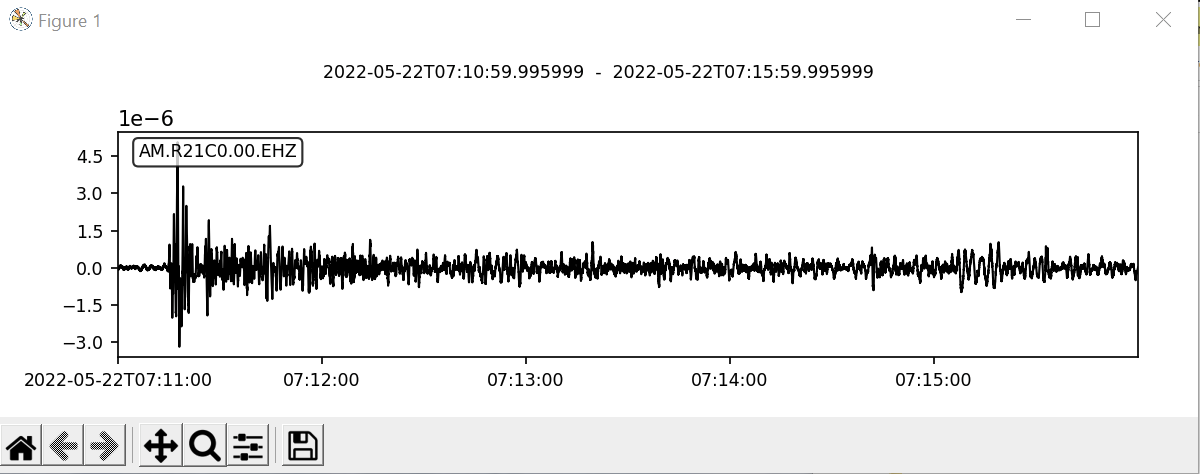
The raw data looks like this:
{'EHZ', 1654182923.653, 16636, 16720, 16767, 16711, 16700, 16651, 16651, 16661, 16646, 16606, 16627, 16679, 16662, 16657, 16629, 16637, 16634, 16646, 16672, 16674, 16694, 16698, 16738, 16772, 16774}

{'EHZ', 1654182923.903, 16775, 16766, 16741, 16751, 16734, 16718, 16684, 16640, 16639, 16699, 16754, 16682, 16601, 16543, 16611, 16663, 16632, 16657, 16642, 16636, 16669, 16653, 16639, 16697, 16709}

{'EHZ', 1654182924.153, 16691, 16670, 16680, 16669, 16651, 16707, 16684, 16696, 16668, 16664, 16663, 16658, 16698, 16664, 16719, 16702, 16686, 16620, 16517, 16545, 16575, 16623, 16638, 16596, 16627}

{'EHZ', 1654182924.403, 16682, 16644, 16659, 16662, 16698, 16707, 16698, 16782, 16727, 16716, 16671, 16614, 16651, 16633, 16674, 16692, 16749, 16745, 16669, 16656, 16610, 16579, 16623, 16689, 16686}

{'EHZ', 1654182924.653, 16581, 16624, 16671, 16534, 16565, 16598, 16613, 16658, 16680, 16702, 16685, 16670, 16643, 16658, 16695, 16758, 16734, 16735, 16733, 16675, 16712, 16746, 16779, 16695, 16658}

{'EHZ', 1654182924.903, 16661, 16636, 16640, 16614, 16676, 16641, 16609, 16613, 16598, 16613, 16650, 16684, 16676, 16674, 16630, 16628, 16638, 16613, 16553, 16594, 16688, 16690, 16668, 16643, 16623}

{'EHZ', 1654182925.153, 16608, 16674, 16710, 16677, 16684, 16721, 16726, 16697, 16681, 16721, 16756, 16743, 16758, 16699, 16683, 16695, 16652, 16673, 16655, 16686, 16703, 16650, 16648, 16606, 16597}

{'EHZ', 1654182925.403, 16657, 16688, 16694, 16652, 16579, 16587, 16663, 16755, 16794, 16698, 16611, 16596, 16572, 16679, 16750, 16663, 16620, 16575, 16562, 16599, 16609, 16583, 16624, 16678, 16683}

{'EHZ', 1654182925.653, 16679, 16617, 16636, 16662, 16649, 16683, 16647, 16577, 16596, 16657, 16703, 16727, 16730, 16718, 16684, 16648, 16649, 16710, 16705, 16657, 16664, 16625, 16602, 16622, 16677}

{'EHZ', 1654182925.903, 16721, 16707, 16639, 16639, 16676, 16641, 16629, 16633, 16654, 16596, 16613, 16622, 16565, 16582, 16611, 16677, 16722, 16751, 16692, 16682, 16683, 16688, 16745, 16690, 16674}
You can see that it is centered around a value of ~16660. But not exactly, and over time the “center” value changes.
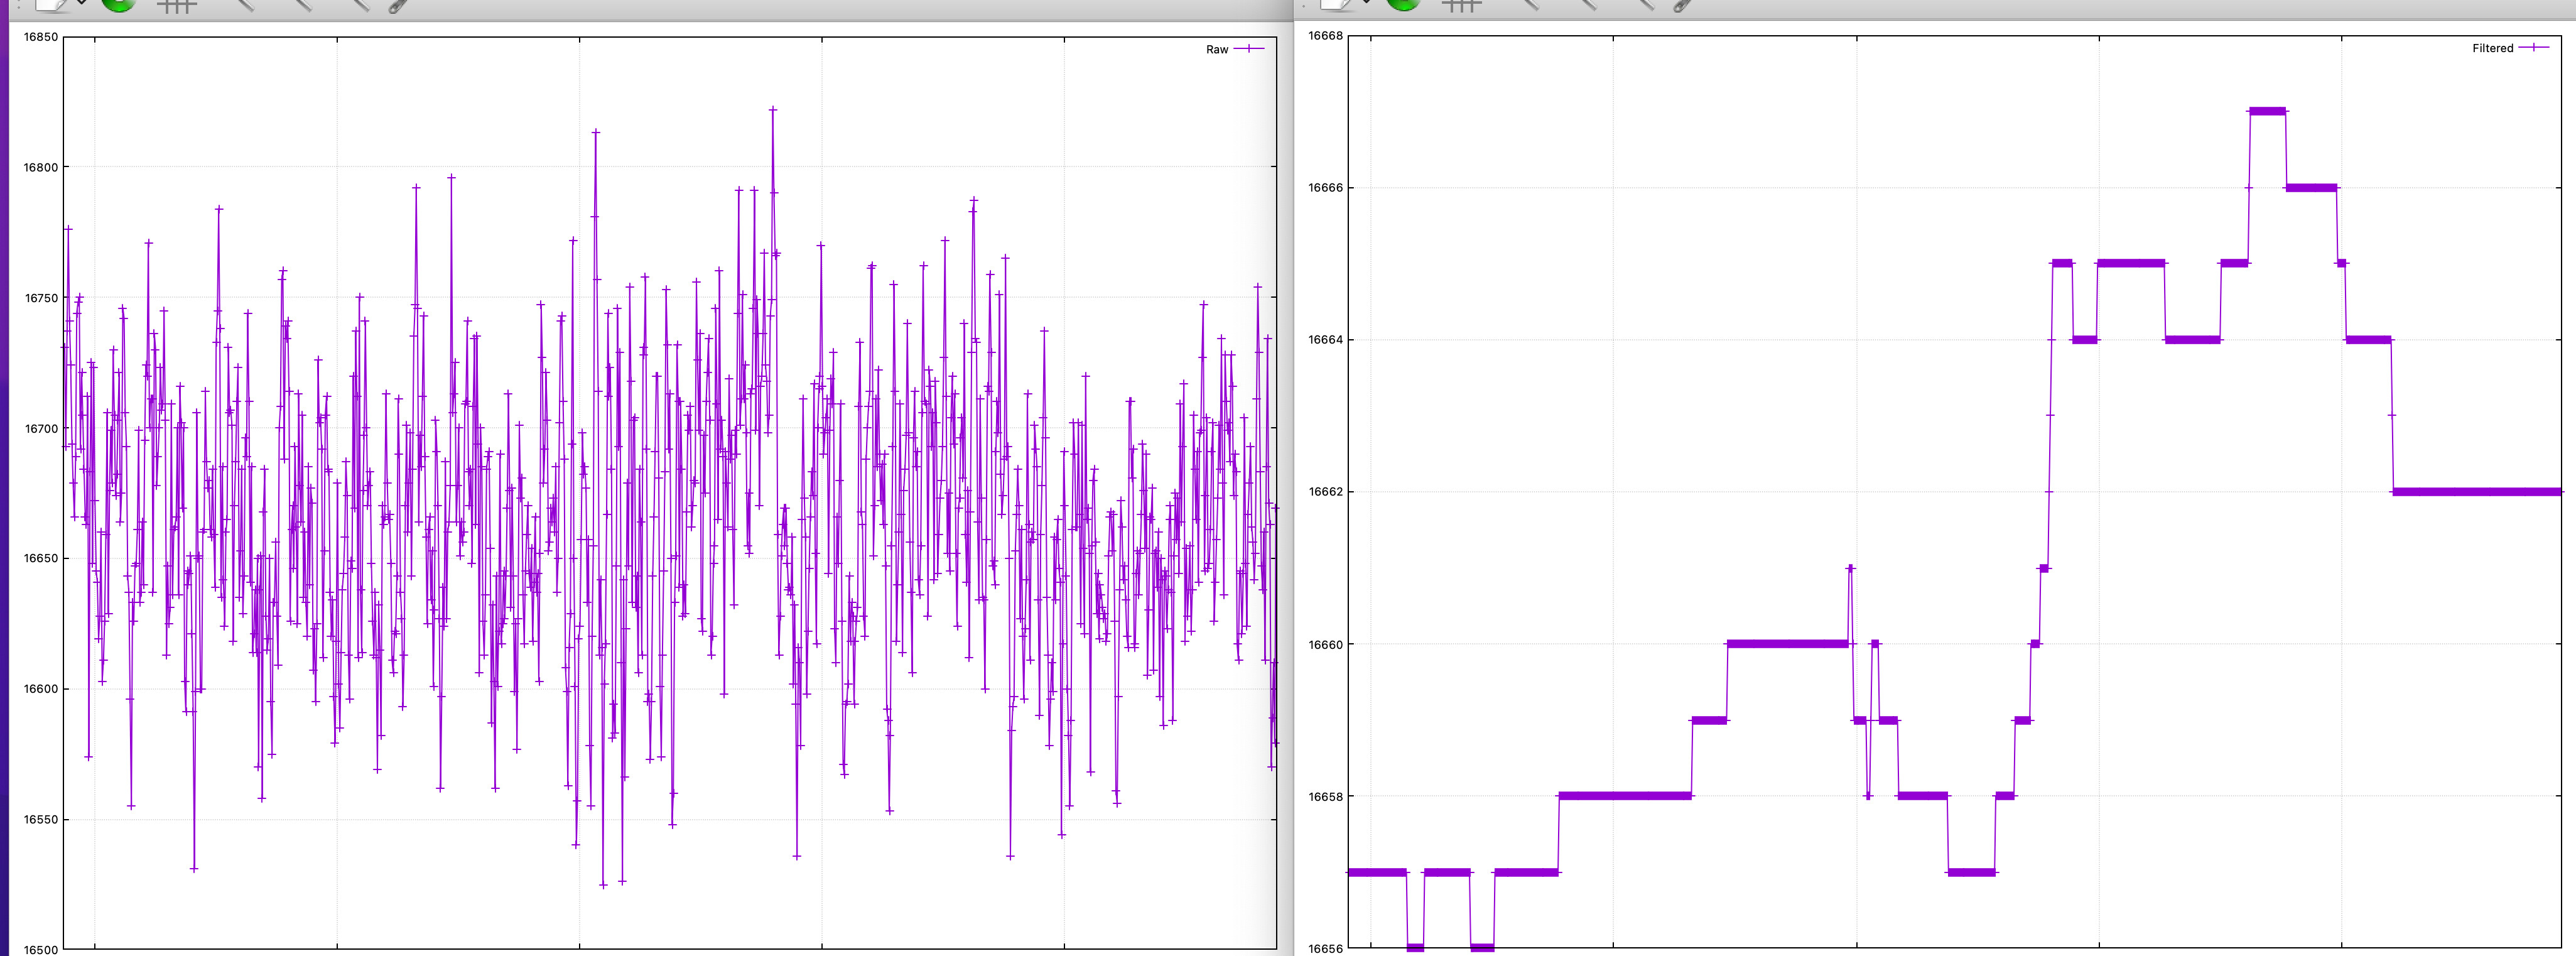
What I do, and what I think most others do, is to calculate a “running average” over a long period, or, if you wish to think of it that way, a (very) low-pass filter. That gives you a stable average and you plot incoming data as a delta from this (continuously updated) average.
If you don’t use enough samples in calculating the average, you get some residual “ripple” - which looks like what you are seeing.
I average the baseline over 250 data points (10 seconds).
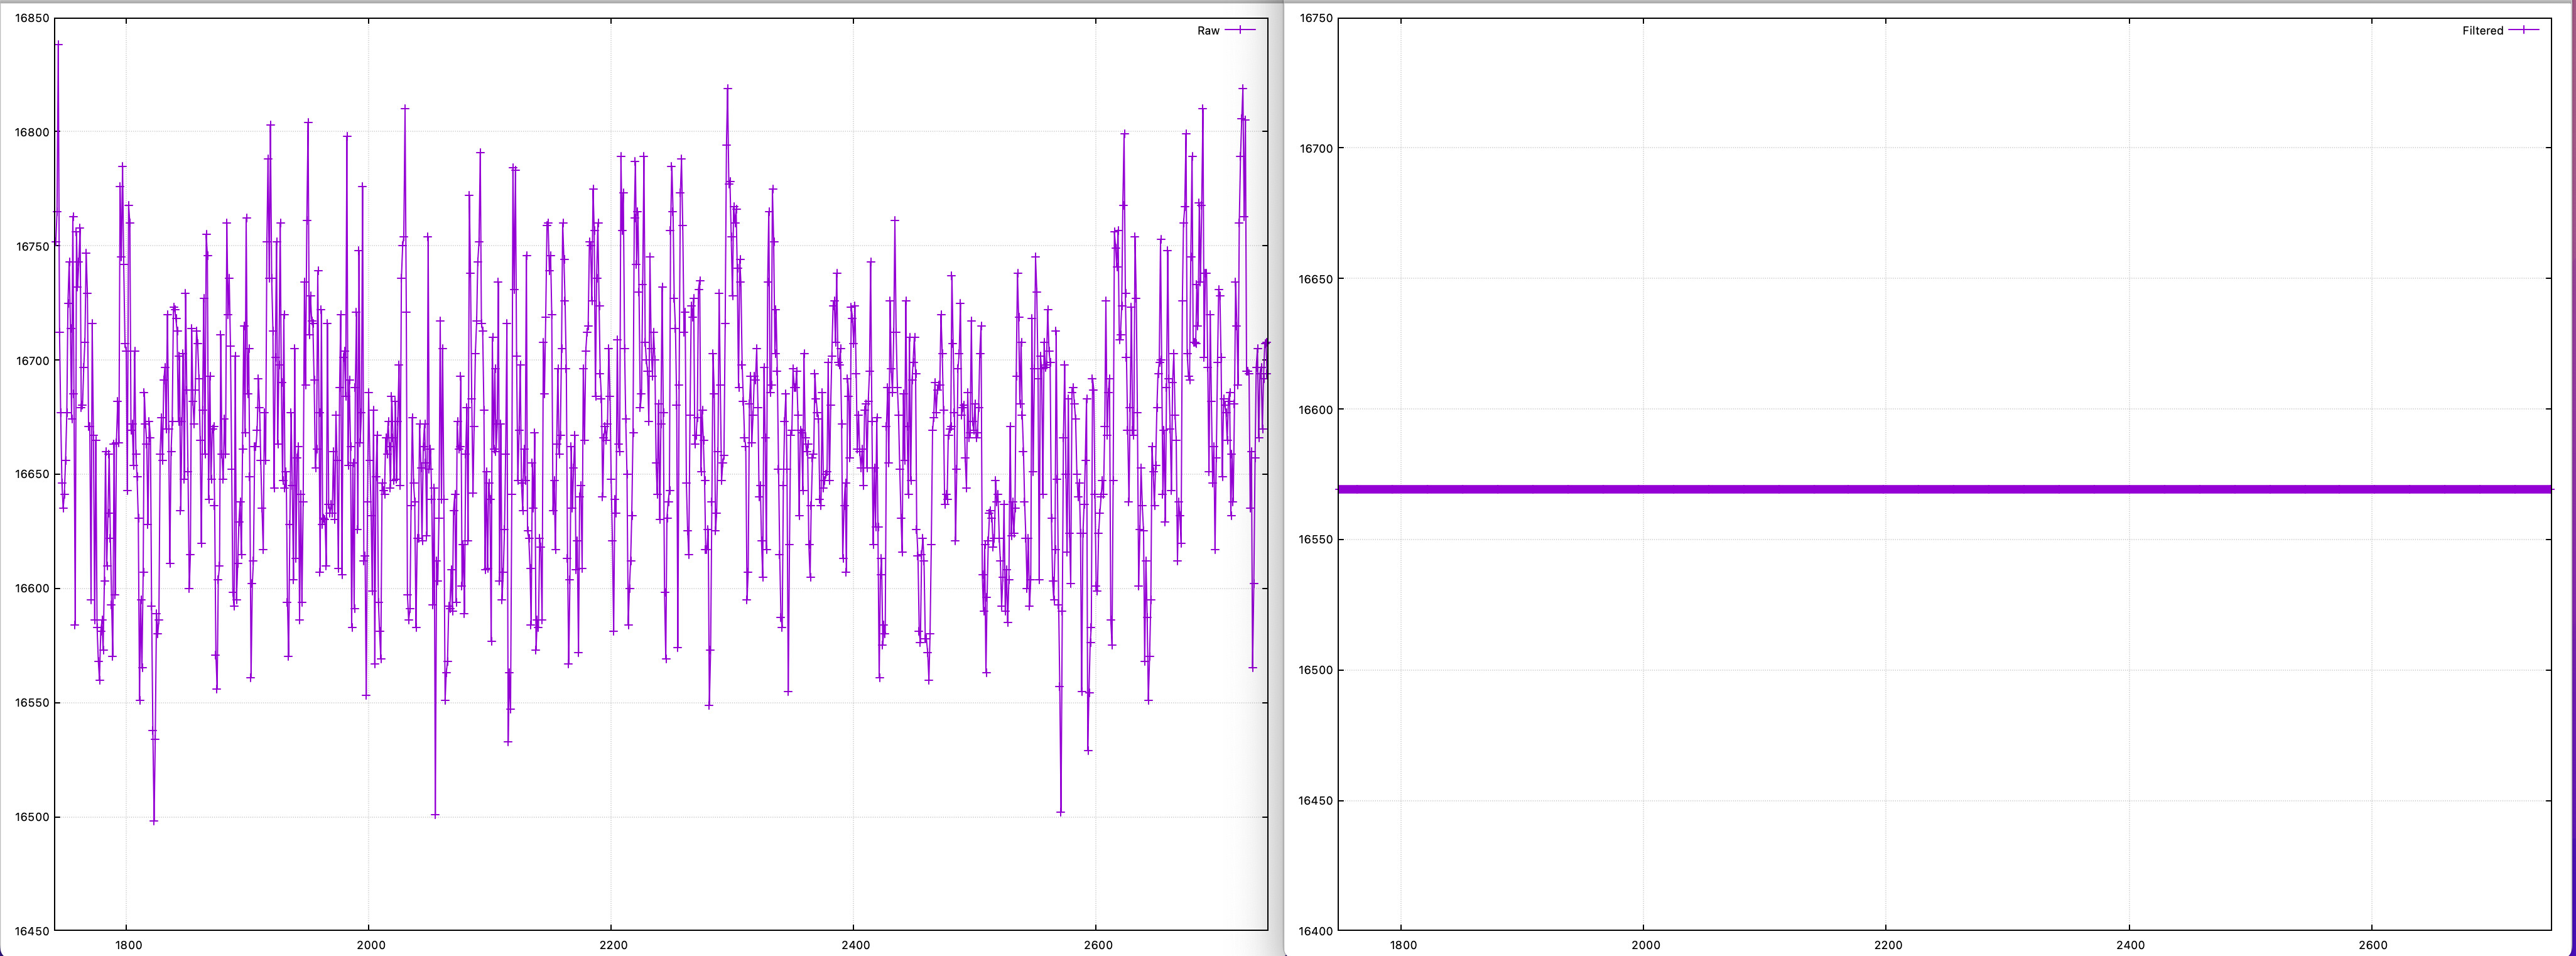
Here is a pair of graphs, raw data on the left, and the average calculated over 100 values on the right:
Same thing, but with the average calculated over 250 data points: