I would like to better understand and interpret the signals I am collecting to identify potential sources. I can see easily big events which are geological but there are many other signals which are likely man made which I would like to identify. What sources are available to use or educate myself to interpret this data? Is there a central database of known identified signals to compare with what I am capturing?
Don
I was confused by your message until I realised that you mean “interpreting”, not “interrupting”.
Yes, the non-EQ responses measured by the RS interest me as well, though I’m not sure if there is a database of these effects.
It’s fascinating looking at SWARM and trying to figure out what the non-EQ signals are.
Personally, from my two RSs I’ve identified:
Traffic - which has a diurnal pattern that I analysed here: http://www.tideman.kiwi.nz/RS/DeansAveTraffic.html
Trains - have a very distinctive signal that rises in energy to a peak, then dies away.
Rescue Helicopters that pass overhead on their way to the hospital - are quite different to trains, with high frequency energy resulting from the rotors.
Household Appliances - washing machine, especially.
Low-Frequency Hum - strongly correlated with large ocean swell crashing onto the coast 250 km away, as well as southerly fronts when atmospheric pressure changes rapidly.
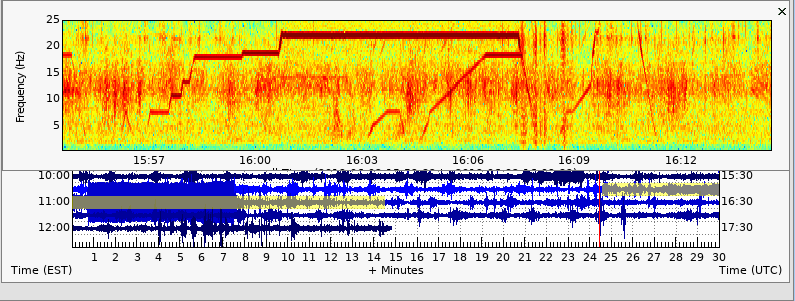
Hi Don, buenas tardes. As far as a “centralized database” goes, I’m not aware of one either, but that doesn’t mean it doesn’t exist somewhere. The following post is a good example of a man-made (or rather, machine-made) signal in SWARM spectrogram view. Many people find that it’s much easier to figure out what is causing noise at a given station by looking at both the spectrogram and the seismogram (i.e. the standard line plot) together. I find the spectrogram to be immensely useful as a visual aid to help me figure out the source and character of the noise.
@MA02129: I’ll add that in this case, the machine noise is a step function and always in a very tight spectral band at any given point in time. This is often true of fans, heating systems, washer/dryers, engines, and pumps. More diffuse spectral signals are typically indicative of some sort of impact, rather than rhythmic shaking. A diffuse spectral signal might result from a car tire hitting a pothole, for example.