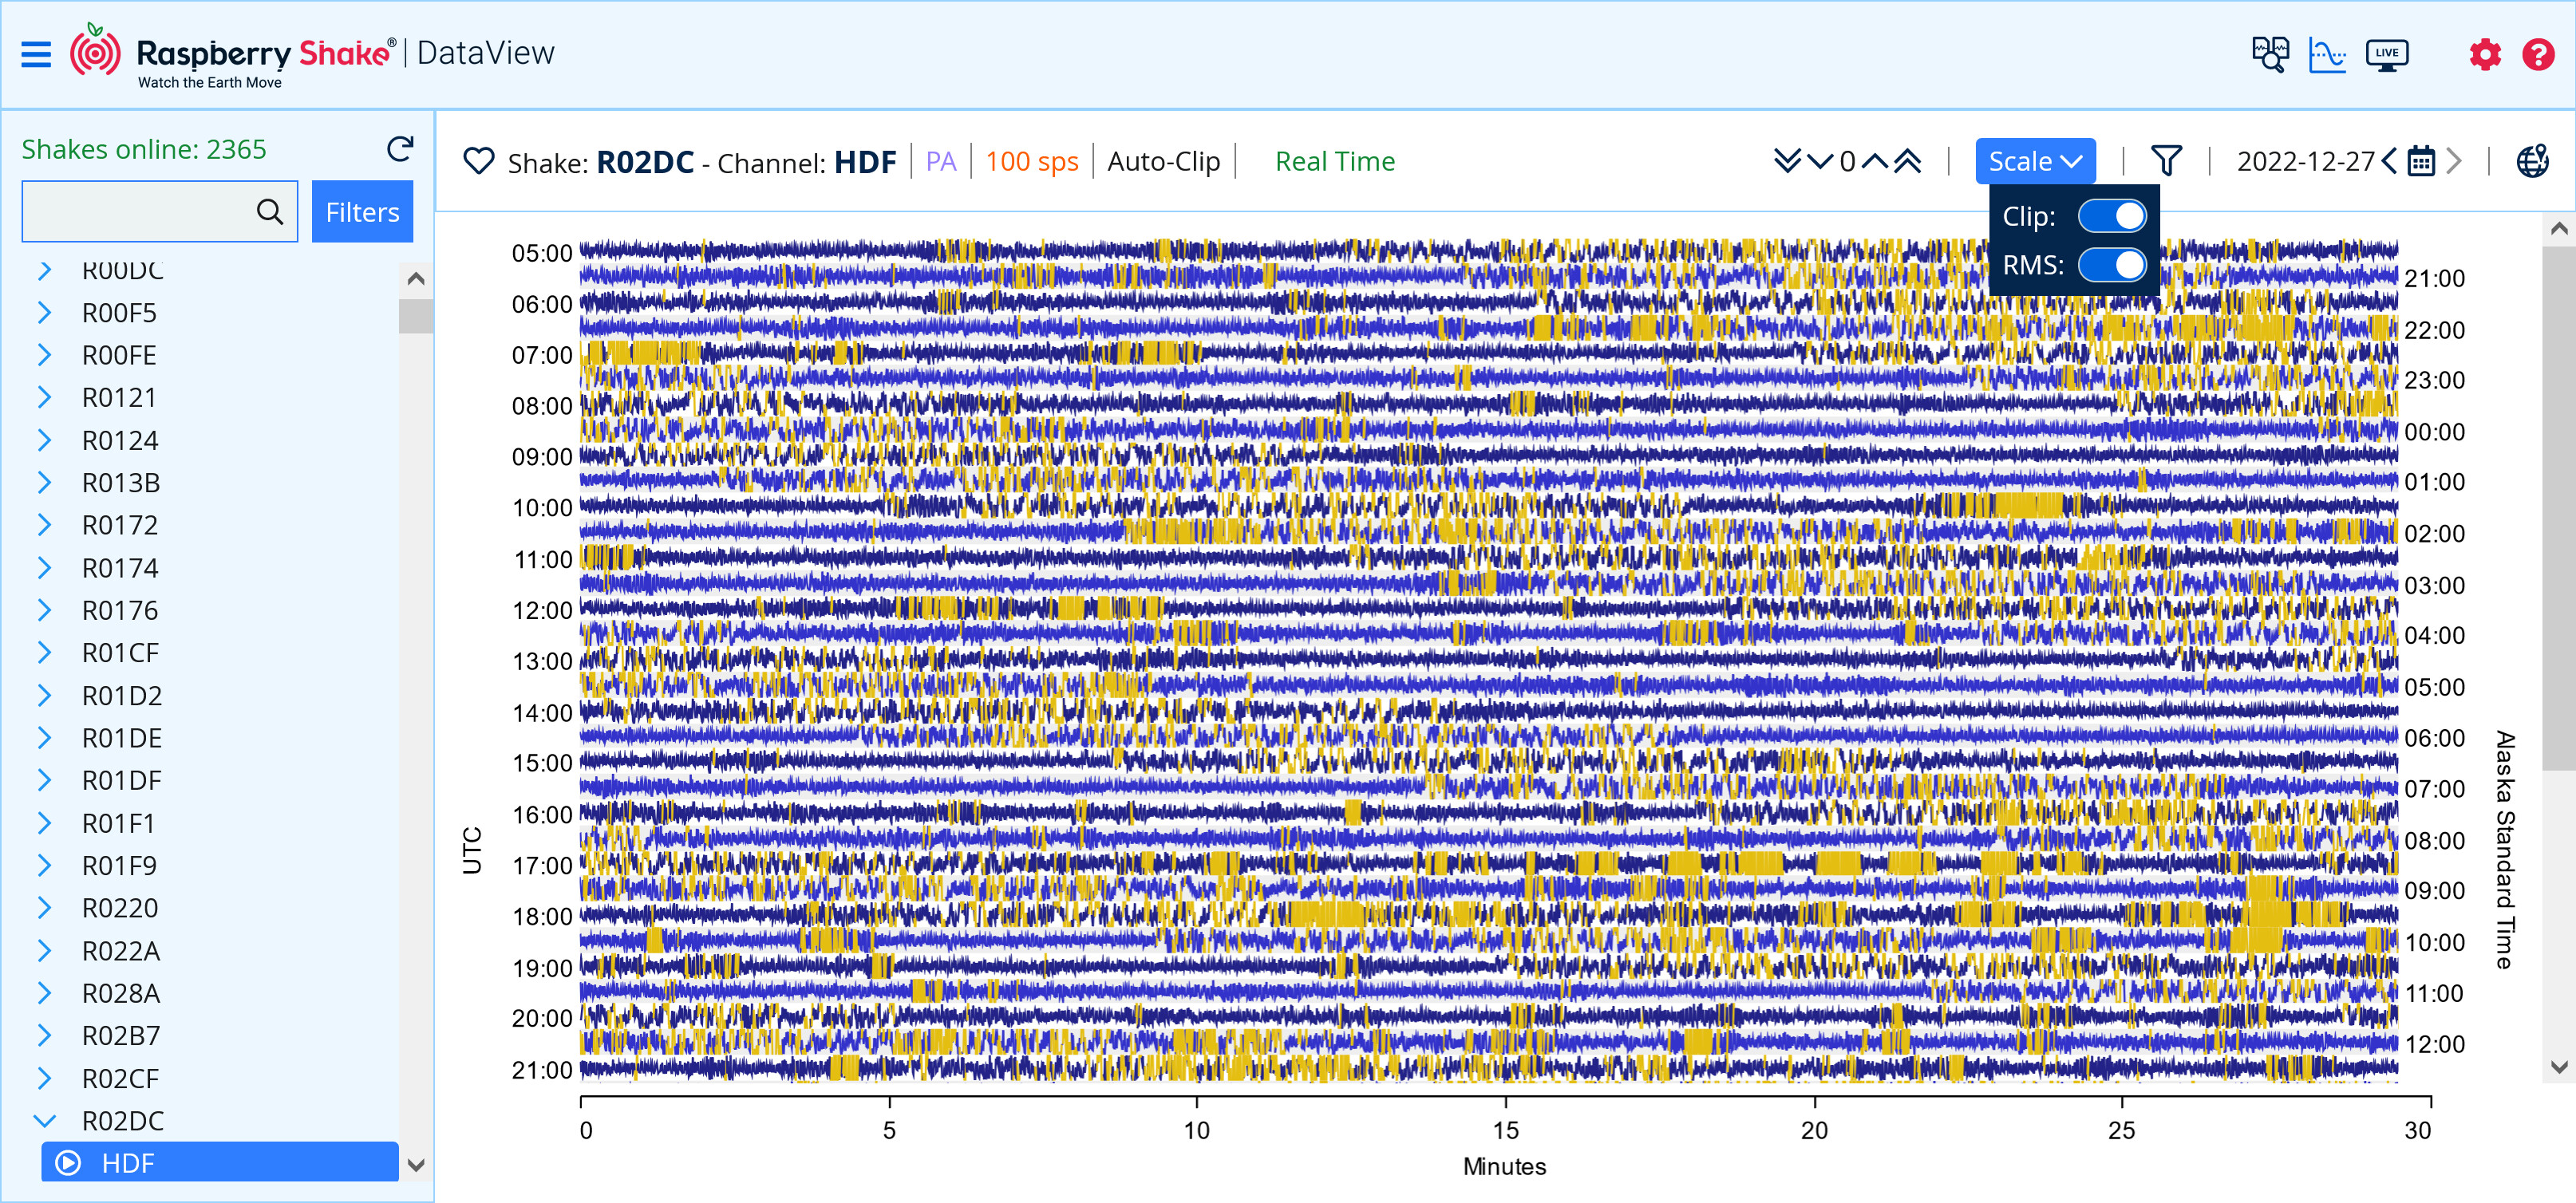
I installed a BOOM last summer at the HAARP Facility near Gakona, Alaska. Yesterday I was playing around with the 24-hour live stream and the CLIP and RMS settings and noticed some quasi-periodic features. See attached plot image.
The features start on the left and very slowly over several hours descend to the right (increasing time).
The weather has been very cold there lately, getting down to -40C and staying there for days. The ambient temperature when the screenshot was taken was -20C. The air would be quite dense.
However, I am pretty sure the features are instrument effects and not natural but I cannot prove either way. The instrument is indoors in a relatively temperature stable environment with a tube to the outdoors for sensing.
Are there any thoughts about these features and their cause? Has anyone seen anything similar?
HAARP IS PINGING AN ASTEROID TODAY: Researchers from NASA and the University of Alaska are about to perform an unusual radar experiment. They’re going to ping a near-Earth asteroid using shortwave radio. The target is a 500-ft-wide space rock named “2010 XC15.” When it passes by Earth on Tuesday, Dec. 27th, the HAARP array in Alaska will hit it with a long pulse of 9.6 MHz radio waves. Radio astronomers ping asteroids all the time. What’s unusual about this experiment is the frequency: 9.6 MHz is hundreds of times lower than typical S-band and X-band frequencies used by other asteroid radars. The goal is to probe the asteroid’s interior.
Lead investigator Mark Haynes of the Jet Propulsion Laboratory (JPL) explains: “The low frequencies we are using can penetrate the asteroid, unlike S-band or X-band frequencies which reflect mostly off of the surface. Ultimately the idea is to use echoes to form tomographic images of asteroid interiors.”
i really can’t say what the effects of the radar experiment would be on air pressure, this is way outside my expertise, but how would a radar pulse affect local air pressure? otoh, since both the BOOM and the experiment are seemingly co-located, (to what degree is unclear), that they are coincident in time, like the asteroid, this could be more than just a passing interest.
approaching this differently, this (most definitely) periodic signal has the following features:
only began on 26-DEC
lasts for ~ 14 minutes
begins ~ every 35 minutes
leaving an ~ 20 - 21 minute gap between cycles
from that, i would at a minimum conclude:
not instrumental in nature, instruments like these (meters) generally do not function vs. time scales
not diurnal
thus, external in nature
i am assuming you do not have access to the unit, but if you did, a couple of things you could do:
move the tube to the inside and see if this changes the signal at all
better: co-locate another BOOM that measures the inside pressure such that you could see the difference between outside and inside at the same time. though, this obviously will only work if the inside is relatively well-sealed from the outside; but given that it’s -40 outside, i assume this would be true
i am also curious to find out what this could be. when does the radar experiment end? are there advertised absolute start and end times that could be annotated on the plot that could reveal whether the two are related?
(just off the top of my head, forgive any gross misstatements…
The Boom and HARRP do seem to be rather close to each other. Couldn’t find any information on the characteristics of the transmitted signal (e.g. power), but I did find this:
HAARP will transmit a continually chirping signal to asteroid 2010 XC15 at slightly above
and below 9.6 megahertz (9.6 million times per second).
The chirp will repeat at two-second intervals.
That doesn’t look like the trace from the Boom - no sign of a 2 second component.
BTW, the signal you are looking at is (to me) much clearer if you turn off the clipping and just decrease the amplification by one step.
The features occur whether the HAARP Ionospheric Research Instrument (IRI), ie, the transmitter, is operating or not. The transmitter operated continuously for 12 hours from 1100 to 2300 UTC on 27 December (UTC), as did its diesel power plant, for the Asteroid Bounce Experiment.
I was involved in that experiment and noticed the BOOM features before the experiment even occurred.
I looked back a few days to see when the feature started, and it is there at least a week before the 27th. And it seems to change shape. Some periods have a slope opposite of the one shown in the screenshot I posted.
This appears to be some kind of drifting, possibly in the electronics or power supply. I’m going to mark it down as interesting and something to pursue further when I have more time.
Is your tube affected by the cold? Could its increasing density and contraction as the temp drops correlate to what you see? You said it is “outside” at one point.