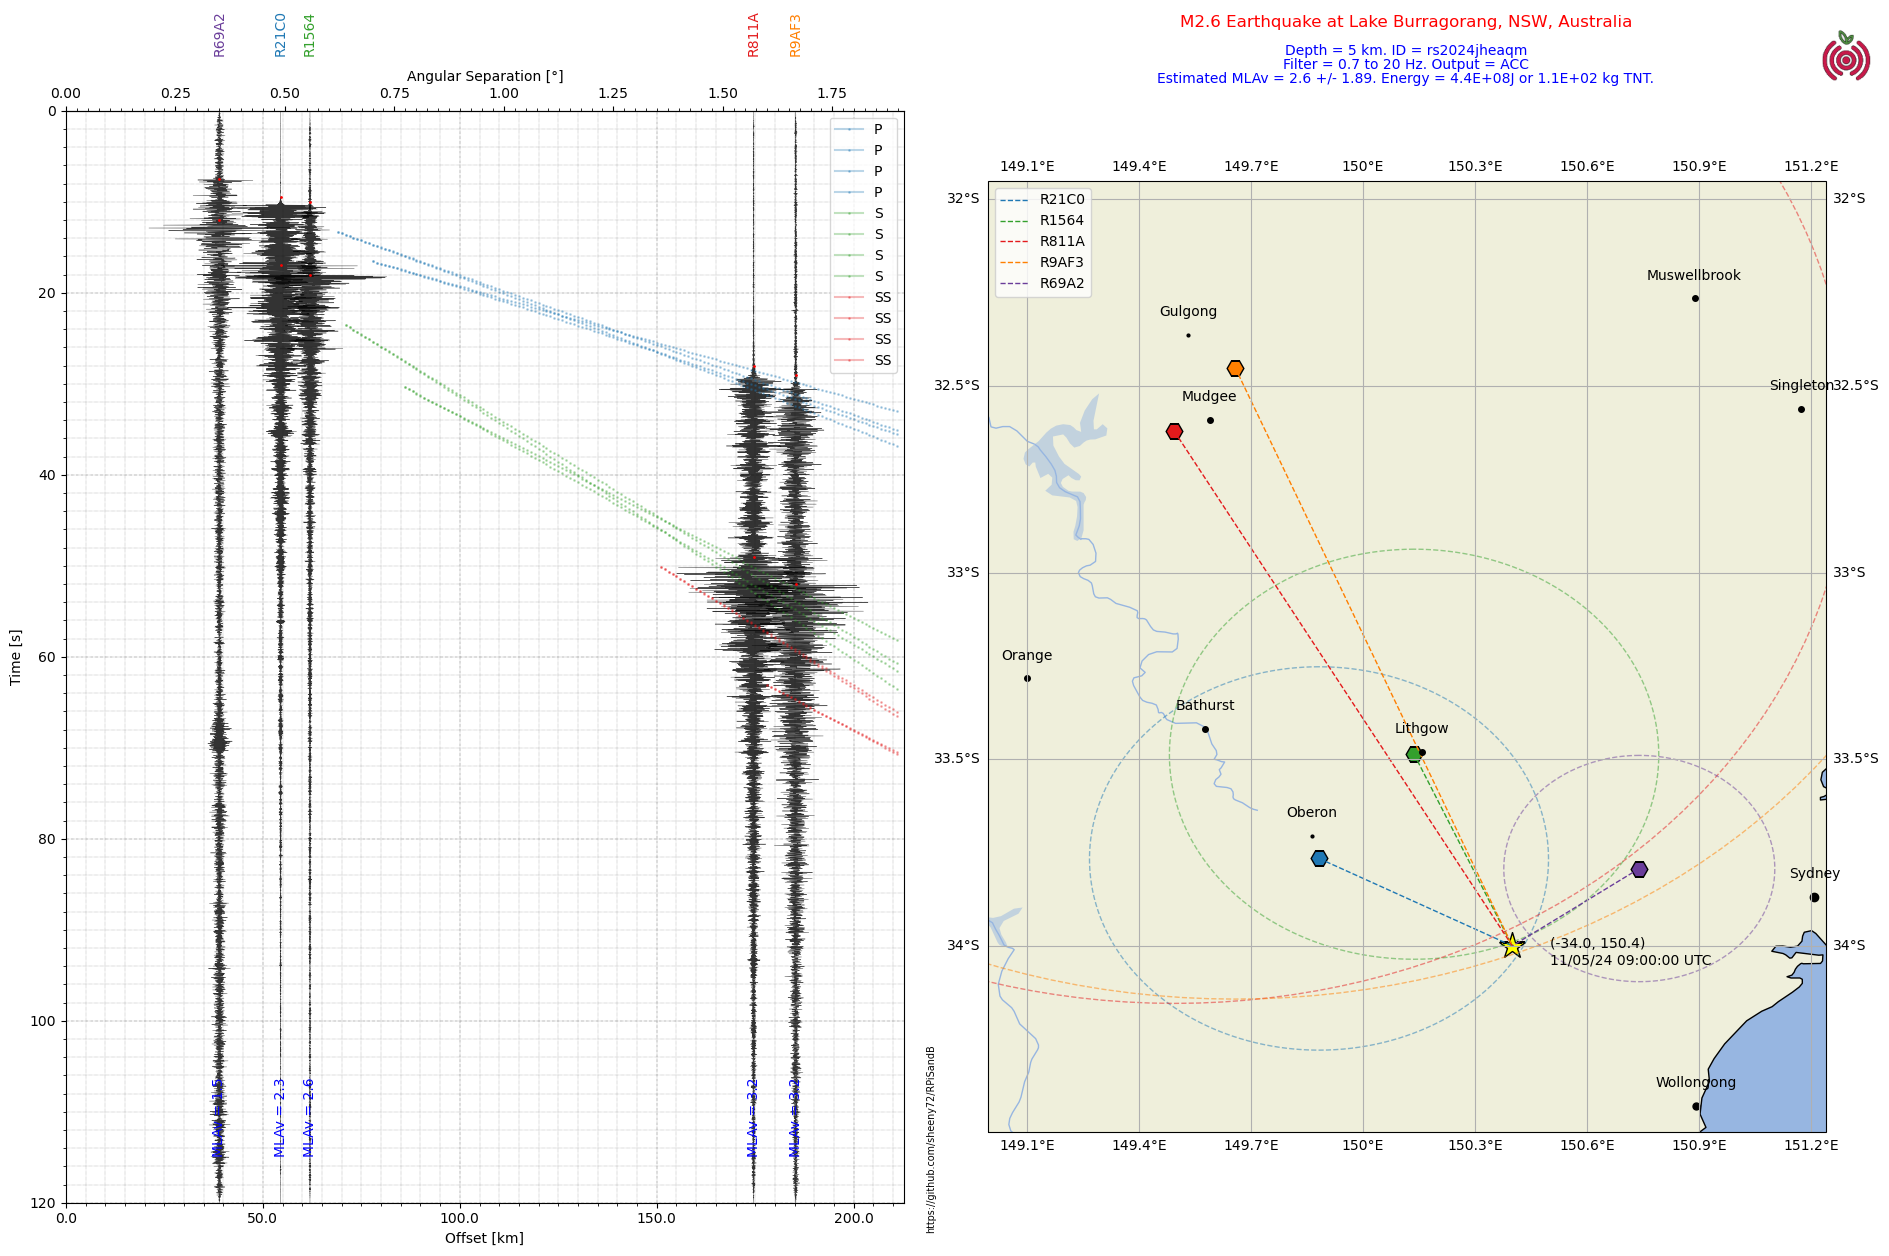
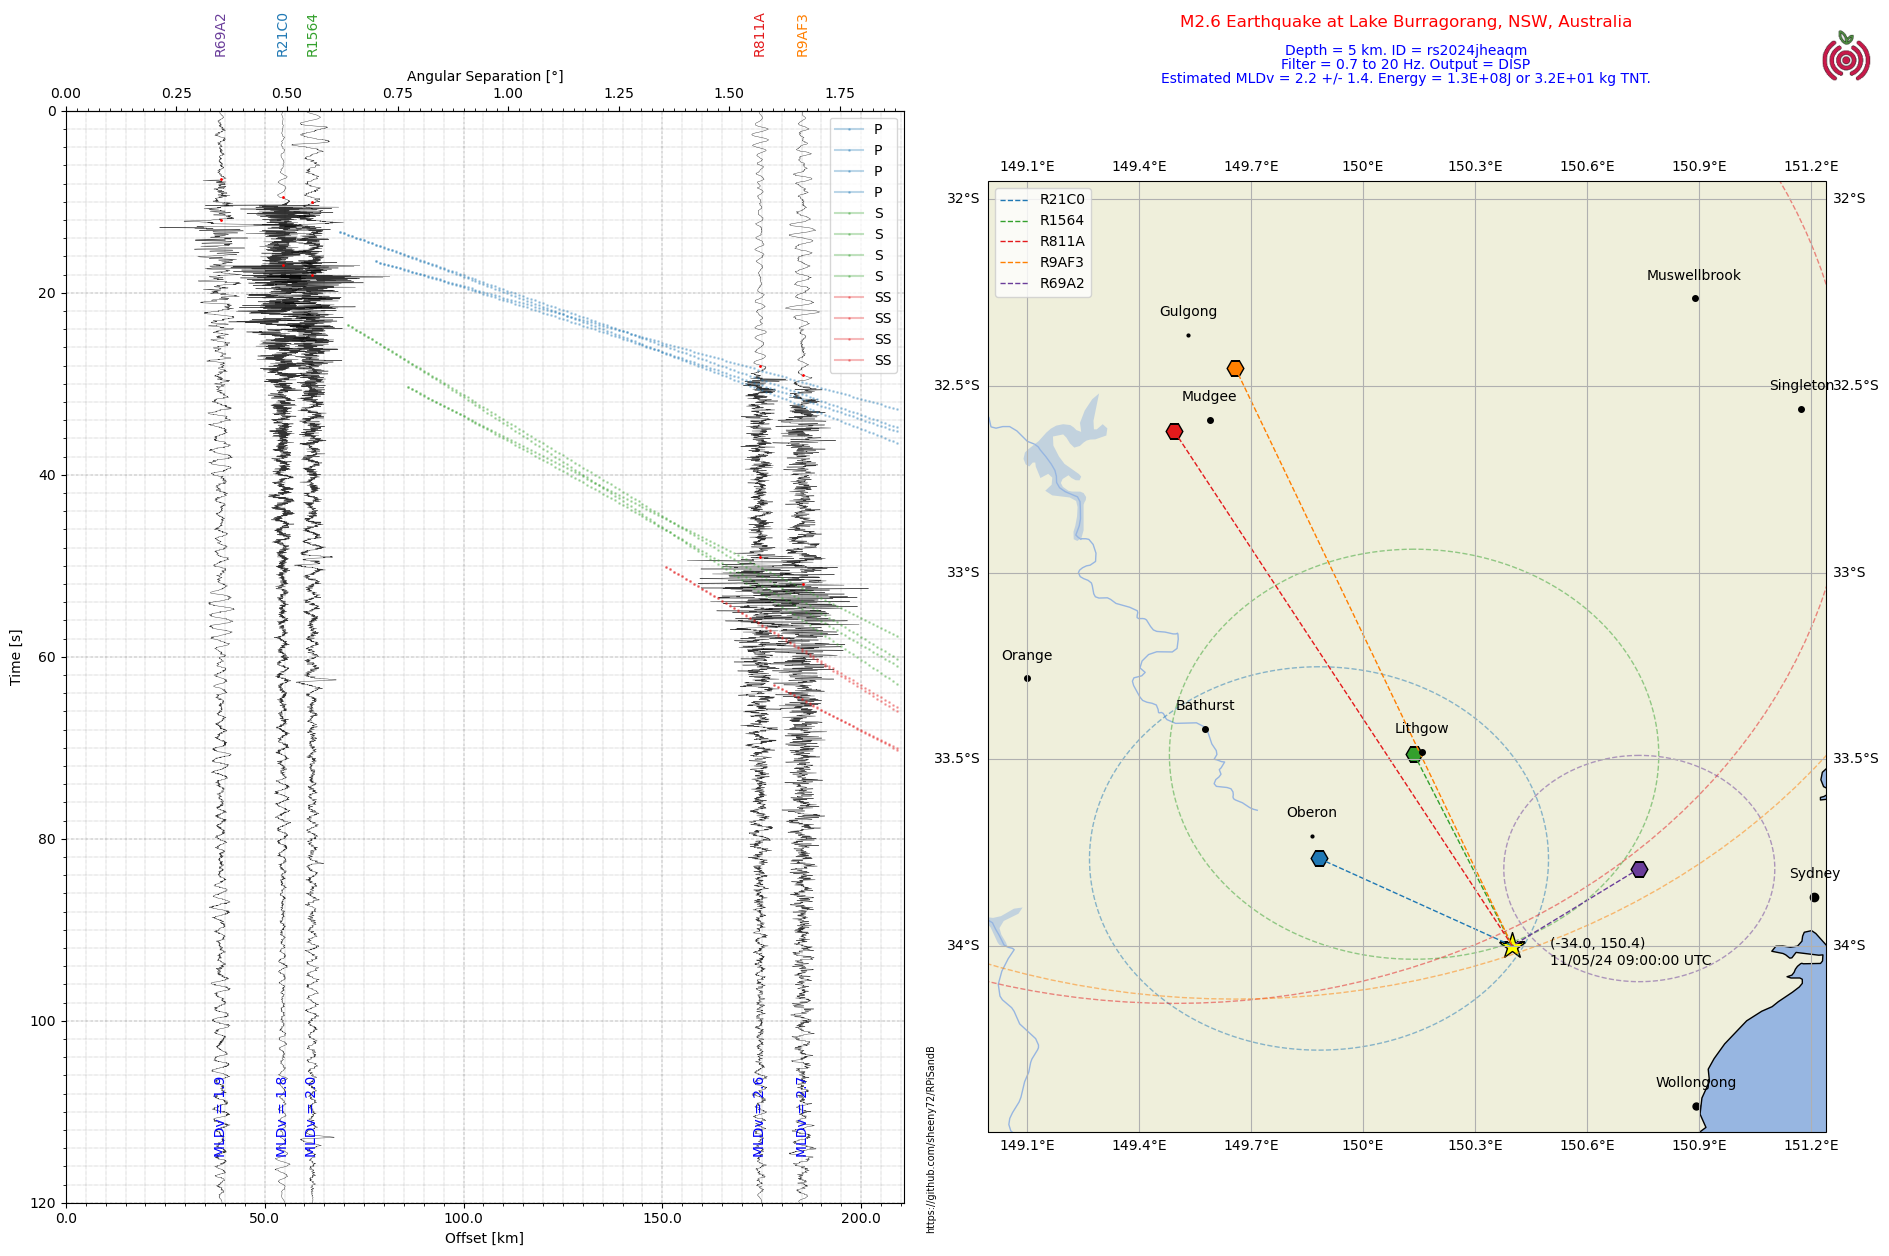
As an aside, I reckon, based on the section plots that the quake time should be more like 08:59:58 UTC not 09:00:00 UTC as officially estimated at the time of processing.
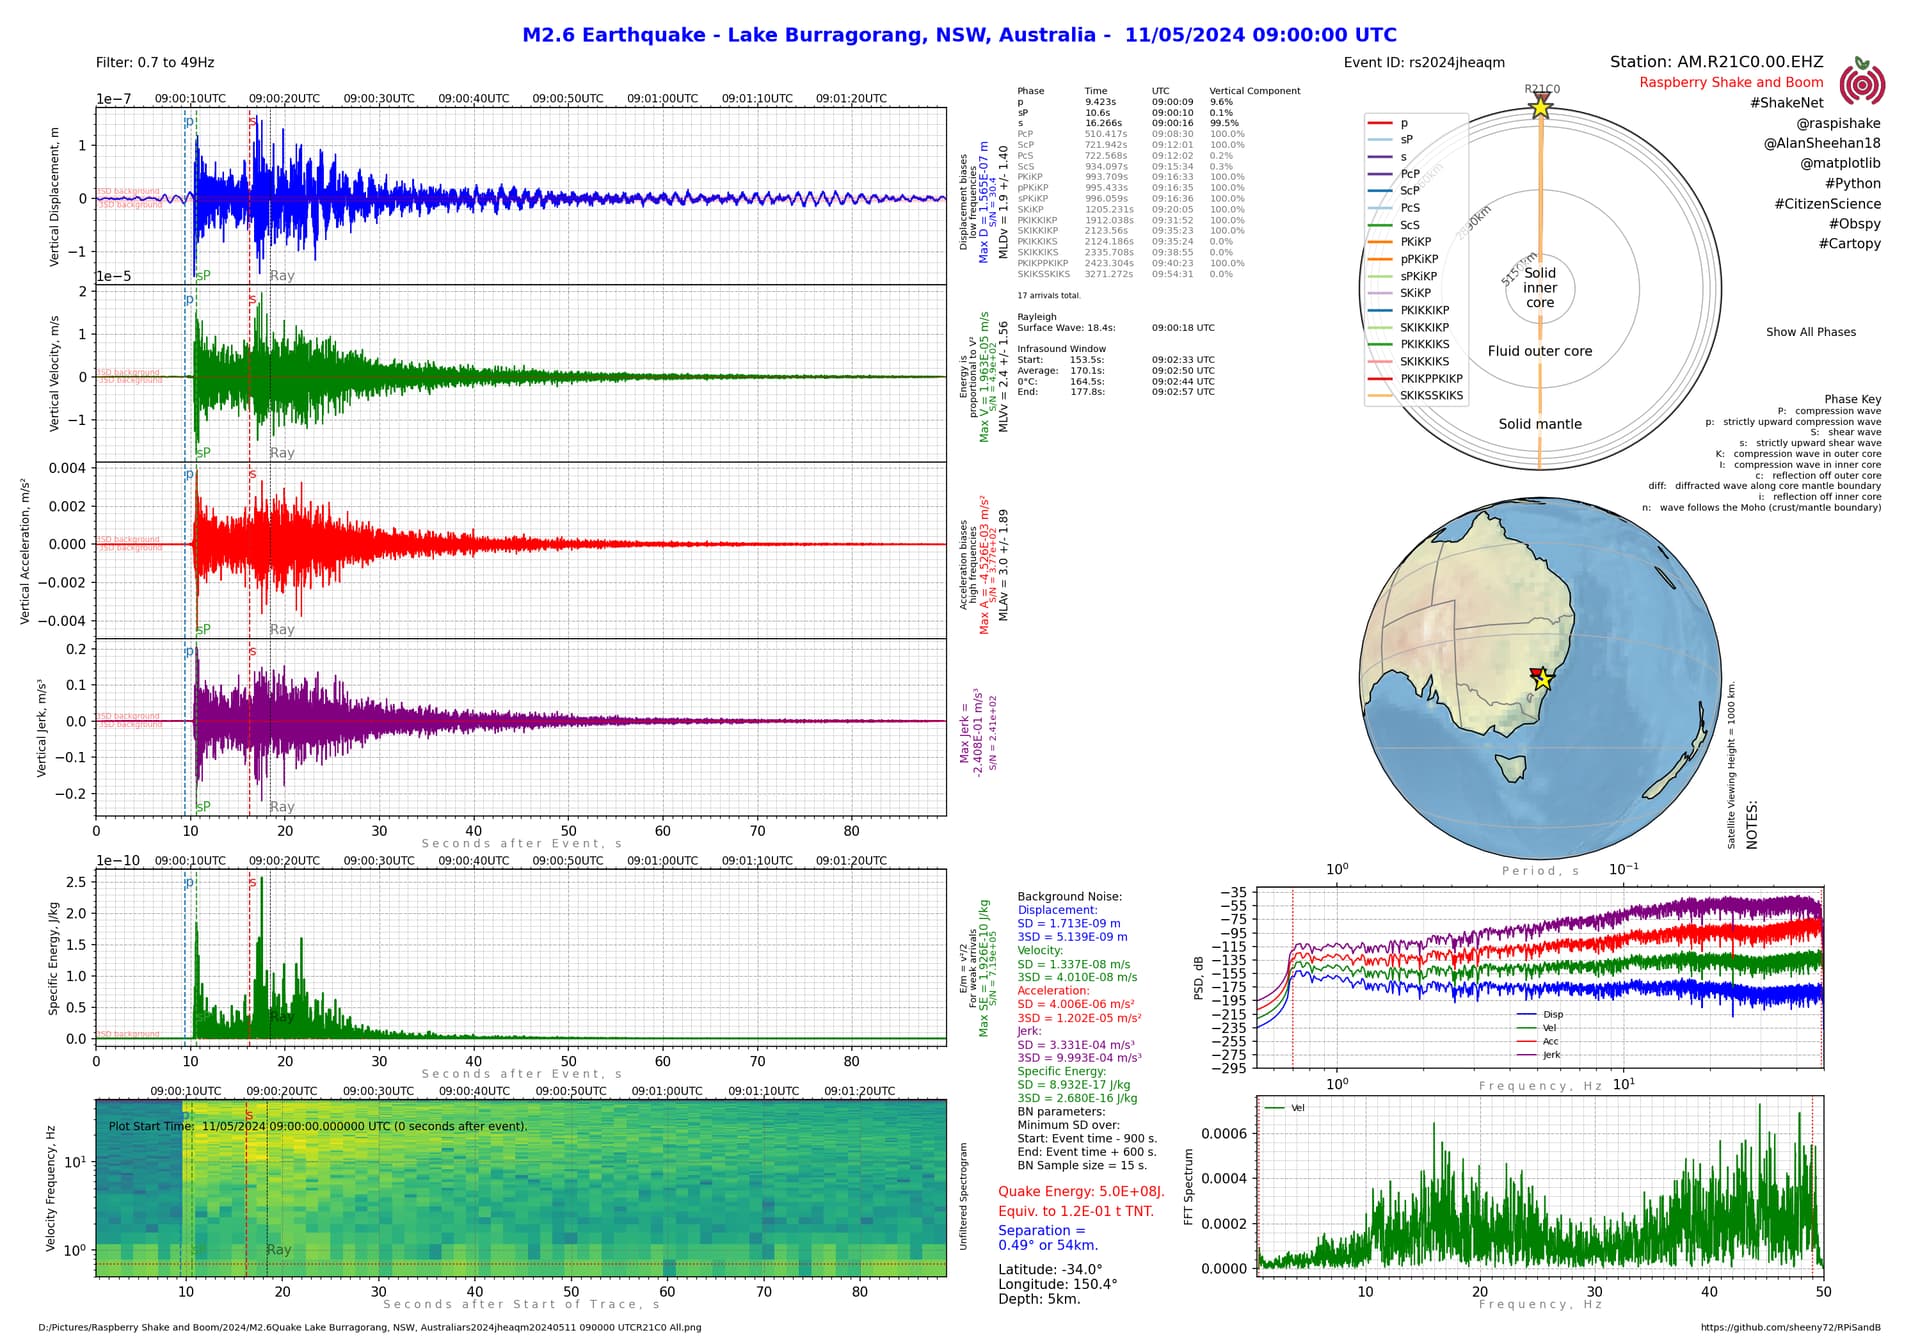
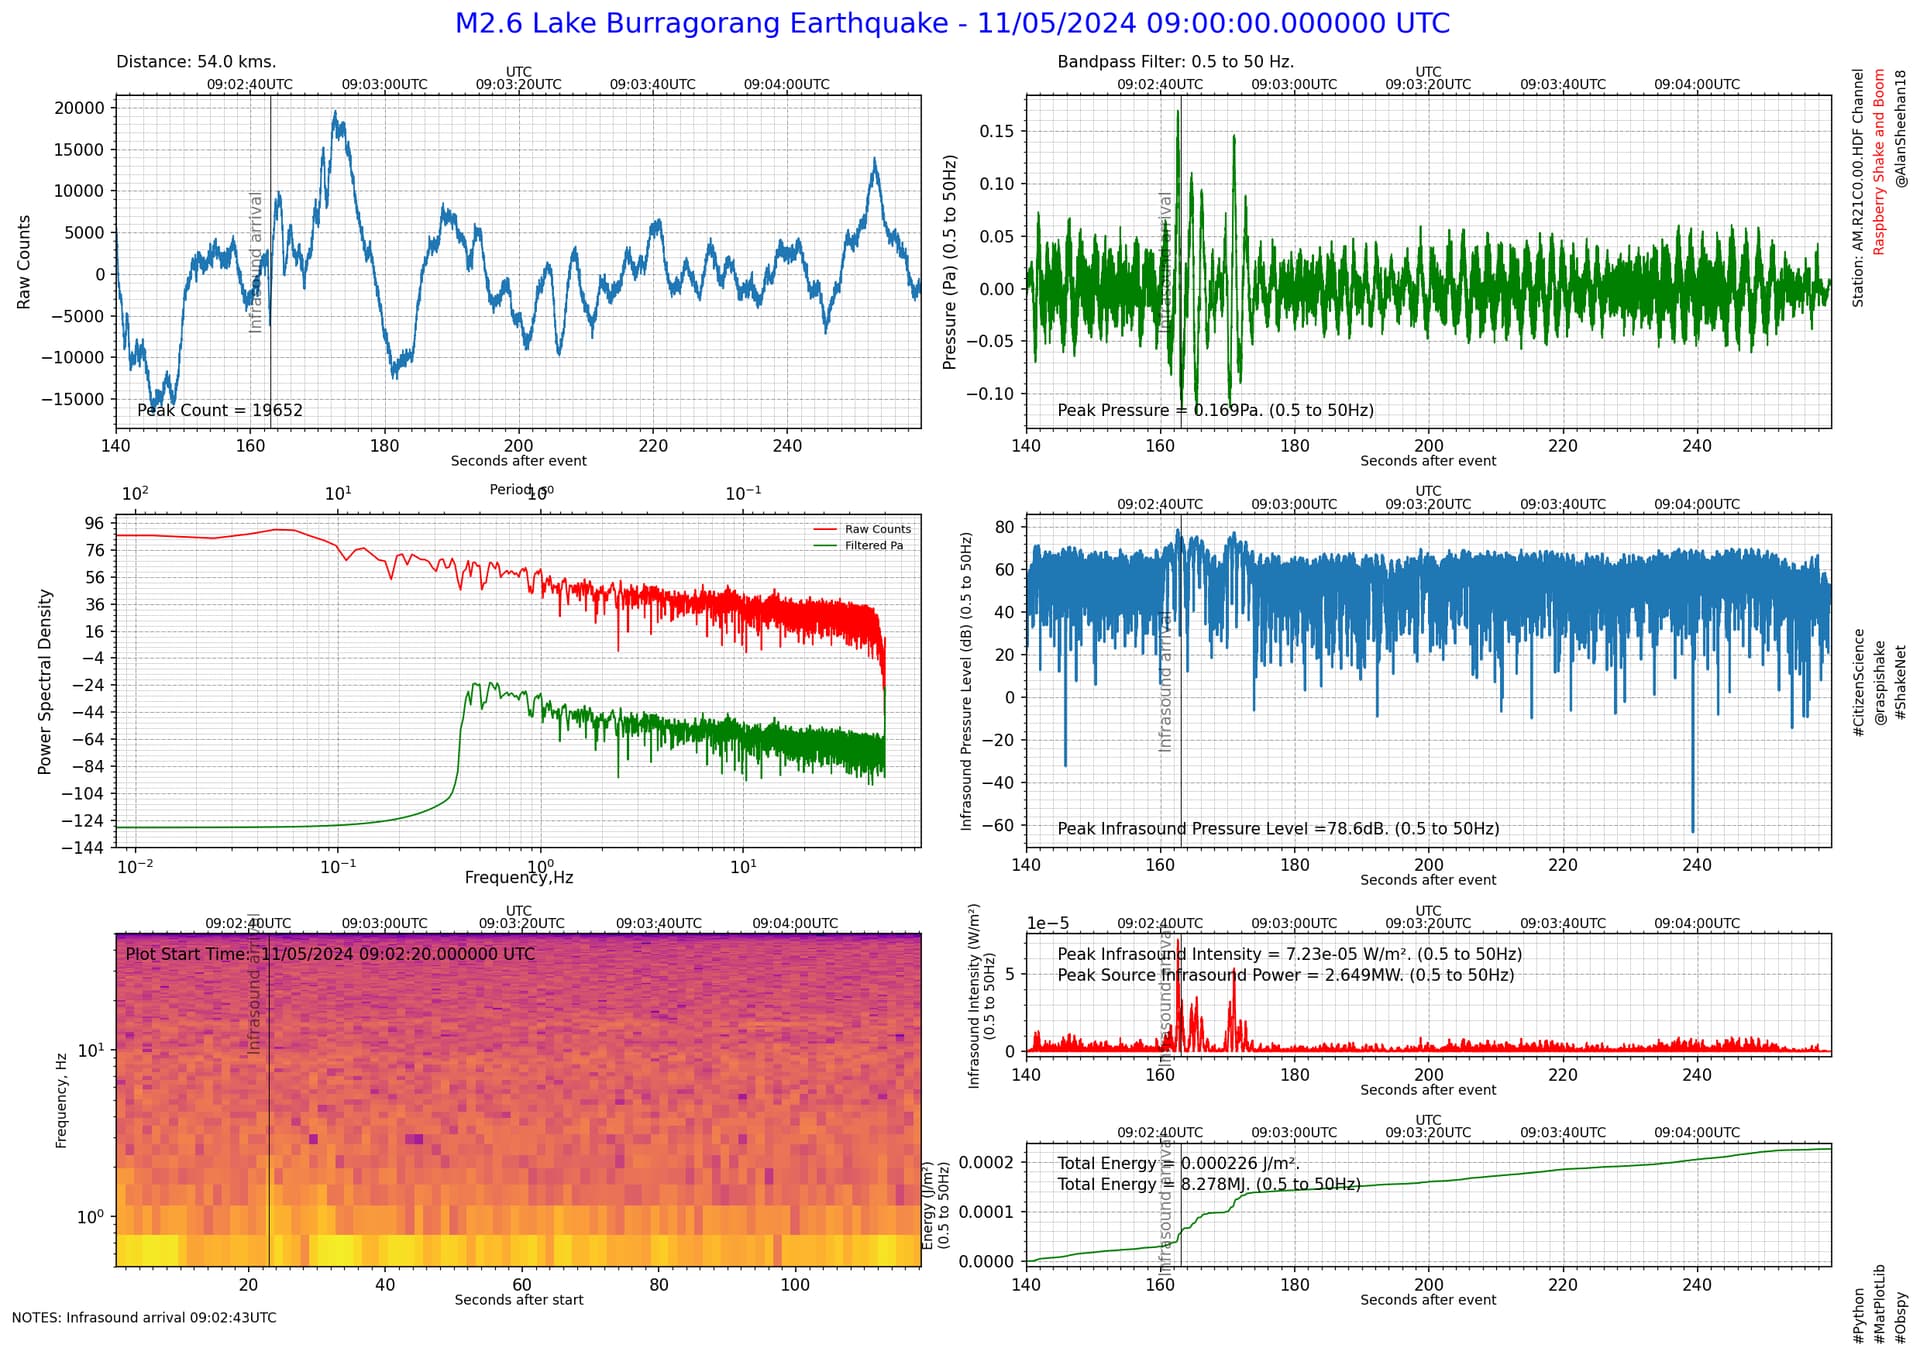
As the quake was nice and close (just 54kms away) I thought I’d see if an infrasound signal could be detected from it. If you look closely at my seismic report, I calculate the arrival time window for an infrasound signal. This is based on how the speed of sound changes with temperature and altitude in the atmosphere, so signals inside the window could be a related infrasound signal, but outside that window they cannot be (without extenuating circumstances like significant prevailing winds etc).
So an infrasound signal from the quake should arrive between 9:02:33 UTC and 9:02:57 UTC.
I put the infrasound calcs into my report for explosive events in particular, but curiosity being what it is, thought I’d give it a whirl.
I need another event or access to Tim’s station with my python code to verify, though. I can’t pick it with DataView on his shake with a rough manual estimate of when the HDF signal should arrive… which itself is not a good sign for verification, but it may just be my estimated arrival time isn’t good enough.
I guess it is more likely to work on quakes where there is vertical movement of the ground.
Hi Sheeny - these are wonderful reports. I’d like to be able to this level of analysis across some of the quakes that I detect on my Shake and Boom - which tool or tools did you use and what’s involved in pulling together these types of reports please?
These reports are all written in Python using the Obspy package for seismographic calculations, and the Cartopy package for mapping.
I have copies of all my reports on my Github repository, so feel free to use them for code examples, or copy and just change what you need. I had a lot of help from people like @Stormchaser and @wmvanstone as I learned to code in python, so I’m happy to help as well.