Hi guys.
I was taking a look to geophone frequency response and (electrically) band extension,
From “specifications for (1D) Raspberry Shake”, v7:
poles [ -1. , -3.03, -3.03, -666.67]
zeros [0, 0, 0]
I used this code in Python to get bode plot:
geophone = signal.ZerosPolesGain(zeros, poles, A0)
w, mag, phase = geophone.bode(w_array) #signal.bode(geophone)
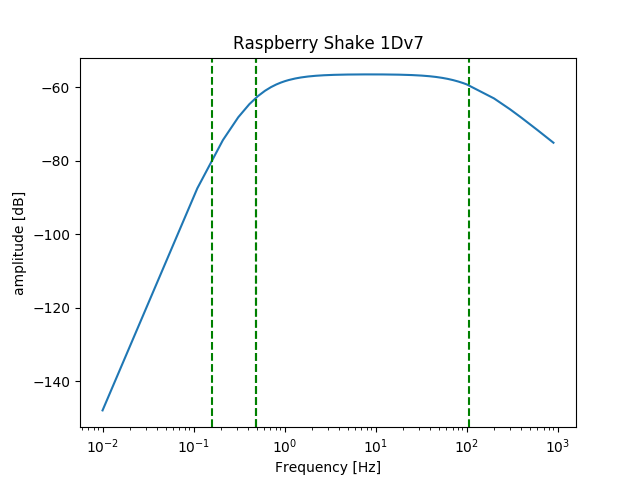
Ok, don’t take care to amplitude, but it looks good.
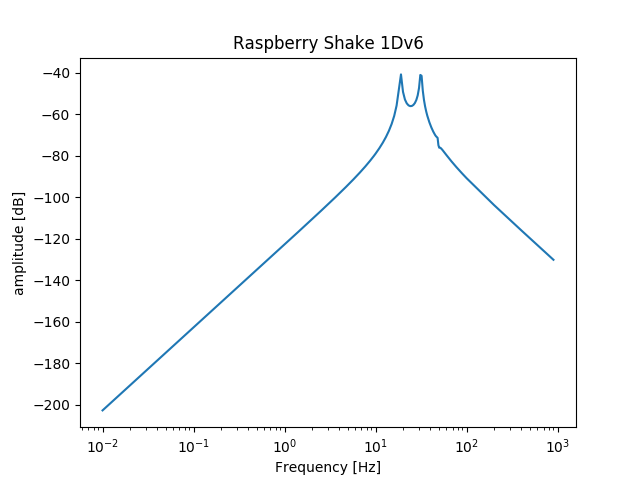
Raspberry Shake v6:
zeros [-4.51+308.j, -4.51-308.j, 0.00 +0.j, 0.00 +0.j]),
poles ([-4.88+306.j, -4.88-306.j, -2.22+118.j, -2.22-118.j, -3.33+198.j,
-3.33-198.j]),
Raspberry Shake v4/5:
zeros ([-6.75, 0. , 0. , 0. ]),
poles ([-4.21, -2.33, -1.3 ]),
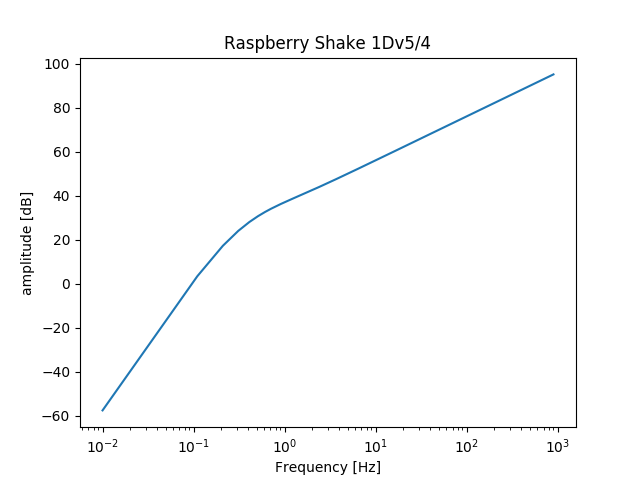
So, what’s wrong?
Then, going back to v7 frequency response.
Model of geophone is
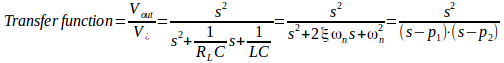
For band extension I change damp value to move poles and get differentiator at 0.5 Hz.
Then I use bandpass filter at 0.5 Hz:
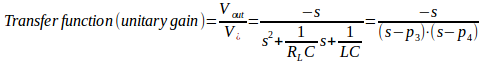
Final model for geophone with band extension is:
3 zeros and 4 poles as v7.
Often I can see flat upper band (such Lennartz 3D-1s) where there is missing high frequency pole:
![]()
How can I cancel high frequency pole to get flat band over than 100Hz?
Thanks.