I’m new to our Shake and learning a lot by studying the day-to-day workings of the data over the last four months. However, I’m confused by something on our machine today.
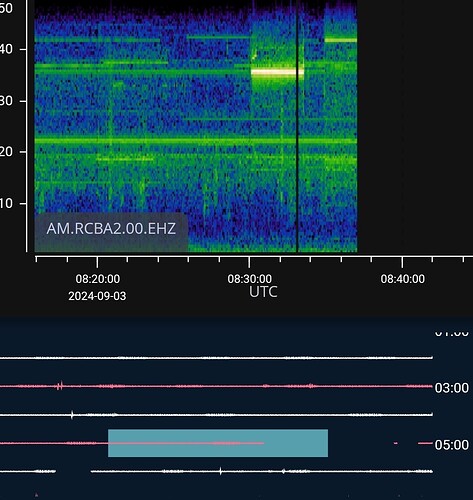
RCBA2/EHZ/9/3/2024 @ 5:00 AM EST/8:30 UTC.
There is a perpendicular line on the 5:00 AM hour (far right side). Please increase the amplification up past 10, the perpendicular line climbs the entire page.
As I’ve never seen that particular data, and because there is no exact corresponding sound data on the HDF side, I wondered if it is truly a noise, or if that is the Shake Machine doing something odd?
Thoughts, anyone?
Thank you for your input.
Nissan Armada
1 Like
Does anyone know if military planes make this type of data?
1 Like
I don’t see a vertical line in the actual data in your HDF channel at that date and time. There is, however, some data loss near there - there are gaps in your data about then. Everything else, ahead and behind that time look normal.
1 Like
SouthLewisHighSchool, would you check the EHZ side? That was totally my fault, I was focused on not finding anything in the HDF side that I put the wrong information in the RE line. I corrected the post.
Thank you so much for your contribution!
Nissan Armada
1 Like
I see two things at 8:30ish UTC on the 3rd in your Z channel. 1, data loss (a black bar), but also a strong 36hz signal (horizonal bar). That signal shows up in your data everywhere going on and off.
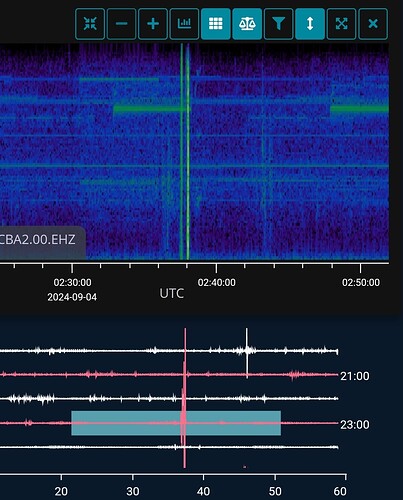
On the 4th at 2:38 UTC you picked up a pair of what is probably quarry blasts of sorts. The image also shows the same 35-36hz signal from the previous day.
Probably a regularly cycling motor for the 35hz - maybe an air handler
2 Likes

