New to this, and still not sure I can recognize the signature of a quake when I see one, and have a couple of questions if someone would be kind enough to answer them for me:
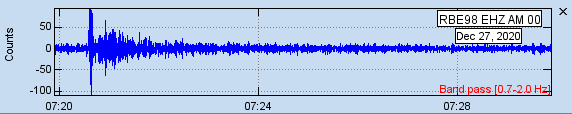
Are the below Quake signatures as I believe they are?
Some of these seem unequivocally quakes, but I am so new to this that I might be hoping more than understanding. If these are, they are all relatively high magnitude quakes so…
If these are indeed Quakes my RS&Boom has captured, is there a reasonable limit to the magnitude of EQs I should be looking for in traces on Swarm? Should I not bother looking at Mag 5 or 4’s, unless they are very, very close? What is the theoretical potential for capturing very low signals, assuming I have the dynamic range available?
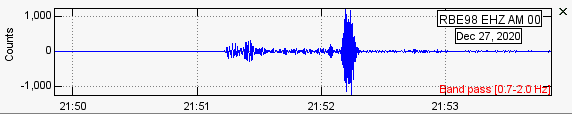
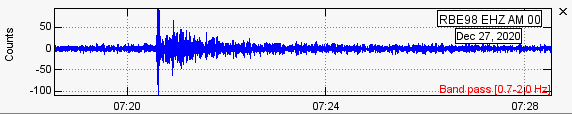
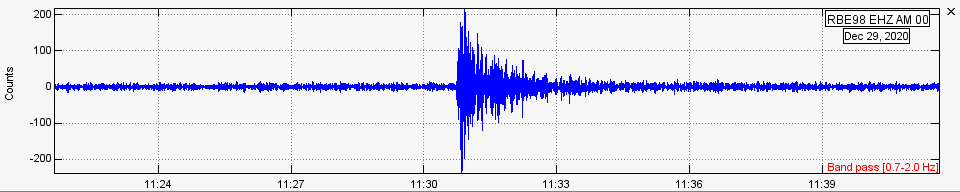
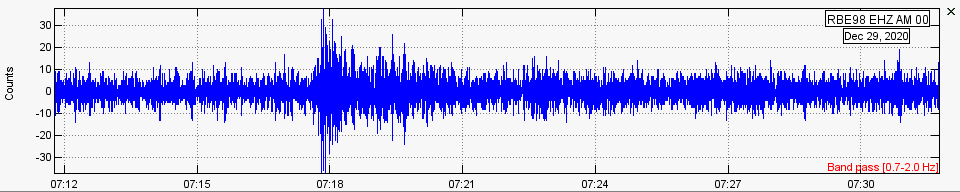
I’m not sure about the top one as that large amplitude response looks like a car or something going past, but the smaller response before that could be one it’s hard to tell. The others however do look like an earthquake pattern to me. The sudden spike followed by a slowly weakening signal is one of the typical earthquake responses that can be seen, though not exclusively. This is seen in the 7:20 and 11:30 time frames that you have posted. If you have an android or iPhone, I recommend getting the shakenet app, as it contains a prediction of phase arrival time for each earthquake and seismometer, which is always good for a quick check to confirm results.
In terms of what can be detected, I’ve detected M5.0 plus from over 1000km’s away, though it’s usually when the local noise was low enough for it to be detected. 4.0+ is a bit trickier and I can’t give you a limit on that, but they are detectable, but I’d recommend looking for the stronger responses first to get a feel for it. Anything less it’ll be hard to distinguish between ambient noise or local sources, though, again, not impossible.
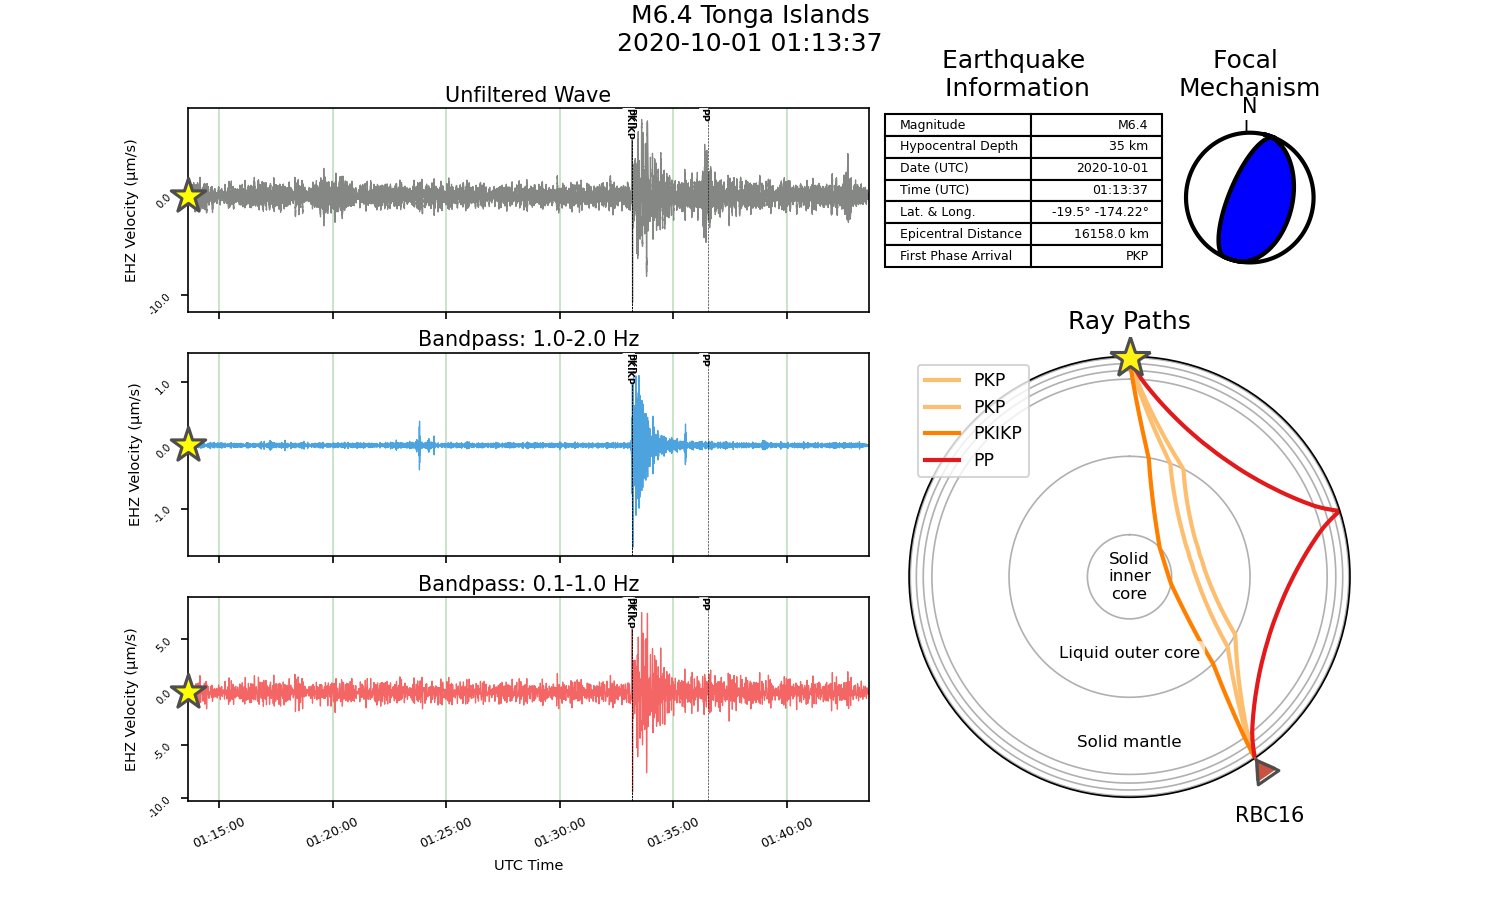
Another thing I would add to this, the frequency band you’ve used is the least noisy low frequency bands on the rapsberry shake, which show signals more clearly, so that’s a good choice. However, if a particularly powerful earthquake occurs on the other side of the globe, you can reduce your bandpass to 0.1-1.0 Hz and you may see a stronger signal than at the 0.7-2.0 Hz frequency bands. This is due to attenuation of frequency bands over time. It’s a bit more complicated, bit it’s fun to play around with different frequencies to see what is visible.
Hope that was informative, (and not too confusing)
Alex
P.S. I’ve added an image below showing a strong earthquake looking at multiple frequency bands. If you look at the scales of the different graphs you’ll see the bottom (0.1-1.0 Hz) is stronger than the middle (1.0-2.0 Hz) signal, but the lower ambient noise of the middle graph make them appear similar in size.
Thank you, that is a very informative response, and most appreciated. I appreciate the time you took to answer, and hope I can learn a lot more and be as helpful myself in the future. Happy New Year and thanks again!