Getting started with ObsPy

I’m in the process of learning to use Python and ObsPy on a Win10 machine. I have almost no experience with Python, so I have worked through several tutorials to get acquainted with the basics.

I went to Anaconda to get ObsPy. Through Anaconda I installed ObsPy (I think). However, I am just not able to access the library – operator error I’m sure.

At this point, I really don’t know what I’m doing! I’d like to reach out to the Shakeosphere and get some startup support using ObsPy on a Windows machine.

Once off and running, I plan to process the raw seismic files for plotting, filtering, etc. Basically just tinkering, but I need to get out of the box first!

Thanks in advance,
Jeff

1 Like

Hi Jeff, I’m psyched that you’re interested in getting your feet wet in computational seismology!

Did you follow the instructions on the obspy website for installing via Anaconda? https://github.com/obspy/obspy/wiki/Installation-via-Anaconda

What happens when you open an Anaconda Prompt and paste and run the following commands?

conda activate obspy
python -c 'import obspy; print(obspy.__version__)'

The activate command changes the prompt from (base) to (obspy), so that seems to work. The request to view version # returns with ModuleNotFoundError:

(base) PS C:\Users\Jeff> conda activate obspy
(obspy) PS C:\Users\Jeff> python -c ‘import obspy; print(obspy.version)’
Traceback (most recent call last):
File “”, line 1, in
ModuleNotFoundError: No module named ‘obspy’
(obspy) PS C:\Users\Jeff>

Here are a few screen shots for reference. The first is the Anaconda Powershell where I ran the commands. The second shows the directory where obspy was installed by Anaconda, and the last shows Anaconda Navigator with reference to obspy:

Ok it looks like you have the environment but obspy is not installed in it yet. Try this:

conda activate obspy
conda config --add channels conda-forge
conda install obspy
python -c 'import obspy; print(obspy.__version__)'
1 Like

Success! Version 1.1.1 returned.
OK, what did I just do?
What do I have to do to get started each time?

Here’s my first obspy script.
It reads, filters and plots a single miniSEED file from the RS1D.
Apologies for the display here, all my text gets interpreted.
At the bottom of this message is an example plot of 24 hrs recording with a 5 Hz lo pass!!!

Any suggestions/upgrades welcome!
(edit: some edits suggested by @iannesbitt below)


# Plot and filter miniSEED

# Activate obspy from root:

     # conda activate obspy

# Note: there's actually no need to do "import obspy" here because
#    you only use the read() function within obspy. So you can save
#    a little bit of computing time and memory by not importing the
#    whole thing!
from obspy import read

# Read file and print stats

st = read("D:\JLL Data Files\PDF_files\EQ Software\Shake R2DEF miniSEED files\AM.R2DEF.00.EHZ.D.2019.214")
tr = st[0]
msg =  "%s %s %s %f %f" % (tr.stats.station, str(tr.stats.starttime), str(tr.stats.endtime), tr.data.mean(), tr.data.std())
print("\n\n",msg)

# Filter and Plot

st.filter("lowpass", freq=5.0)
st.plot()

2 Likes

Great! Here’s an explanation:

# this activates the obspy environment you created earlier.
#    now that you have obspy installed, this is the only thing you
#    need to do before running your script.
conda activate obspy

# this is just a one-time command that adds the conda-forge channel
#    to the places that conda searches for software in.
#    conda-forge is where obspy lives.
conda config --add channels conda-forge

# this (obviously) installs obspy into the obspy environment
conda install obspy

# this runs a command (-c) quickly in Python without the need for you
#    to fully dive into a Python shell. so it opens a python shell, runs
#    anything inside the single quotes, then closes the shell again.
#    the two commands (separated by a semicolon) actually import obspy
#    and print the version, but only inside that briefly existing shell.
python -c 'import obspy; print(obspy.__version__)'

Given that, here’s how you start up and run your script:

  1. Open an Anaconda Powershell
  2. Activate the (obspy) environment
    conda activate obspy
    
  3. Run your script:
    python myscript.py
    

Simple, right?

I also made some formatting and code suggestion edits to your post above. Hope these are helpful and clarifying.

Moving along!

Here I access waveform and instrument response from Raspberryshakedata and apply (remove) the instrument response.

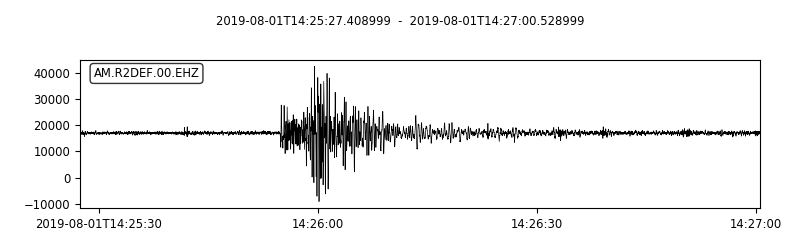
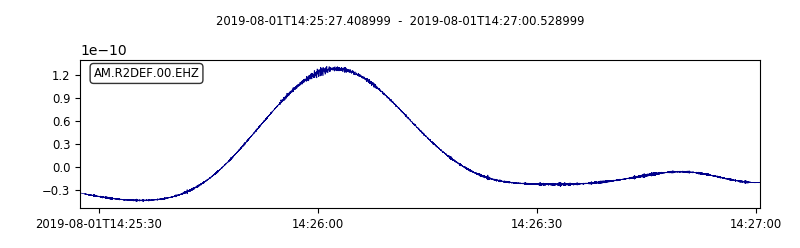
I am confused about the results. The RS1D geophone should be in velocity units, but when I ask for VEL, the seismogram is riding on a long period signal. When I ask for ACC, I get a seismogram that is higher frequency and noisier than the original.

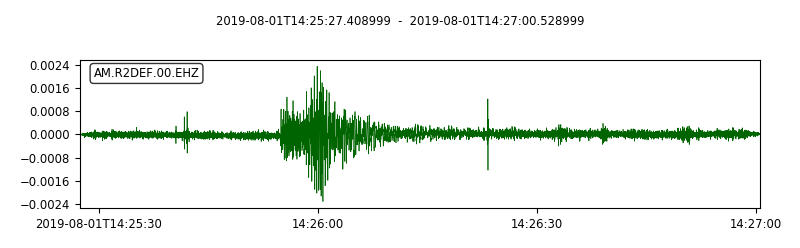
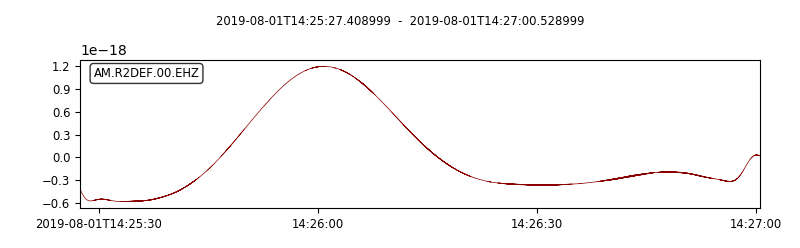
Below are the plots: Black curve (1) = input, Green curve (2) = ACC, Blue curve (3) = VEL, and Red curve (4)= DISP.

Here is the script:

# remove instrument response

# Load stuff
from obspy import read_inventory, read
from obspy.clients.fdsn import Client
from obspy.core import UTCDateTime, Stream

# set the station name and download the response information
stn = 'R2DEF'
inv = read_inventory('https://fdsnws.raspberryshakedata.com/fdsnws/station/1/query?network=AM&station=%s&level=resp&format=xml' % (stn))
print (inv)

# set data start/end times
start = UTCDateTime(2019, 8, 1, 14, 25, 30) # (YYYY, m, d, H, M, S)
end = UTCDateTime(2019, 8, 1, 14, 27, 0) # (YYYY, m, d, H, M, S)

# set the FDSN server location and channel names
rs = Client(base_url='https://fdsnws.raspberryshakedata.com/')
channels = ['EHZ'] # ENx = accelerometer channels; EHx or SHZ = geophone channels

# get waveforms, put them all into one Stream, and attach the response
stream = Stream()
for ch in channels:
    trace = rs.get_waveforms('AM', stn, '00', ch, start, end)
    stream += trace
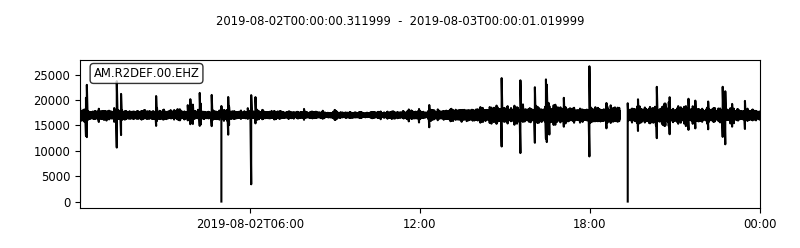
stream.plot(color='black', linewidth='0.5',handle='true')

# attach the response info
stream.attach_response(inv)

# remove the response and plot ACC
resp_removed_ACC = stream.remove_response(output='ACC') # convert to acceleration in M/S
resp_removed_ACC.plot(color='darkgreen', linewidth='0.5', handle='true')

# remove the response and plot VEL
resp_removed_VEL = stream.remove_response(output='VEL') # convert to acceleration in M/S
resp_removed_VEL.plot(color='darkblue', linewidth='0.5', handle='true')

# remove the response and plot DISP
resp_removed_DISP = stream.remove_response(output='DISP') # convert to acceleration in M/S
resp_removed_DISP.plot(color='darkred', linewidth='0.5')
1 Like

Hi @OBSeismo, this is quickly reaching the limits of my expertise area. Your ACC plot looks okay to me but can you try plotting DISP and VEL after highpass filtering above 0.5 Hz? It looks like the long-period stuff is an artifact of some kind (although comparing it to a nearby broadband might be informative).

Hi,

I was reading this post looking for an answer to my problem, but I couldn’t find it. However, I think the answer is related with. I will install four shakes in a remote place, with wifi connection, and I want to analyze the data every day. So I guess, I manually have to import the files from de rs to my pc. I installed Zero Tier in the shakes, and File Zilla to get into the rs computer. Nonetheless, I haven’t being able to remove the response of the files without using the RS server, because I’m not sure how to load the files in ObsPy, and how to load the count to m/s conversion.

As I said, I’m able to do it through the RS server, but I want to do it by my own, to speed the process using just the information in my pc. Can you help me ?

Thanks in advance,

Andrés

Hi, please have a look at the read_inventory() function, and the tutorial section on reading seismograms.

To read a miniSEED file:

from obspy import read
stream = read('/path/to/mseed')

You can load a Shake response file by reading a URL like this:
Note: you will have to replace R24FA with the name of your shake

from obspy import read_inventory
inv = read_inventory('https://fdsnws.raspberryshakedata.com/fdsnws/station/1/query?network=AM&station=R24FA&level=resp&format=xml')

To remove the response:

stream.remove_response(inventory=inv, output='VEL')
1 Like

Thank you very much for the answer ! It was very helpful.

2 Likes

Hi, I need some help.
I’m just try to use obspy on windows 10 under anaconda 3.

I was followed all instruction on https://github.com/obspy/obspy/wiki/Installation-via-Anaconda but I got error “failed to create process” when tried to runtests (obspy-runtests). The same error on another obspy command. Anyone can help me?

Hi @eq1, you may want to open an issue on the ObsPy github (https://github.com/obspy/obspy/issues), the user group over there will be more likely to be able to help you.

Hi @iannesbitt. I’ve already asked on ObsPy github but still not got the solution so I asked here too. Thx for you response.

1 Like

hello I was reading this post , and I wanted to ask a question,
I’m a beginner and I’m not an expert when it comes to python.
but I wanted to ask how do I send the vibration data from my shake to my laptop in real-time ?
how do I establish the connection and how do I send the data to server .
and thank you

1 Like

Hello ShaimaGuaid,

Regarding your query, there is an available UDP datacast service that you can use to acquire live-stream data from our Shakes to then process/study it, and much more.

You can find information about this feature here on our manual: Raspberry Shake Data Producer UDP Port Output — Instructions on Setting Up Your Raspberry Shake

Also, you can experiment with our python-based tool RSUDP (provided as-is), that connects to the same UDP datacast service to display a live waveform/spectrogram plot. You can find more information here: rsudp 1.0.3 — rsudp documentation

2 Likes