I am implementing a simple ObsPy based processing pipeline that works either from miniseed data files or the shake directly using the easyseedlink class. The goal is to measure building sway using the MEMS sensors in my RS4D located on the 50th floor of a 54 storey building. I’ve demonstrated a few days ago using rsudp during high winds that this works fine, but the displacement scale is off by about 6 orders of magnitude. I confirmed with my cat-toy+frying-pan double floor height pendulum that the building sway period was about 3 seconds with amplitudes on order a few cm. rsudp saw the correct period, but amplitudes are reported as up to 25km which clearly is well out of the ballpark…
My first suspicion is with the instrument response file needed to deconvolve the data. As it is generated outside my visibility, I have no idea what goes into this. I’ve downloaded a copy of the instrument response file yesterday and another copy today from this link https://fdsnws.raspberryshakedata.com/fdsnws/station/1/query?network=AM&station=R8A4D&level=resp
and interestingly those two files are identical with the exception of the "created "timestamp - so they do get updated, but by the looks of it, only the created timestamp.
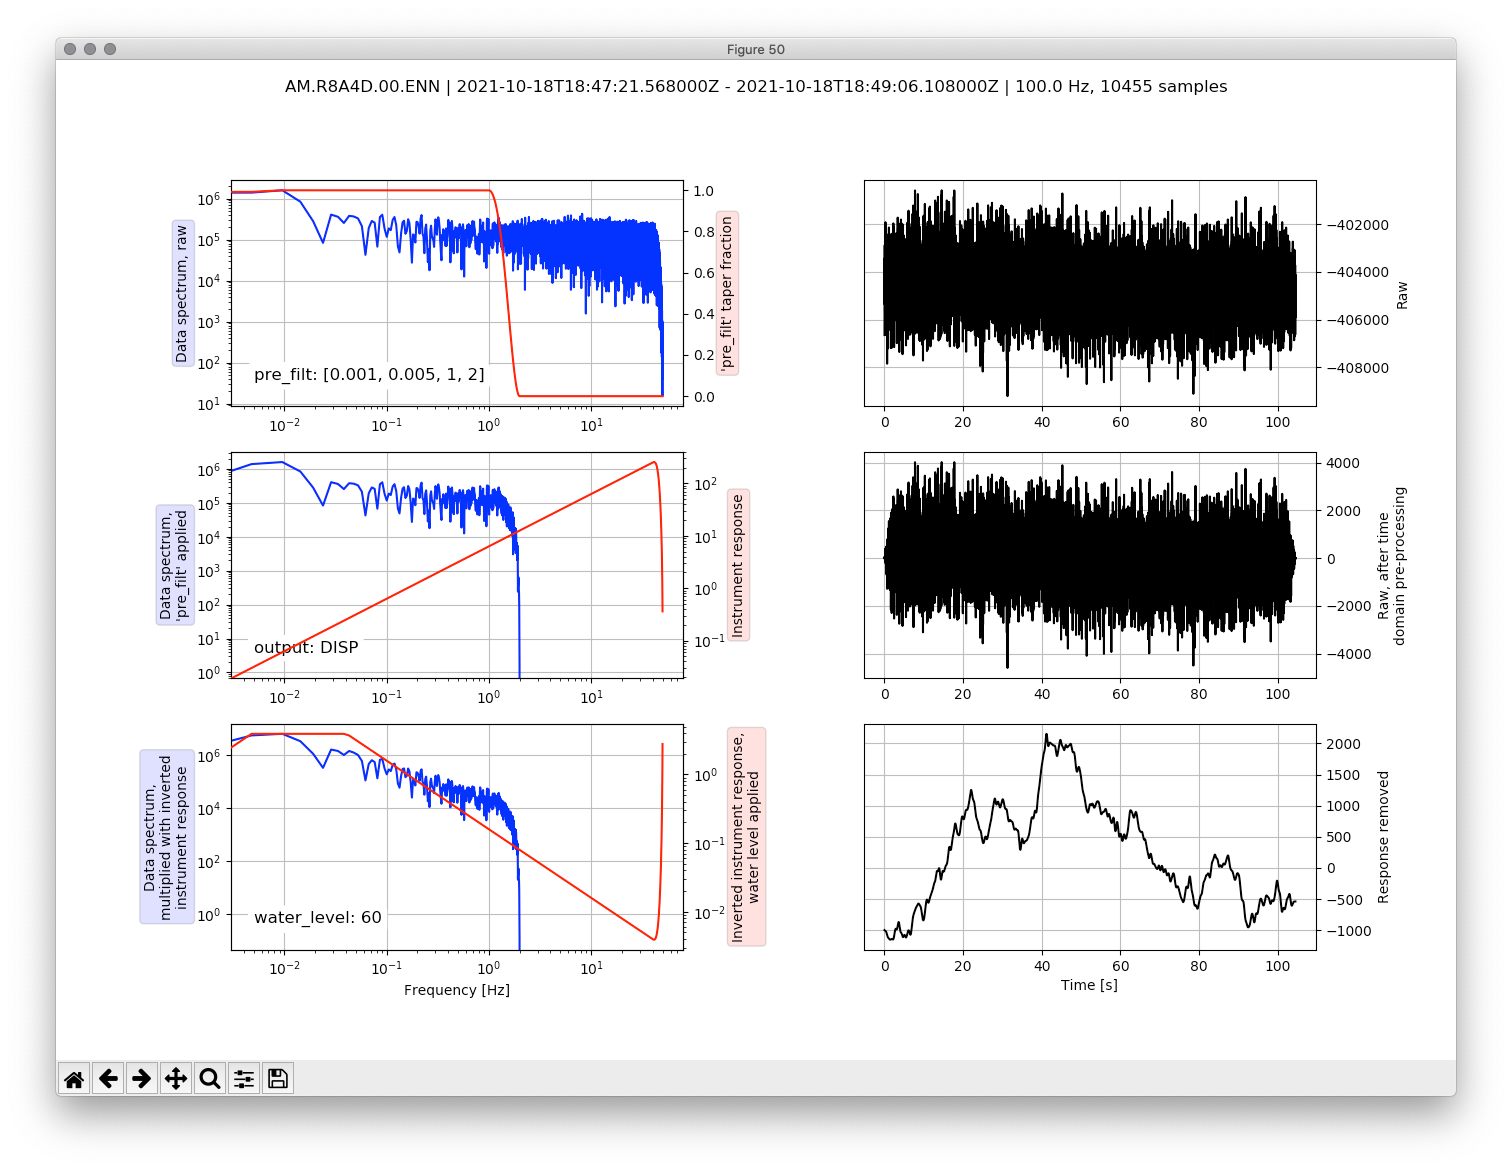
Q1: Can I somehow force the servers (or my shake, no idea where the coefficients actually are determined) to create the instrument response file from scratch? I find it unlikely that the 9 decimals in every one of the 38 numerator coefficients would be the exact same in different response files that would be created based on different data - yet that’s what I see. And when I use remove_response on the data and output displacement, I still get values that are wildly out:
Which leads me to Q2: What are the expected performance specs of the MEMS sensors we have in the RS4D? By attempting to measure building sway that could be on order 0.5 - 0.005 Hz am I trying to do something that is simply going to disappear in the noise floor?
Thank you for your post and welcome to the Community.
The cat-toy+frying-pan double floor height pendulum sounds quite sophisticated!
Correct, you cannot get to true ground motion without deconvolving the instrument response from the raw data. We provide an ObsPy example of how to do this here.
Q1: You can check your instrument response file output (poles, zeros, gains) by comparing it to our reference response files which are available for download here.
Q2: Specifications for the RS4D can be found here. The response is flat from ~40 Hz to DC, so the answer depends on the amplitude of the motion.
Thanks Branden for having a look at this. I have in the meantime received my RS3D as well, and I’m running it next to the RS4D for comparison. I’m seeing some strange results. I am using the method you linked to obtain the inventory file from the FDSN
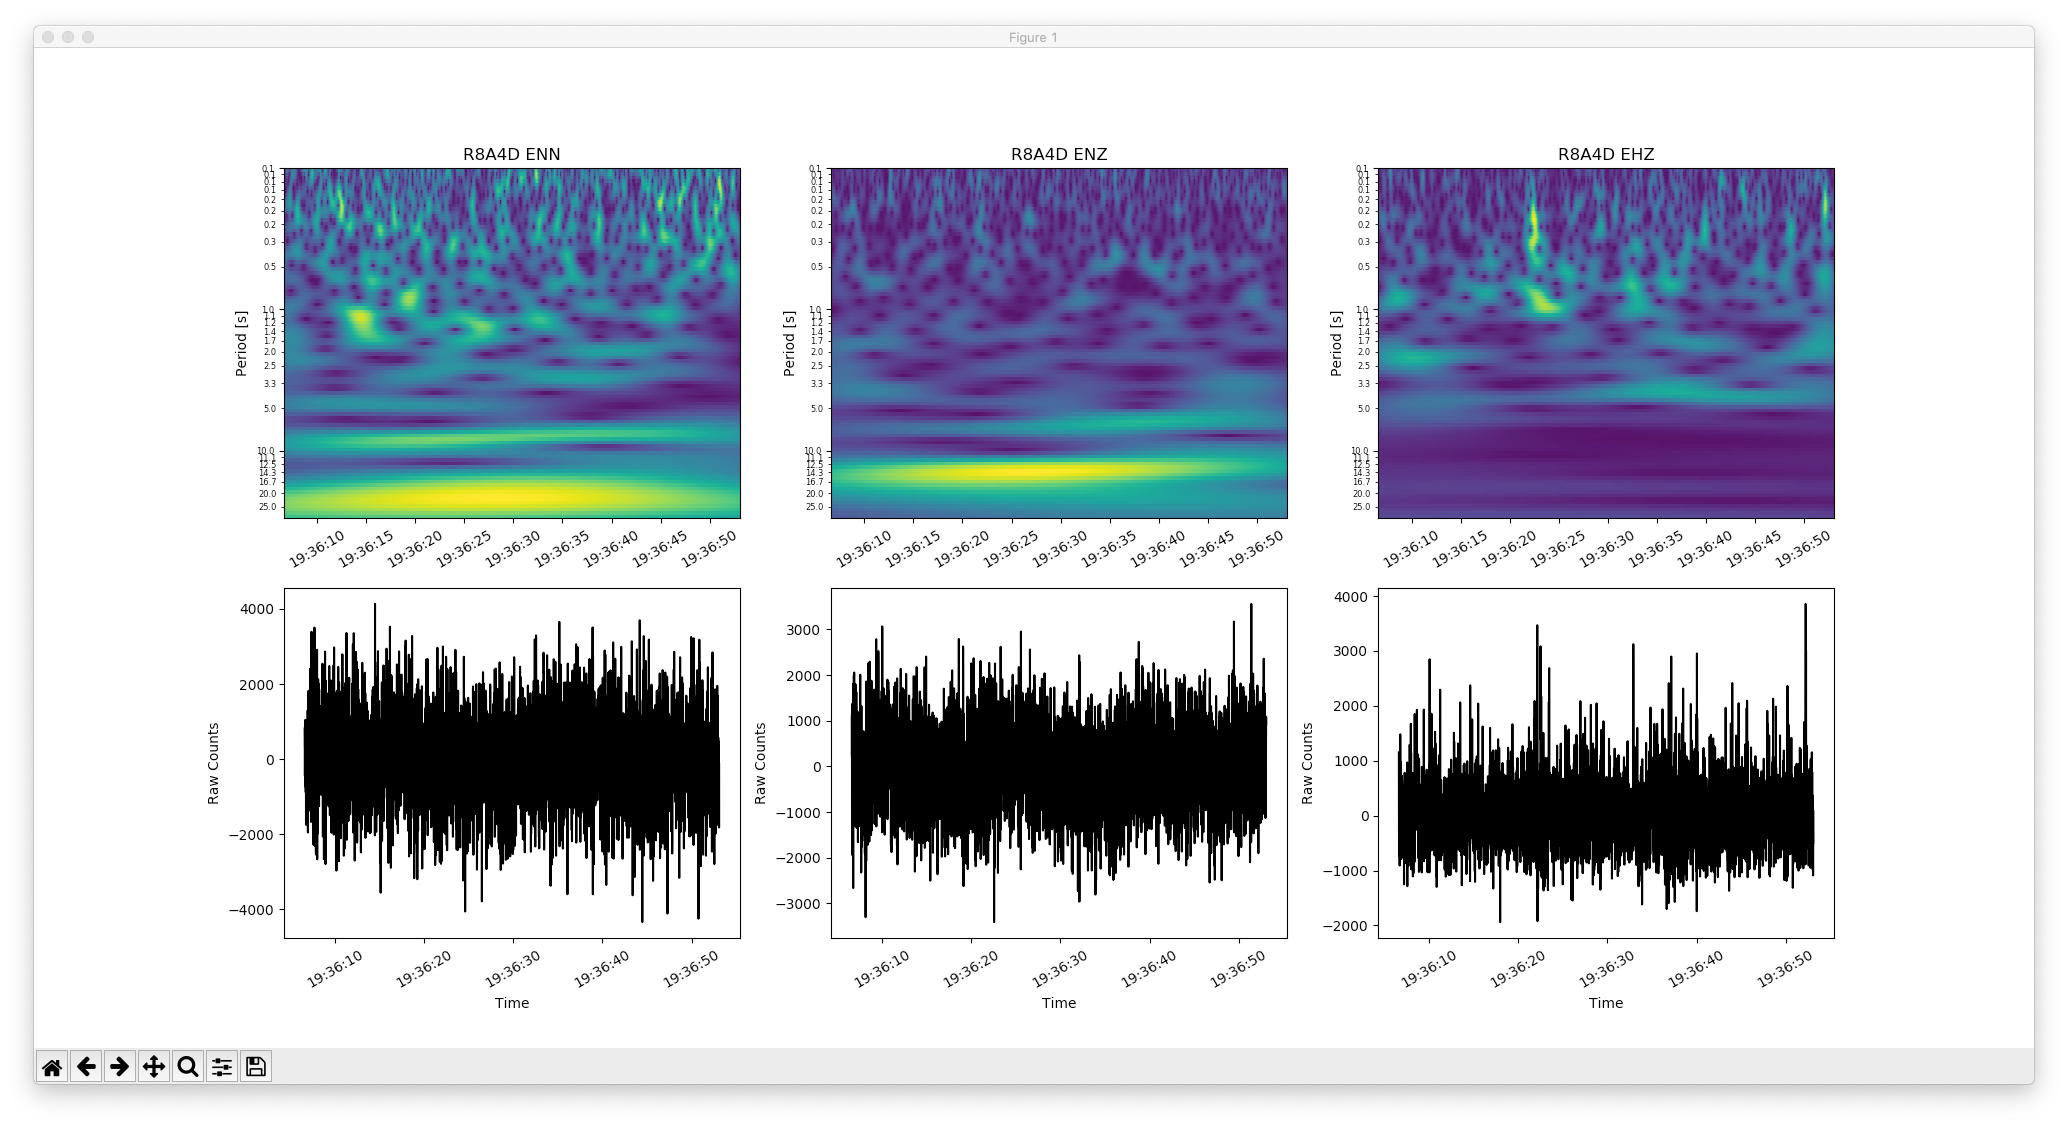
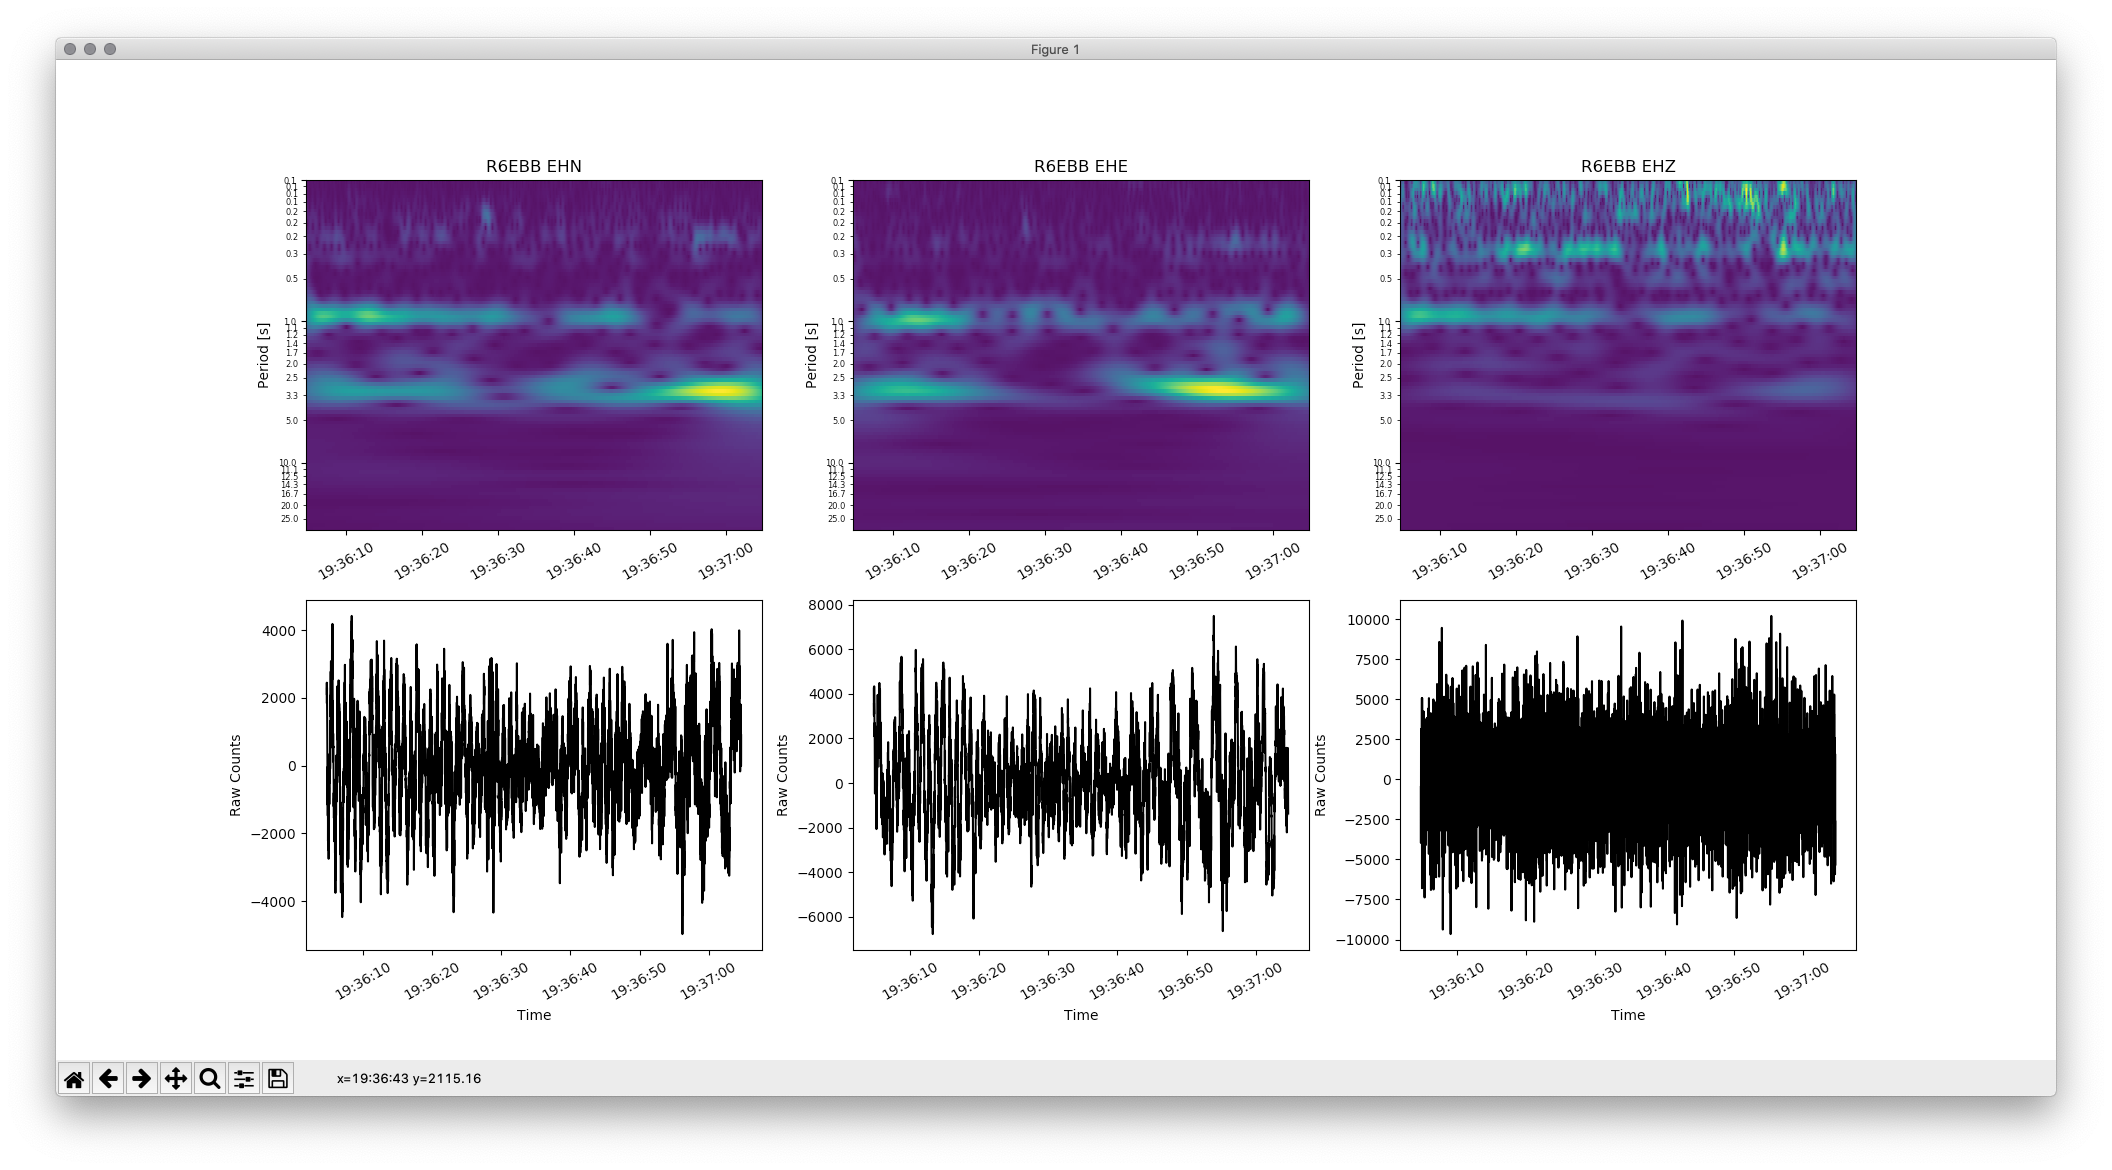
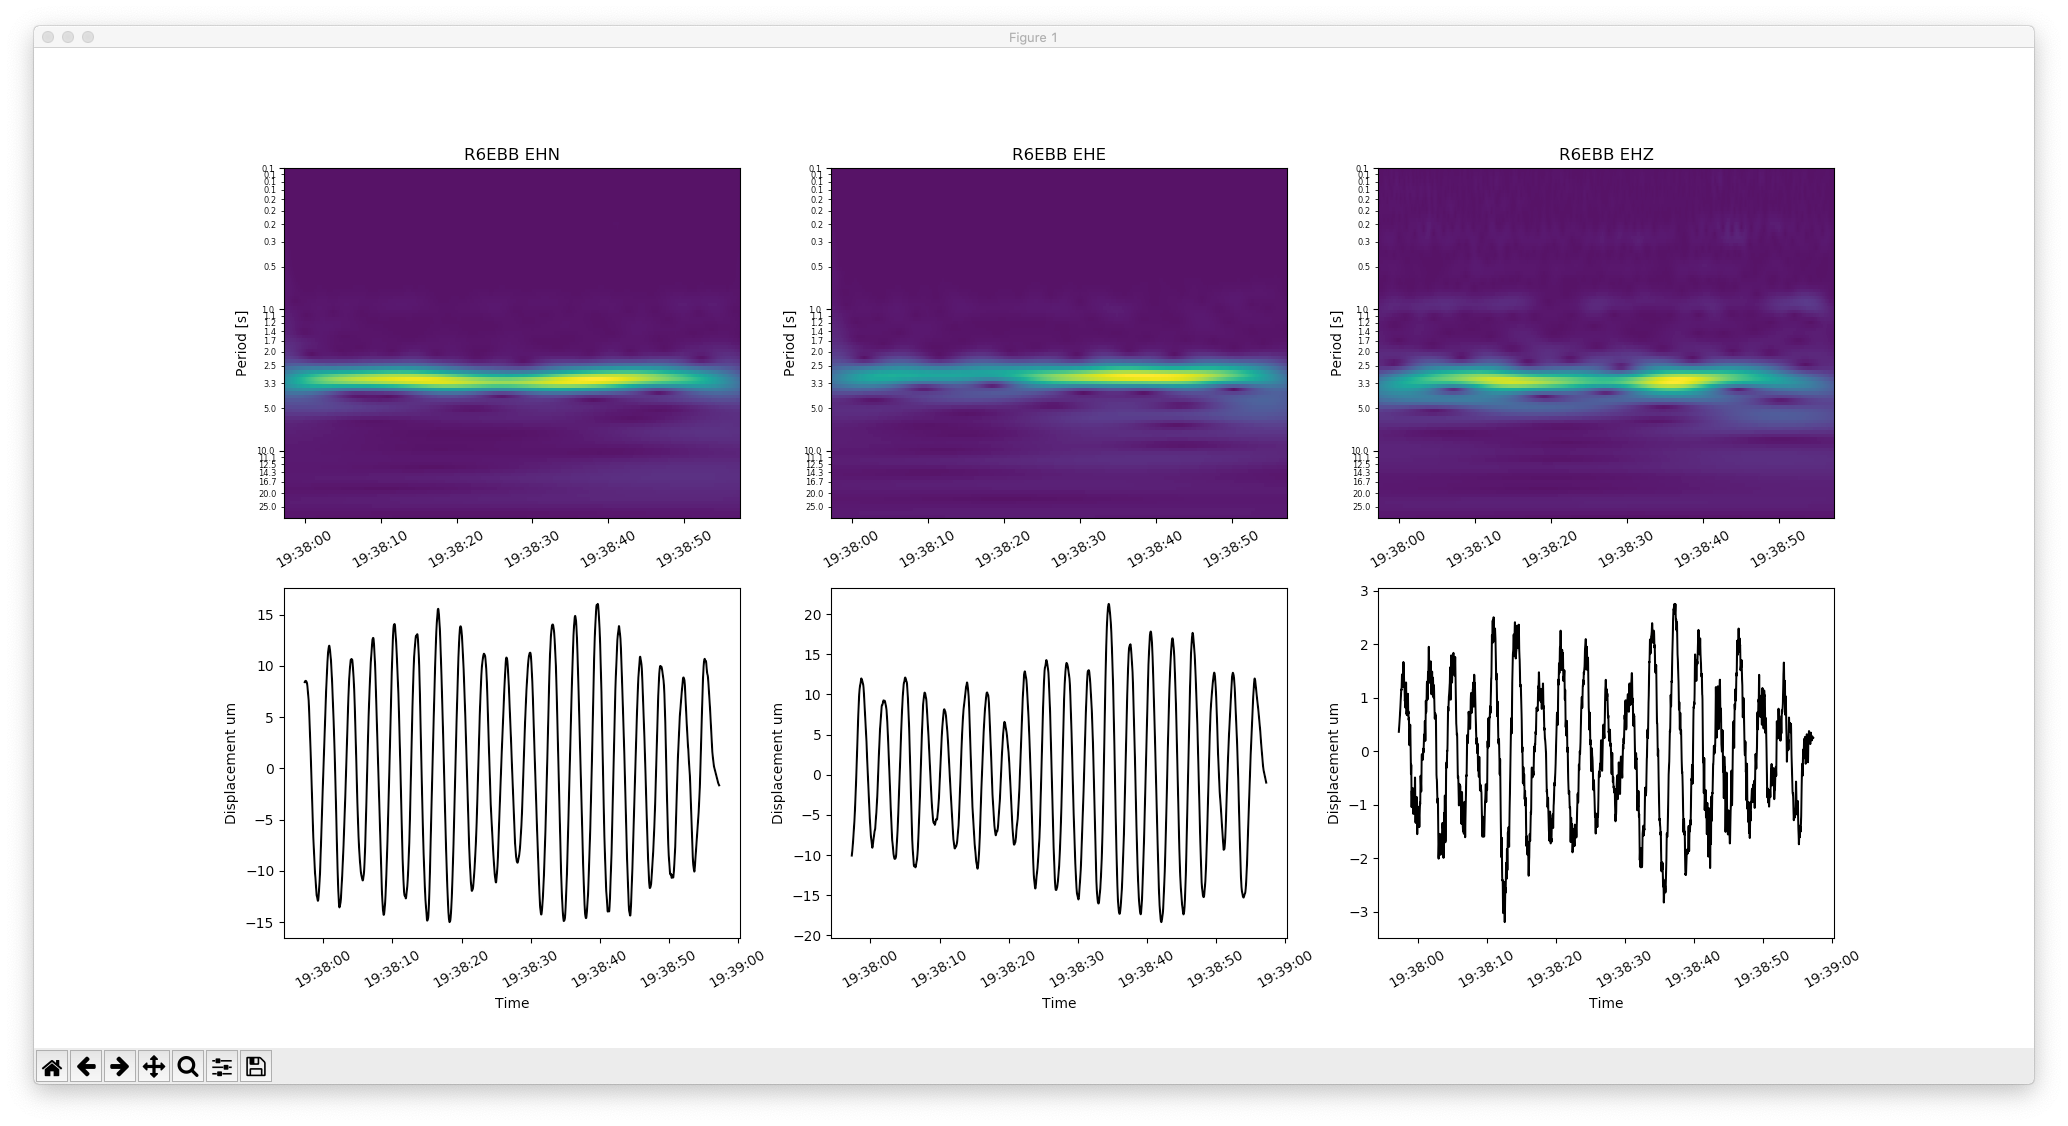
Both the RS4D and RS3D have an EHZ channel, same geophone as far as I can tell. Yet they show vastly different results. The plots show a wavelet transform on top and below the data trace for a 60 second timespan. I changed the scale of the CWT to show log(period) rather than log(frequency).
Look at the rightmost plot, both are the EHZ channels from the respective devices (station IDs in the plot titles). They look nothing alike. I would expect them to show similar features, at the very least in the CWT. The raw counts of course are going to be different. But no matching spectral features? There’s a distinct 1s and 3.3s oscillation in our building, I can see the 3.3s oscillation in the accelerometers ENN and ENE when we have strong wind (not shown here) so suspect that this is a real signal and not instrument noise.
The RS3D is showing powers at those periods as well even now with no wind, no surprises there as the geophones are much more sensitive than the accelerometers.
I’m retrieving the instrument response file as per the obspy example you linked:
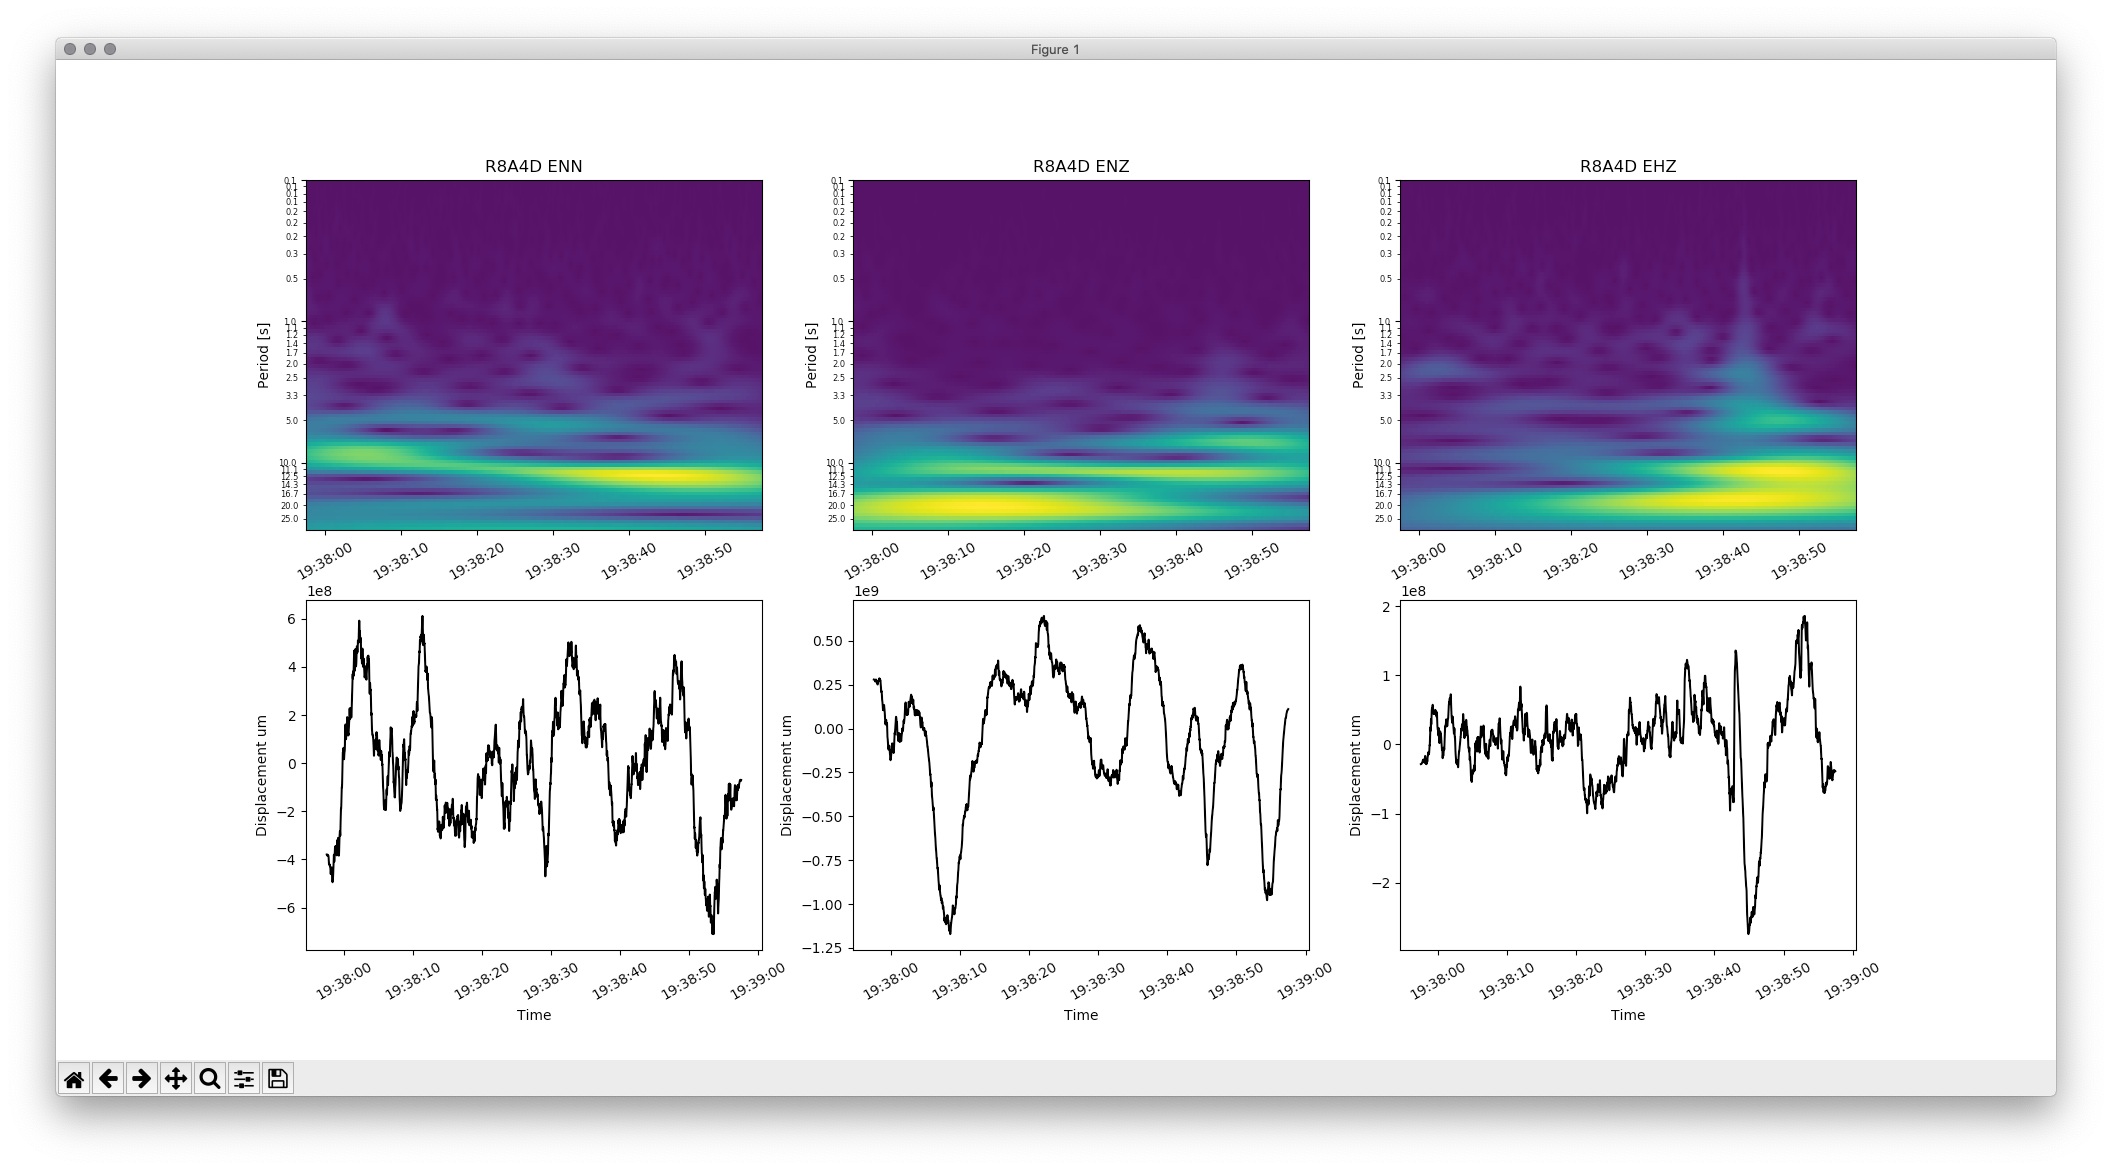
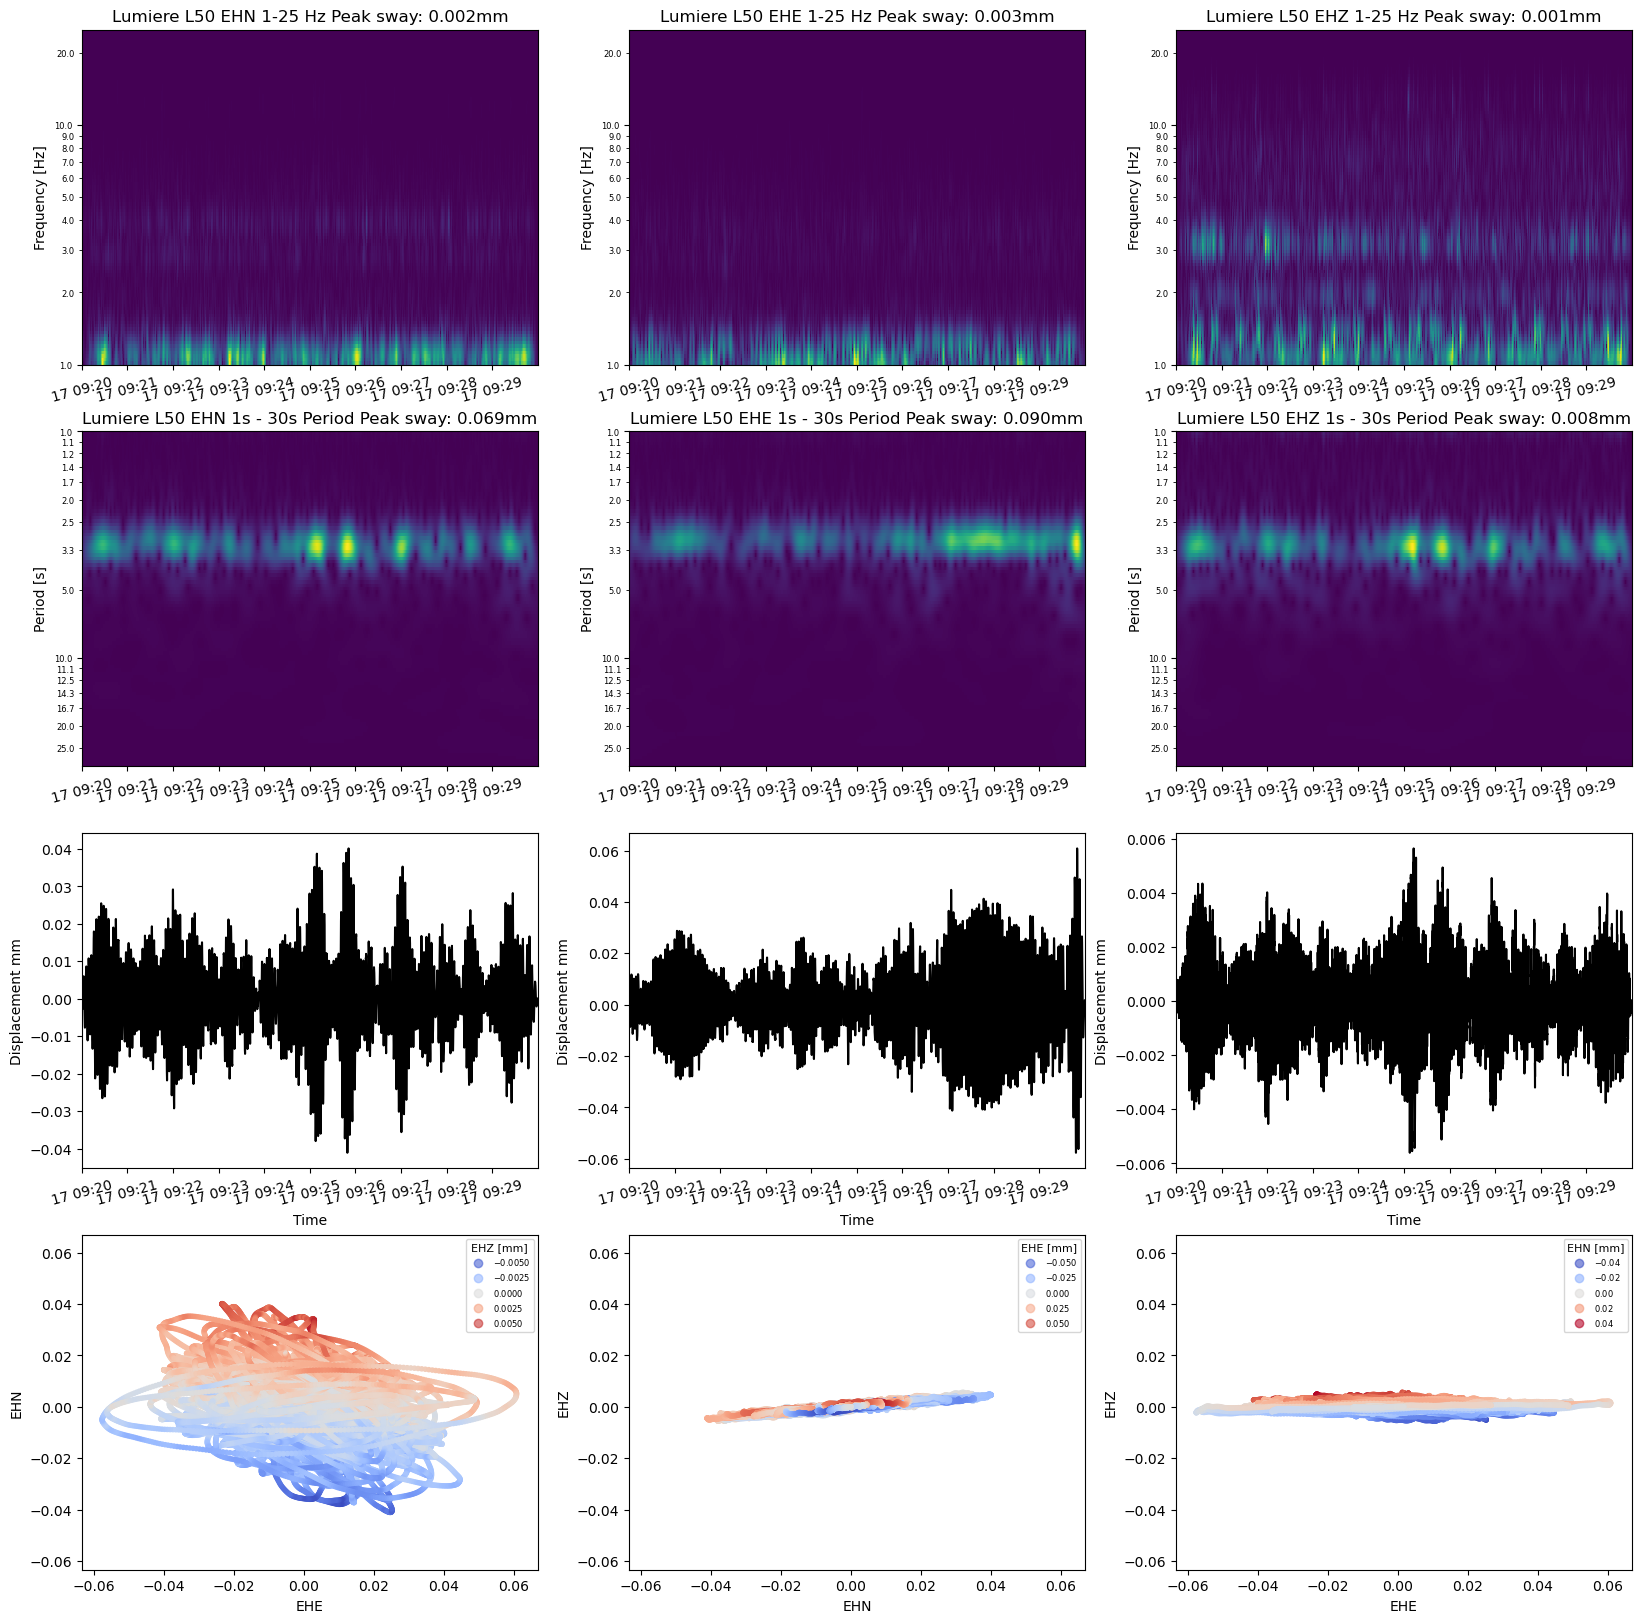
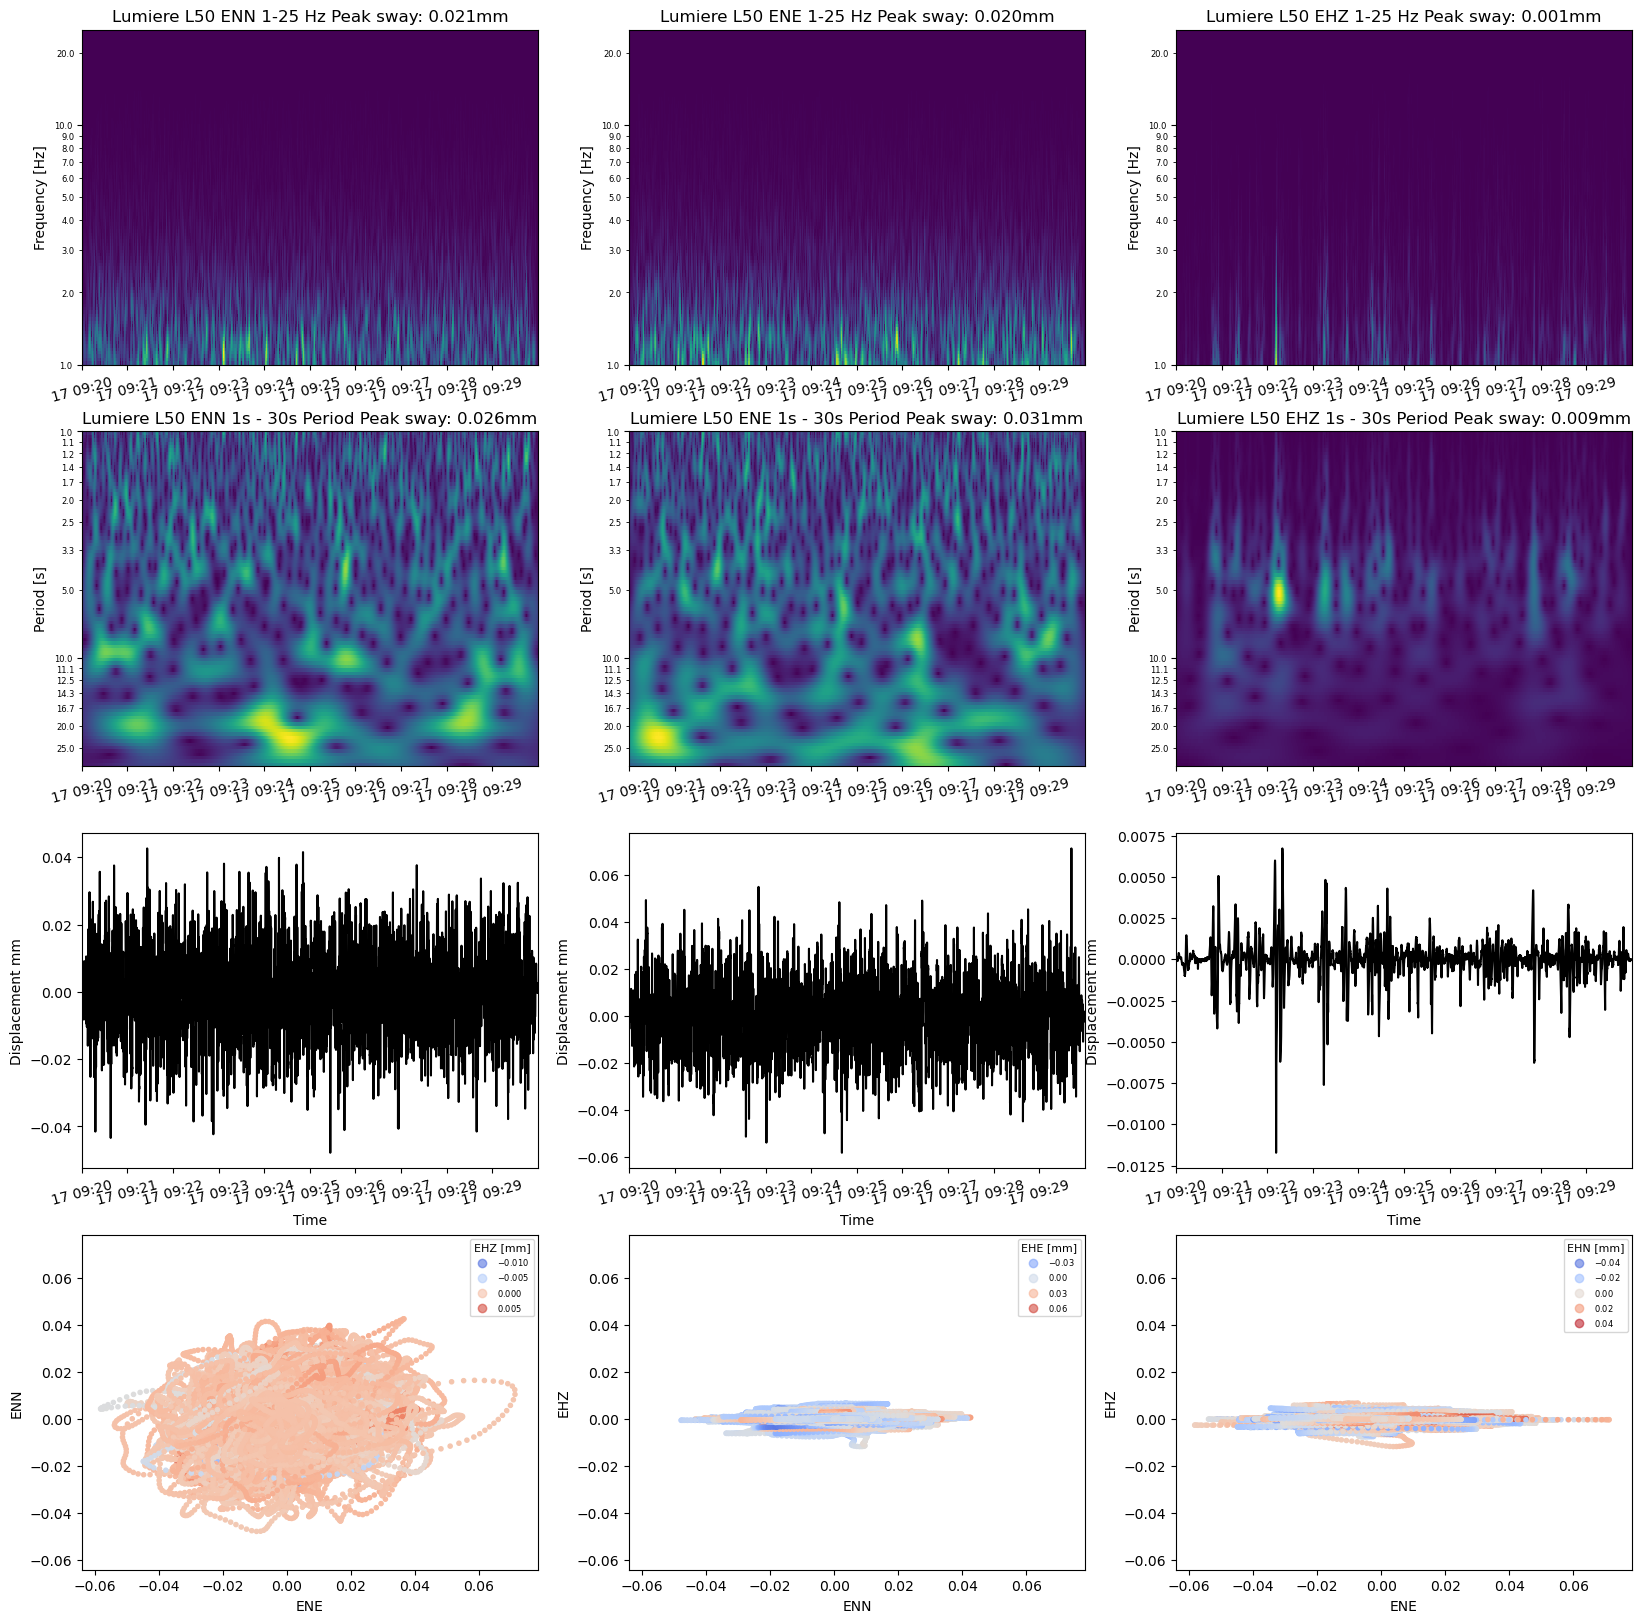
This works fine and provides sensible results for displacement with the RS3D as shown in the plot below. But for the RS4D, not even the EHZ channel looks similar. I think it should show similar features to the EHZ channel on the RS3D.
Do you have any thoughts on what might be going on here?
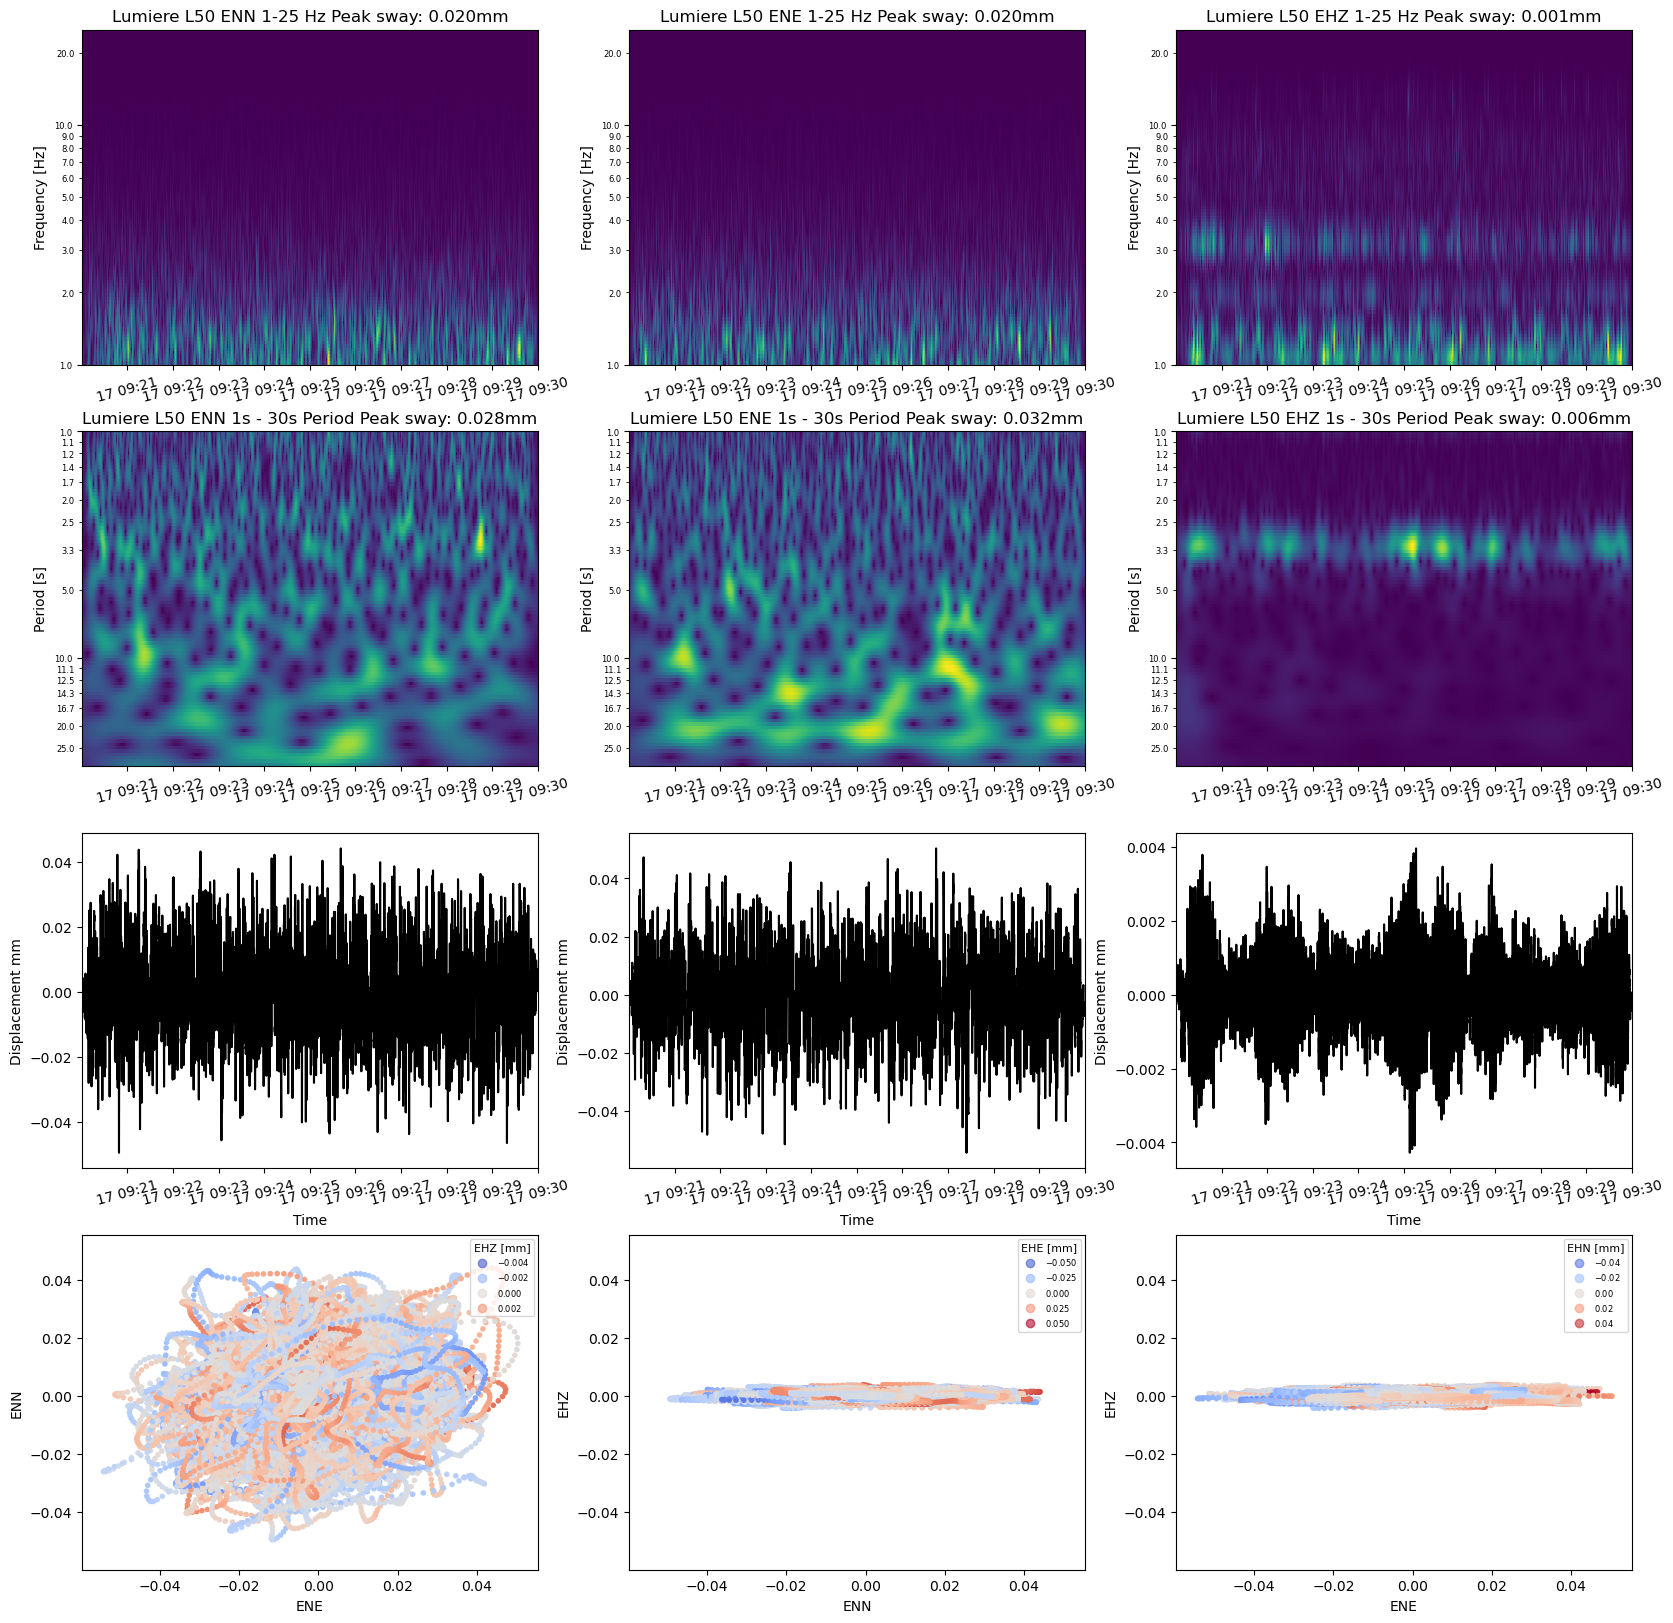
Here’s a zip file for download containing a 1 hour miniseed format data sample for each channel in the RS3D (R6EBB) and 3 channels ENN/ENZ/EHZ in the RS4D (R8A4D), along with a photo on how I’ve placed them for testing (note both are facing building north the same way, so axes are aligned between units).
The included plots for the 1 hour data segment show the wavelet transform, the displacement data created with the response file obtained from the FDSN network call described above, and a particle motion plot which in the case of the RS3D looks like distinct signal, and in the case of the RS4D looks extremely noisy.
Note this sample data is on the 50th floor so the largish data variations in the RS3D look legitimate. I placed it at the garage level 5 floors underground for a night and it’s much more quiet down there. I’ve added two 1 minute plots for comparison to the zip file as well. Just look at the particle motion plot in those, looks amazing!
It sounds like despite the issues, you are still having fun and enjoying yourself! Nice particle motion plots
Something in the vicinity of your Shakes is causing massive spikes at 10 minute intervals. It looks to be causing more serious problems with R8A4D.
This looks like external RF interference. The interference could be coming from that big white adapter thing in the middle which I assume is converting wifi to Ethernet. Perhaps start by eliminating that.
When you have eliminated the massive spikes at 10 minute intervals, let’s talk again.
The 10 minute interval Z axis thump is probably the airconditioner compressor turning on, we have these prehistoric monster motors in our AC units that give off an audible thump every 10 minutes or so - so that’s a real signal. I don’t think it has anything to do with the EHZ disagreement between the two devices. I’ve run both of them in the garage independently as well, with identical results. EHZ is extremely noisy AFTER response subtraction in the RS4D when compared to the RS3D - I’m talking many orders of magnitude more noisy!
The white adapter thing is a power over ethernet adapter, I don’t use Wifi anywhere near the raspis to avoid RF interference. Plus they have their wifi adapters disabled.
So getting back to resolving what’s going on here, the statistics for the raw counts for the miniseed data I sent you show about a factor of 4 difference in the standard deviation between the units. That’s a long way off from multiple orders of magnitude, so clearly something is fishy with the instrument response for the RS4D. Note the median is taken before the median offset subtraction (it’s how I normalise the data), hence is a large number (yet almost the same for both units). nsigma is the number of sigmas the maximum data range represents, i.e. (abs(min)+max)/stdev - a good metric to compare dynamic range between instruments, and they’re very close between the two devices, lending further evidence that the device is probably OK, but the instrument response calibration isn’t.
If the RS3D and RS4D are colocated side-by-side as in your photos, the raw amplitudes should match. Unfortunately, they do not and that is what is leading you to think that there might be a problem with the instrument response files. Fortunately, you have an RS3D to compare to that is working fine! @Stormchaser will message you offline to arrange for a replacement RS4D to be shipped to you.
Sorry for the inconvenience and thank you for your patience and willingness to dig so deeply into the problem.
That’s very kind of you, however it may be unnecessary? As I’ve shown, the raw data of the EHZ geo phones in the two units are showing comparable behaviour, it’s only after instrument response subtraction to obtain displacement that the values blow up in the RS4D only.
Unless you’re 100% sure a replacement unit will fix this I’m happy to continue with more experiments to perhaps get the calibration measurements that precede creation of the instrument response sorted out?
Good day @zeedoktor. Yes, the RS4Dś raw data shows me that it has amplitude problems and must be replaced. The differences are considerable in compared to the RS3D and this is unusual behavior. As I see it, there are no instrument response issues. That is a red herring in this case. The problem is with the raw data itself.
My apologies for this issue. We will ship you a new unit to resolve it.
Just received my replacement RS4D yesterday. The accelerometer based ENN/ENE channels are as expected a lot noisier than the geophones in the 3D. I’m now waiting on a signifcant wind event to sway the building to see at which point these become measurable.
Attaching a few plots showing the wavelet transforms in EHZ are essentially identical between the RS4D and RS3D now, looking very good!