Now for something completely different…
About 20 years ago, at our old home about 3 miles away, I hooked up a sledgehammer to an electrical switch and used this to trigger sampling from my DIY swinging gate seismometer.
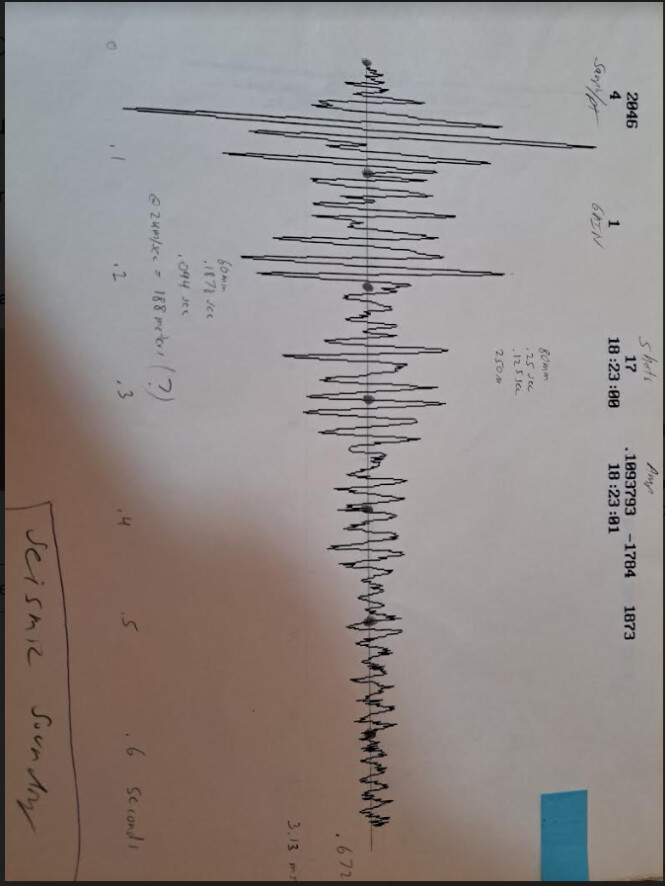
I recovered an echo from about 0.2 seconds down. At an estimated 3 km per second this represented a distance of about 300 meters under my feet.
Here is an image of that echo:
So…it’s 20+ years later and I have the RSBoom, which works very well, but I cannot trigger it.
What you can do is detect large, timed pulses in the input waveform, select out a fixed array after that and then sum them up, coherent in time.
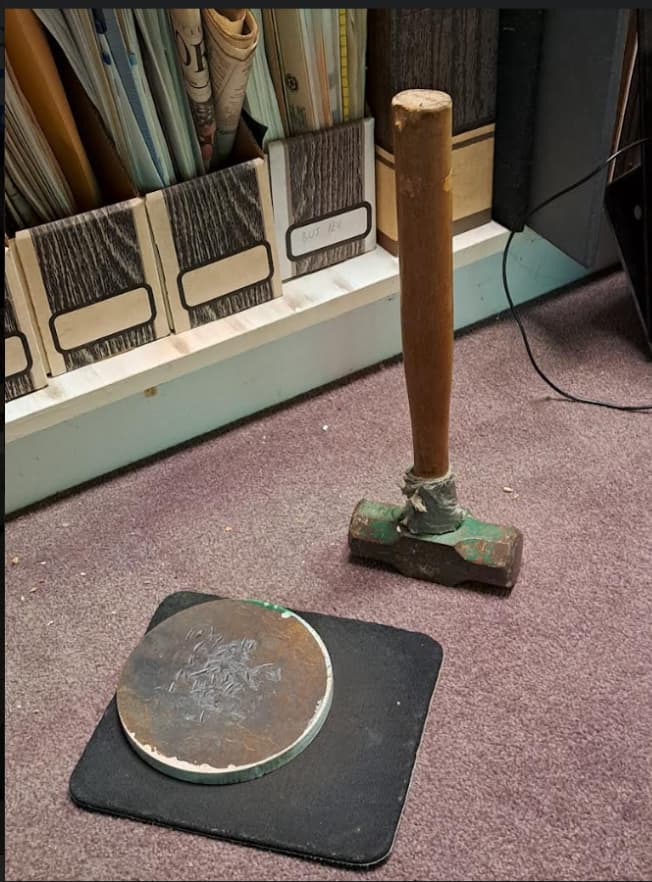
To make the large pulses the following equipment is used:
A two pound hand sledge
An old mouse pad (to reduce noisy bouncing)
A 1 cm thick steel plate
Start at the top of a minute for ease of brain strain and then strike the plate at 20 second intervals. Here is the gear:
I used the read mini seed Matlab/Octave program to decode the signals into Octave arrays;
The q7.dat file was made by first copying the active fle to /tmp on the RSBoom. Then I used sftp to move that file to my Ubuntu instance on my laptop. Then I used the Windows file manager to move the file to my default Octave directory.
The first Octave script was echo2.m as follows;
X = rdmseed('q7.dat','simple');
mm=mean(X.d);
ss=X.d-mm;
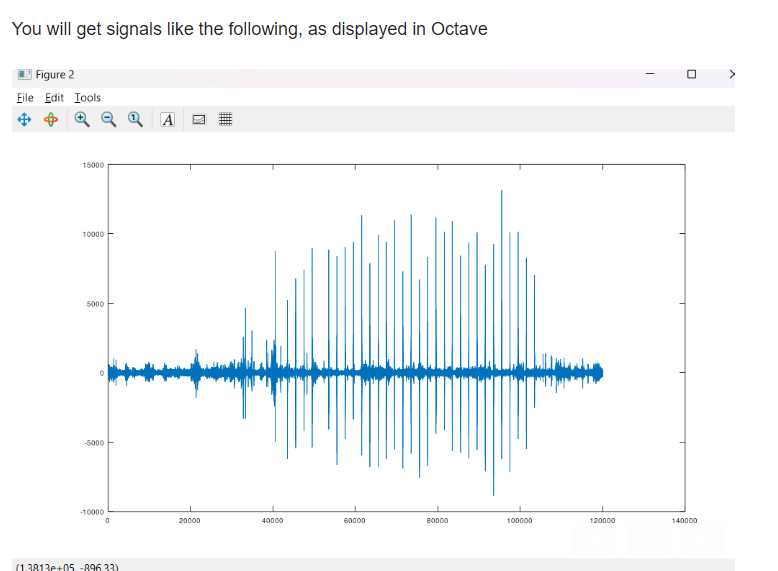
plot(ss(6900000:7020000));
#plot(ss);
It lets you view and then guide your data selection, as the hammer strikes are a very small part of a day’s data.
The main Octave script is echo1.m as follows
X = rdmseed('q7.dat','simple');
mm=mean(X.d);
ss=X.d-mm;
ss=ss(6900000:7020000);
figure;
plot(ss);
ic=0;
jc=1;
ssum(1:1501)=0;
while (ic<=120000);
  ic=ic+1;
  if ss(ic) >5000;
    ic, ss(ic);
    ic=ic+5;
    ipeak(jc)=ic;
    jc=jc+1;
  endif
 end
 jcmax=jc-1;
 jc=1;
 while (jc <= jcmax);
  ik=1;
  for ic= (ipeak(jc):ipeak(jc)+1500)
   ssum(ik)=ssum(ik)+ss(ic);
   ik=ik+1;
   jc=jc+1;
  endfor
 endwhile
figure;
plot(ssum(1:500));
The last plot it displays looks like this :
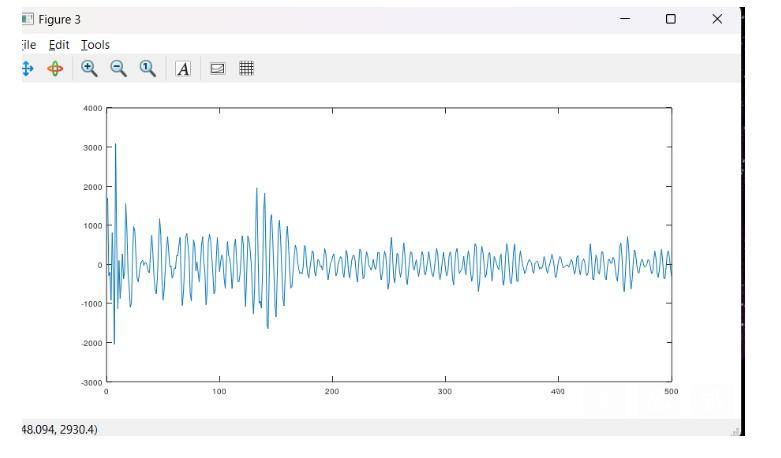
This shows a layer at 1.5 seconds round trip time, at 3000 m/s , that is a depth of 2250 meters below our feet. Eureka! This is probably the transition from surface decomposed granite to solid granitorite or granite. Our current home is in the valley area where there is more decomposed granite over the lower rock layer. Our old home was much closer to the rock layer.
Now I haven’t done any drilling, or even conferred with a real live geologist, but this is a plausible surmise So all you shakers out there, grab my code and your hammers and see what is under your ground! Please share what you see. AND more sophisticated Octave coders could probably come up with more concise code.
Best regards,
David Drake
Caltech '74 shaker since 2023