Hello,
I have an RS4D and I am trying to get the transfer function of the geophone (v6) using the document here
I am using the zeros and poles with a Matlab/Octave script to construct a transfer function. The gain is not specified so I tuned it to obtain the -3db @0.7 Hz as stated in the document. But when I plot the Bode diagram of the system I see that the amplitude at 44 Hz is -0.37 db instead of the -3db stated in the technical specification document.
What is the cause for this discrepancy? Am I missing something ?
Here is the code that I am using, you can run it on https://octave-online.net/ if you don’t have Matlab
zeros   = [0 0 0];
poles   = [-1 -3.03 -3.03 -666.67];
gain    = 693;
sys = zpk(zeros,poles,gain);
[mag,phase,wout] = bode(sys);
mag     = mag(:);
phase   = phase(:);
wout    = wout(:);

hzOut = wout/(2*pi); %rad/s => hz
figure;
plot(hzOut,20*log10(mag));
xlim([0 100]);
ylim([-10 1])
grid on;
xlabel('Hz');
ylabel('dB');
Hello @ZamaZalotta !
This resource should be of help: Metadata - Instrument Response Files — Instructions on Setting Up Your Raspberry Shake
The zeros and poles you are using are correct.
The gain is not.
The gain is 3.996500E+08.
Yours, branden
2 Likes
@ZamaZalotta most of the Shakers who are scripting and programming are using Python (and ObsPy - a seismological toolbox). It is possible there are other users out there who will also have experience with Octave. Once you get your routine fine tuned, I would love to include it in the manual as well. You might also consider jumping over to Python as the ObsPy toolbox is very powerful.
branden
1 Like
Dear @branden
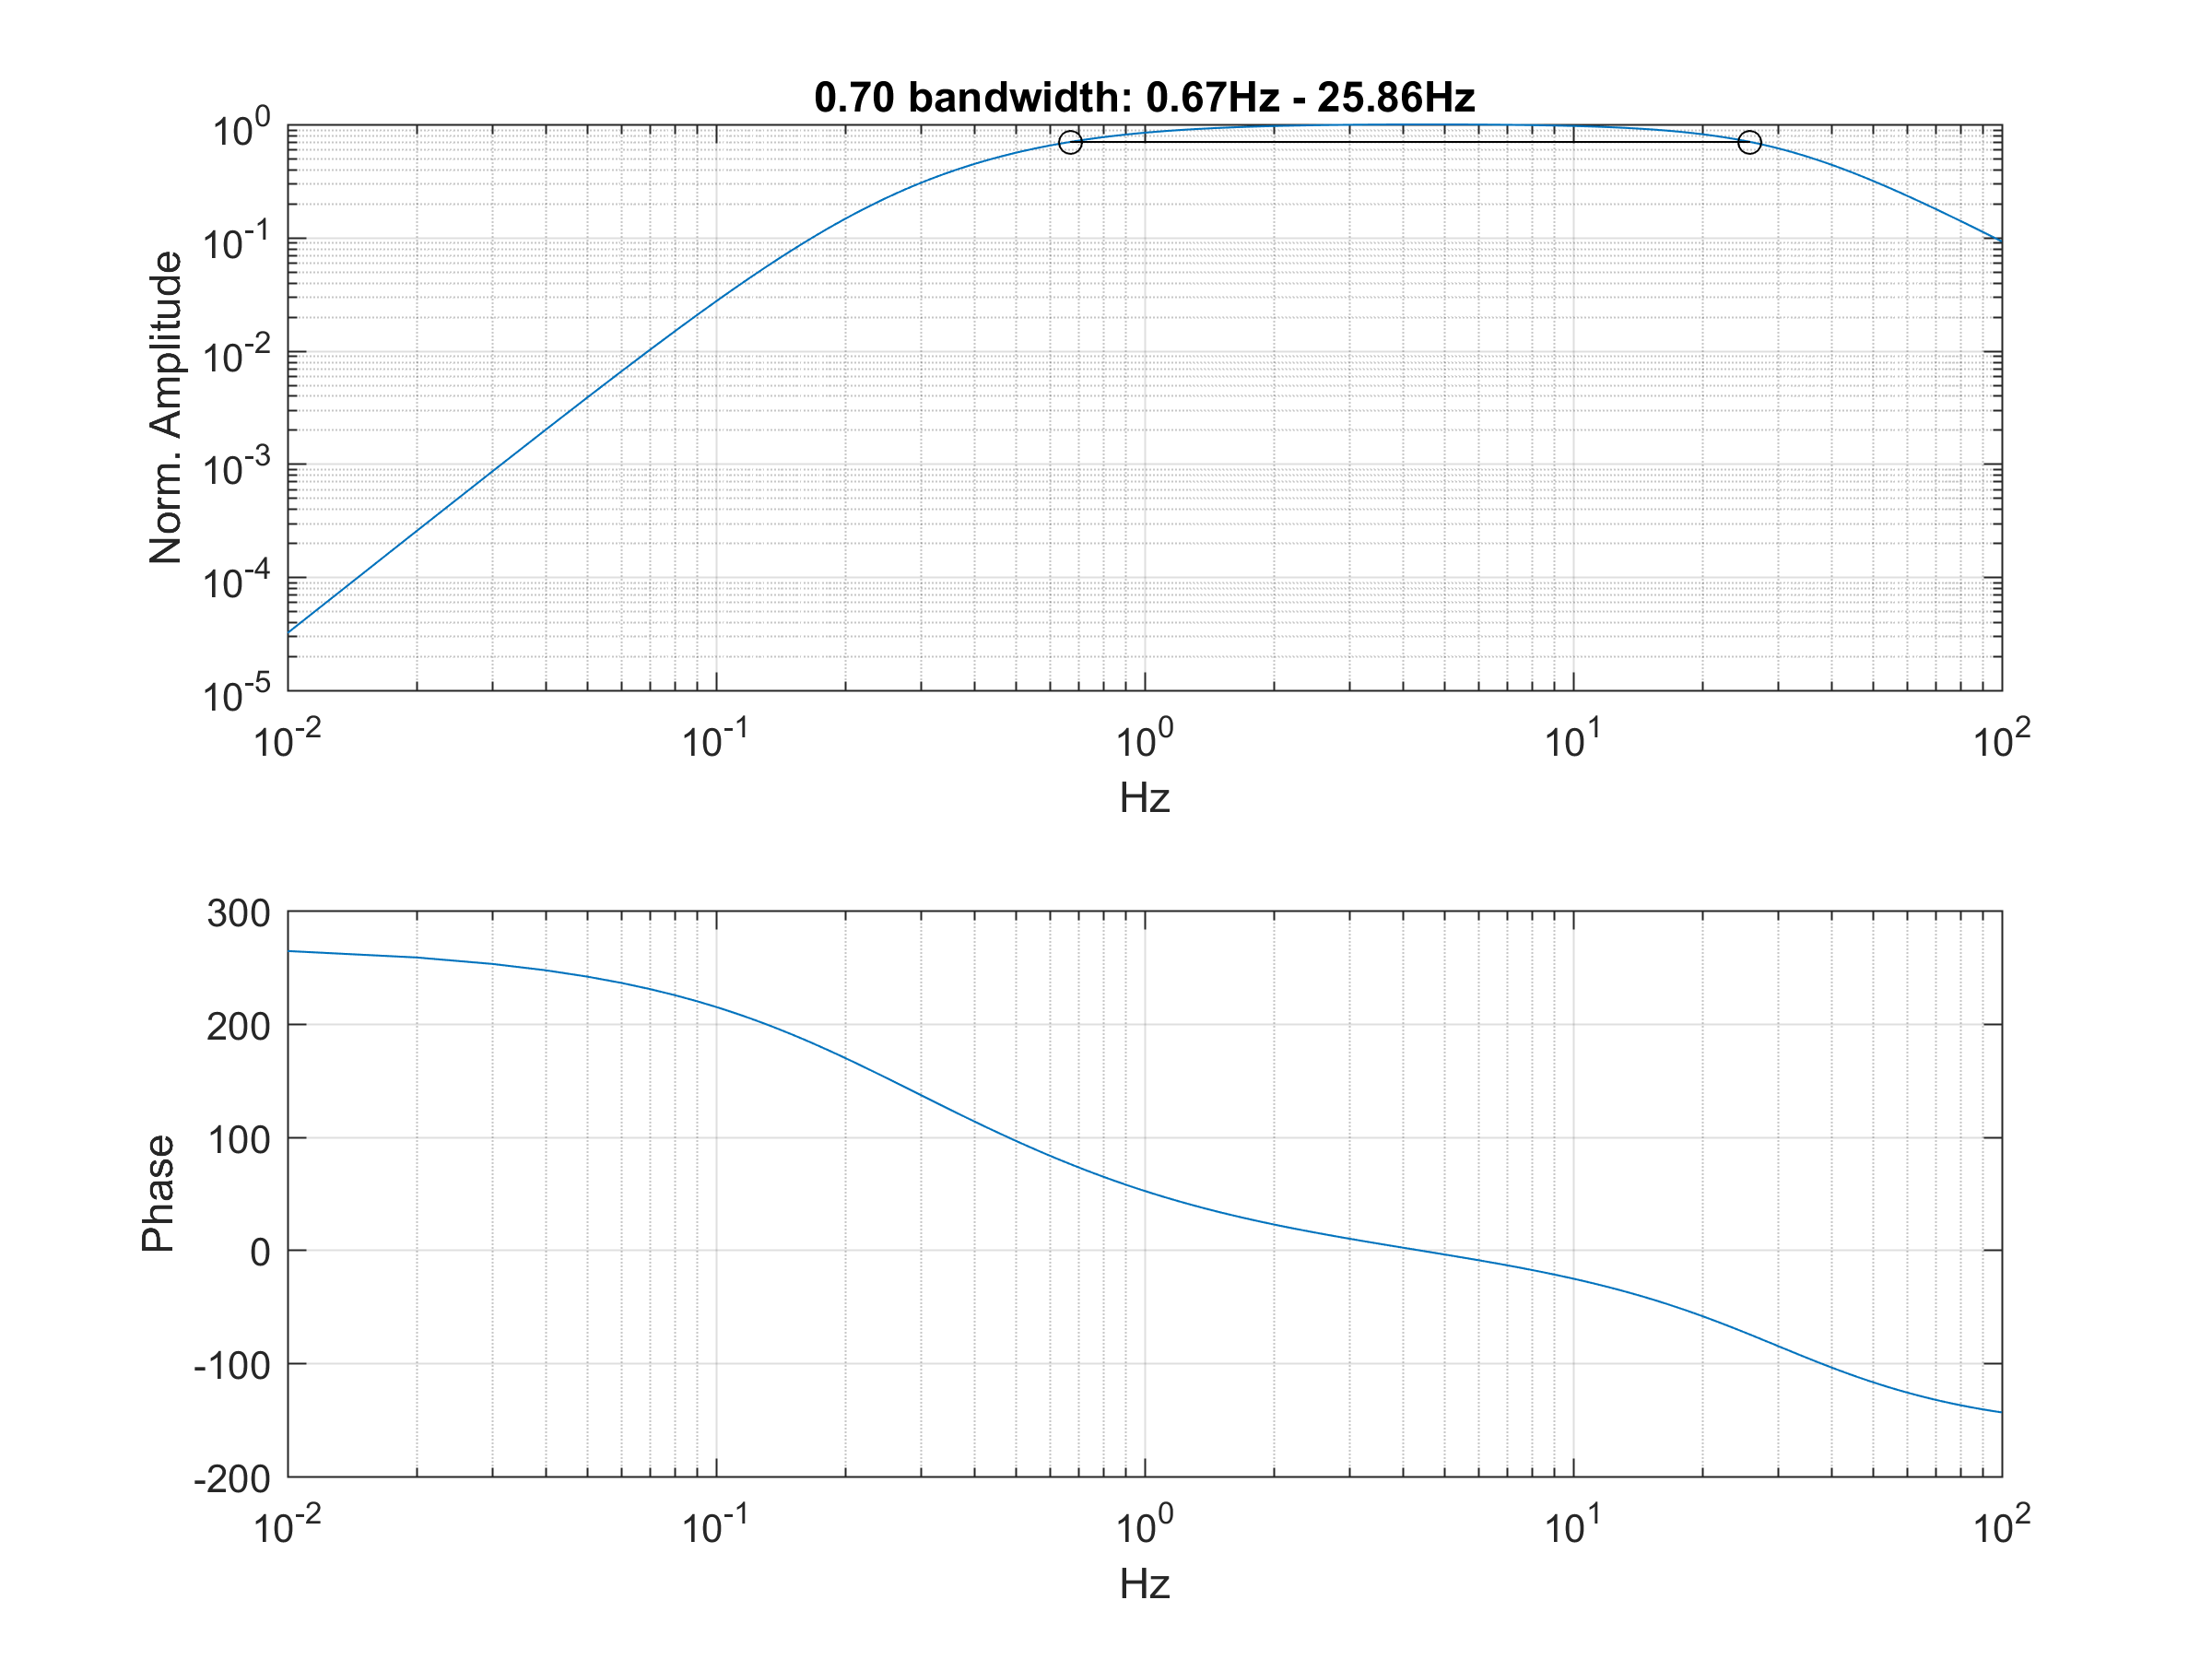
Thank you very much for your reply. The link that you sent was really helpful, I went to the Gempa repository ( gempa SMP ) and found out that my sensor was actually a V5 not a V6. I plugged in the poles and zeros and was able to reproduce the same plot that they have. They plot normalized amplitude so the gain cancels out. I guess that’s what confused me because I was looking for the -3dB cross over on the Bode of transfer function, whereas the manual actually means the frequencies where the maximum amplitude drops to 70%.
Here is my script if you are interested. I have heard good things about ObsPy but old habits die hard 
Cheers,
zama
zeros   = [-5779.15 0 0 0];
poles   = [-163.344+102.457i ...
            -163.344-102.457i ...
            -3.60818...
            -1.41864+0.410935i...
            -1.41864-0.410935i];
gain    = 335815000;
sys     = zpk(zeros,poles,gain);
hzIn    = linspace(0,100,10000);
wIn     = hzIn*2*pi; % hz => rad/s

[mag,phase] = bode(sys,wIn);
mag     = mag(:);
mag     = mag/max(mag); %normalize
phase   = phase(:);

%Find 0.7 (-3db crossings)
attenLvl    = 0.7;
fLow        = find(mag>attenLvl,1,'first');
fHigh       = find(mag>attenLvl,1,'last');

figure;
subplot(2,1,1);
plot(hzIn, mag);
hold on;
plot(hzIn([fLow fHigh]), [1 1]*attenLvl, '-ok');
grid on;
title(sprintf('%.2f bandwidth: %.2fHz - %.2fHz',[attenLvl hzIn([fLow fHigh])]));
xlabel('Hz');
ylabel('Norm. Amplitude');
set(gca,'ytick',10.^[-5:0]);
set(gca,'xscale','log');
set(gca,'yscale','log')


subplot(2,1,2);
plot(hzIn,phase);
grid on;
xlabel('Hz');
ylabel('Phase');
set(gca,'xscale','log');