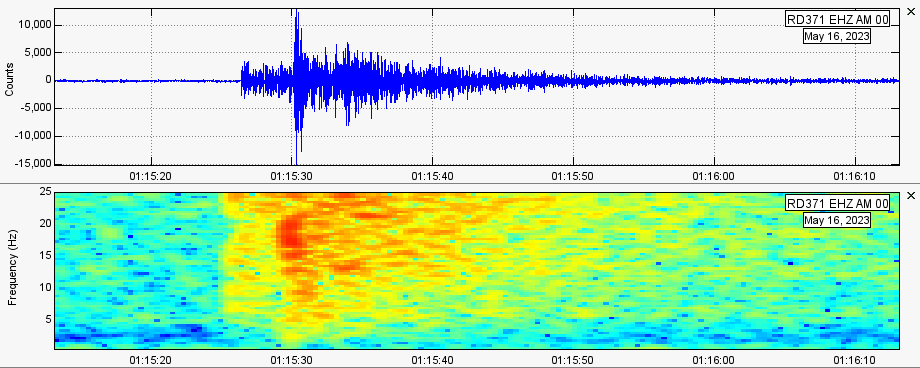
Caught a small local earthquake in Croydon Victoria a couple hours ago, I am about 25km away from the epicenter
4 Likes
Hello Matt,
This is a great example of local earthquake indeed. You can easily see the P wave arriving around at around 01:15:27 and the S wave arriving at about 01:15:31.
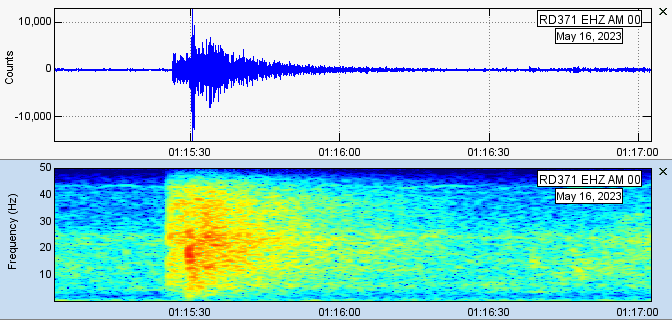
You can also try to expand the spectrogram Y-axis (frequency) range all the way up to 50 Hz, to see how the spectra appears at the higher frequencies.
3 Likes
Ah thanks, I didn’t know you could do that. Here it is with the spectrogram expanded to 50Hz
2 Likes
No problem at all; you’re welcome!
Definitely a very clean and good trace, both waveform and spectrogram.
You can also see the same data on our DataView portal; here’s the page of your Shake: Data View: Raspberry Shake Data Visualization Tool
2 Likes