Both the Dataview and the mobile app have a filter option for each station - Global, Regional, Local, Hyper-local.
Could someone please explain what these are and how to use them
2 Likes
Since you didn’t get a reply yet, I will try. I am sure that you will get a better, fuller explanation from one of the experts on here, but my 2c may help:
As the signal(s) from an earthquake travel through the earth, depending upon they materials they travel through, but mostly dependent on distance, parts of the signal get attenuated differently. If we look at how my R-Shake picked up the recent Samoa (M6.7) earthquake about 8,500 km away:
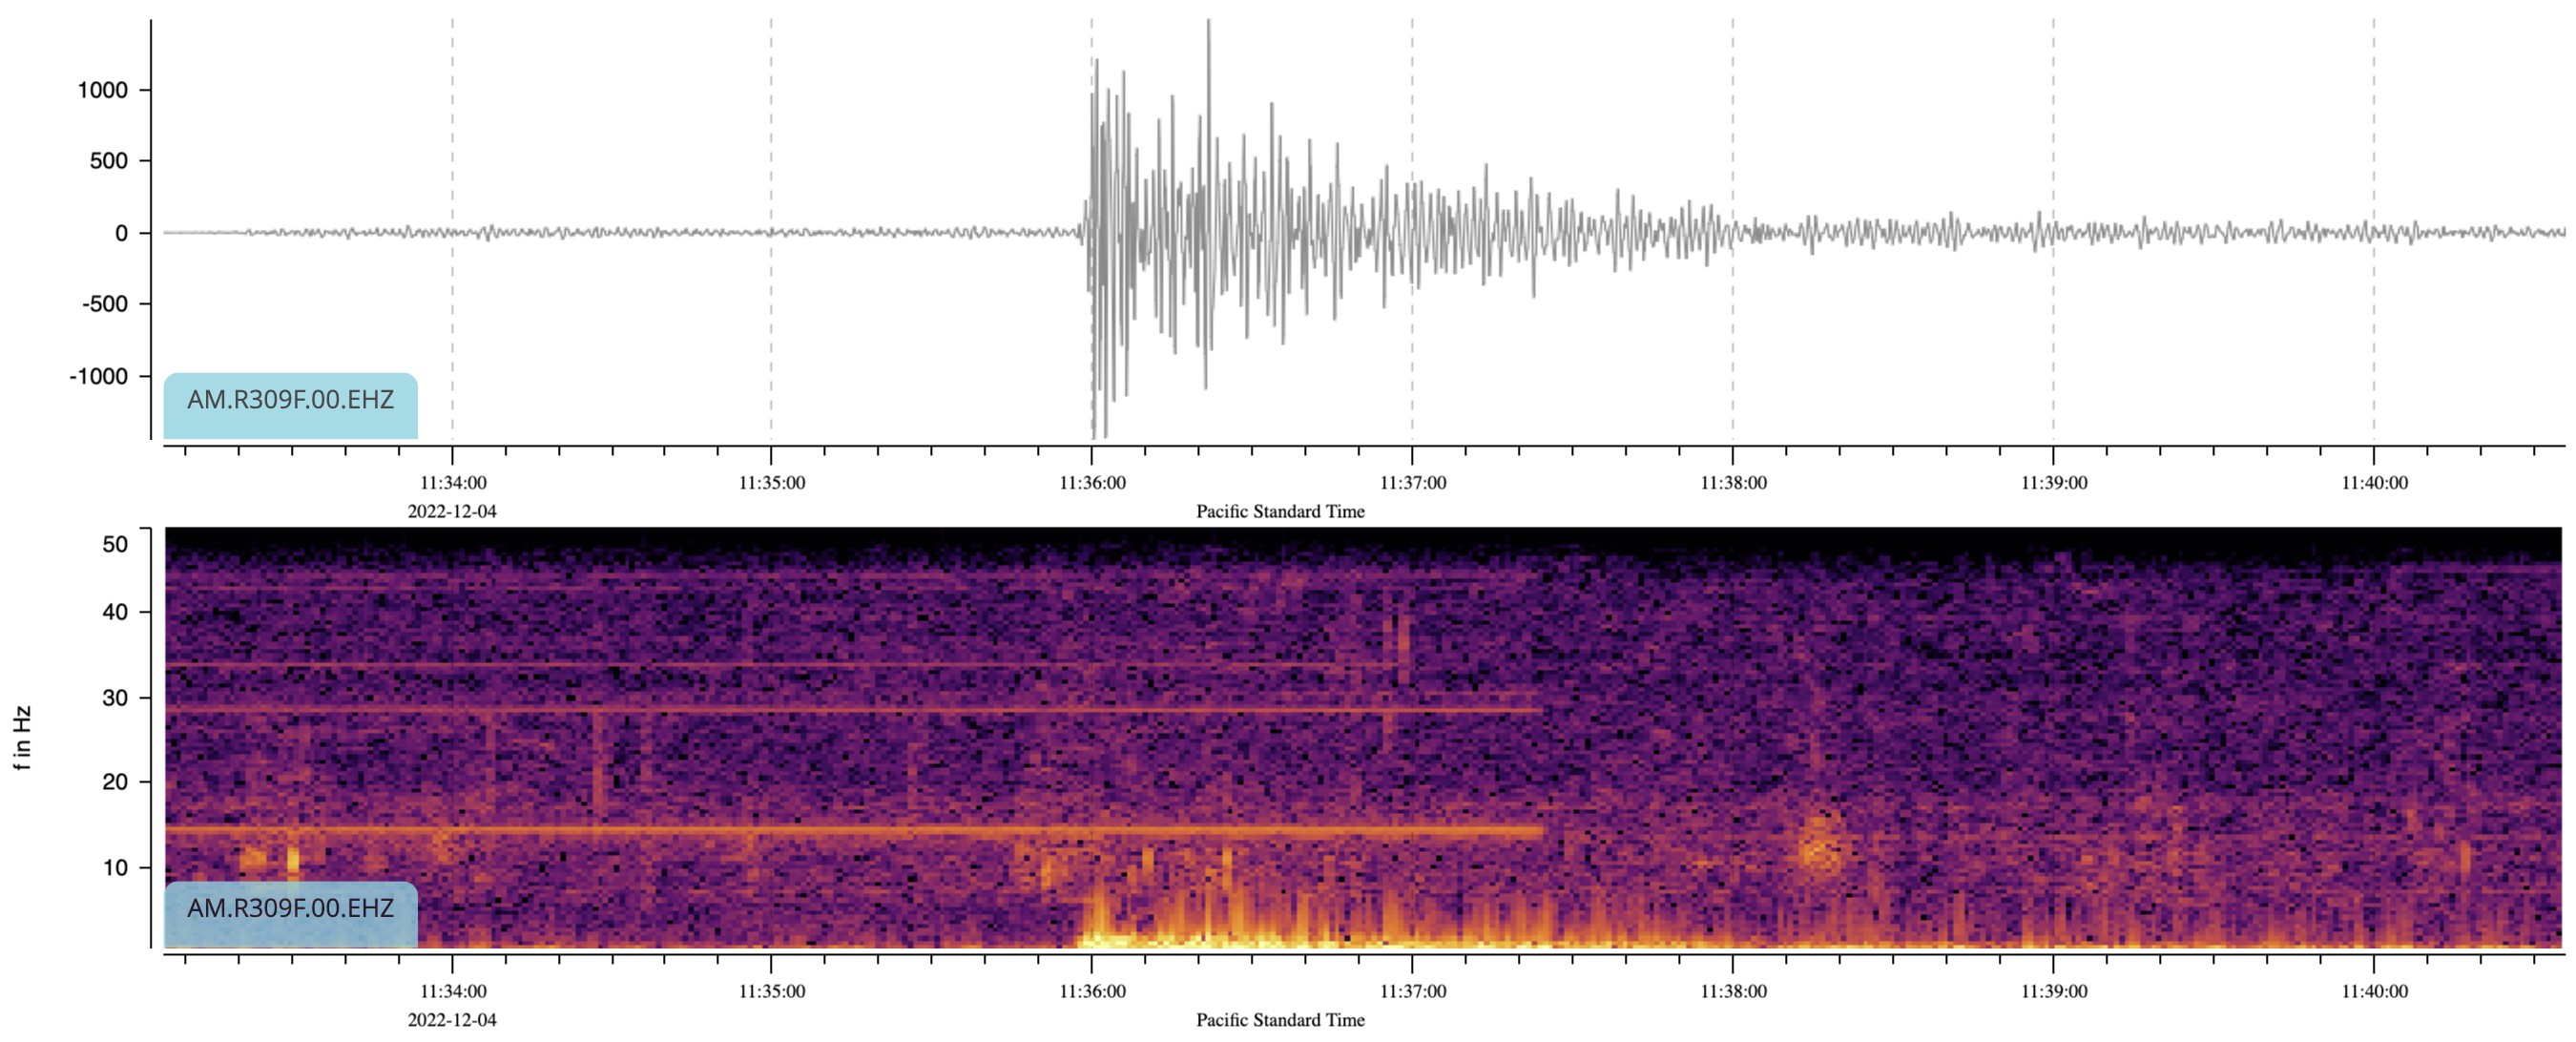
If you look at the frequency intensity plot (lower) you will see two things, the first is a couple of signals that are pretty much certainly from some sort of nearby (a least relatively speaking) human source (idling engine would be my guess), the earthquake signal is all pretty much below 8Hz.
Any signal above that is virtually certainly not associated with the earthquake, and is essentially just noise. If you look at the “distant” filter, it begins to roll off the higher frequencies at 2Hz. Thee filters are not “sharp”, they don’t sharply cut off at the specified frequencies, but “roll off”. The cut-off frequencies for the different distance events are based upon lots of practical experience. They will be mostly right, but if you want to experiment you can always put your own numbers in.
This next event was a very local one. It was only detected by a few stations around the local area:
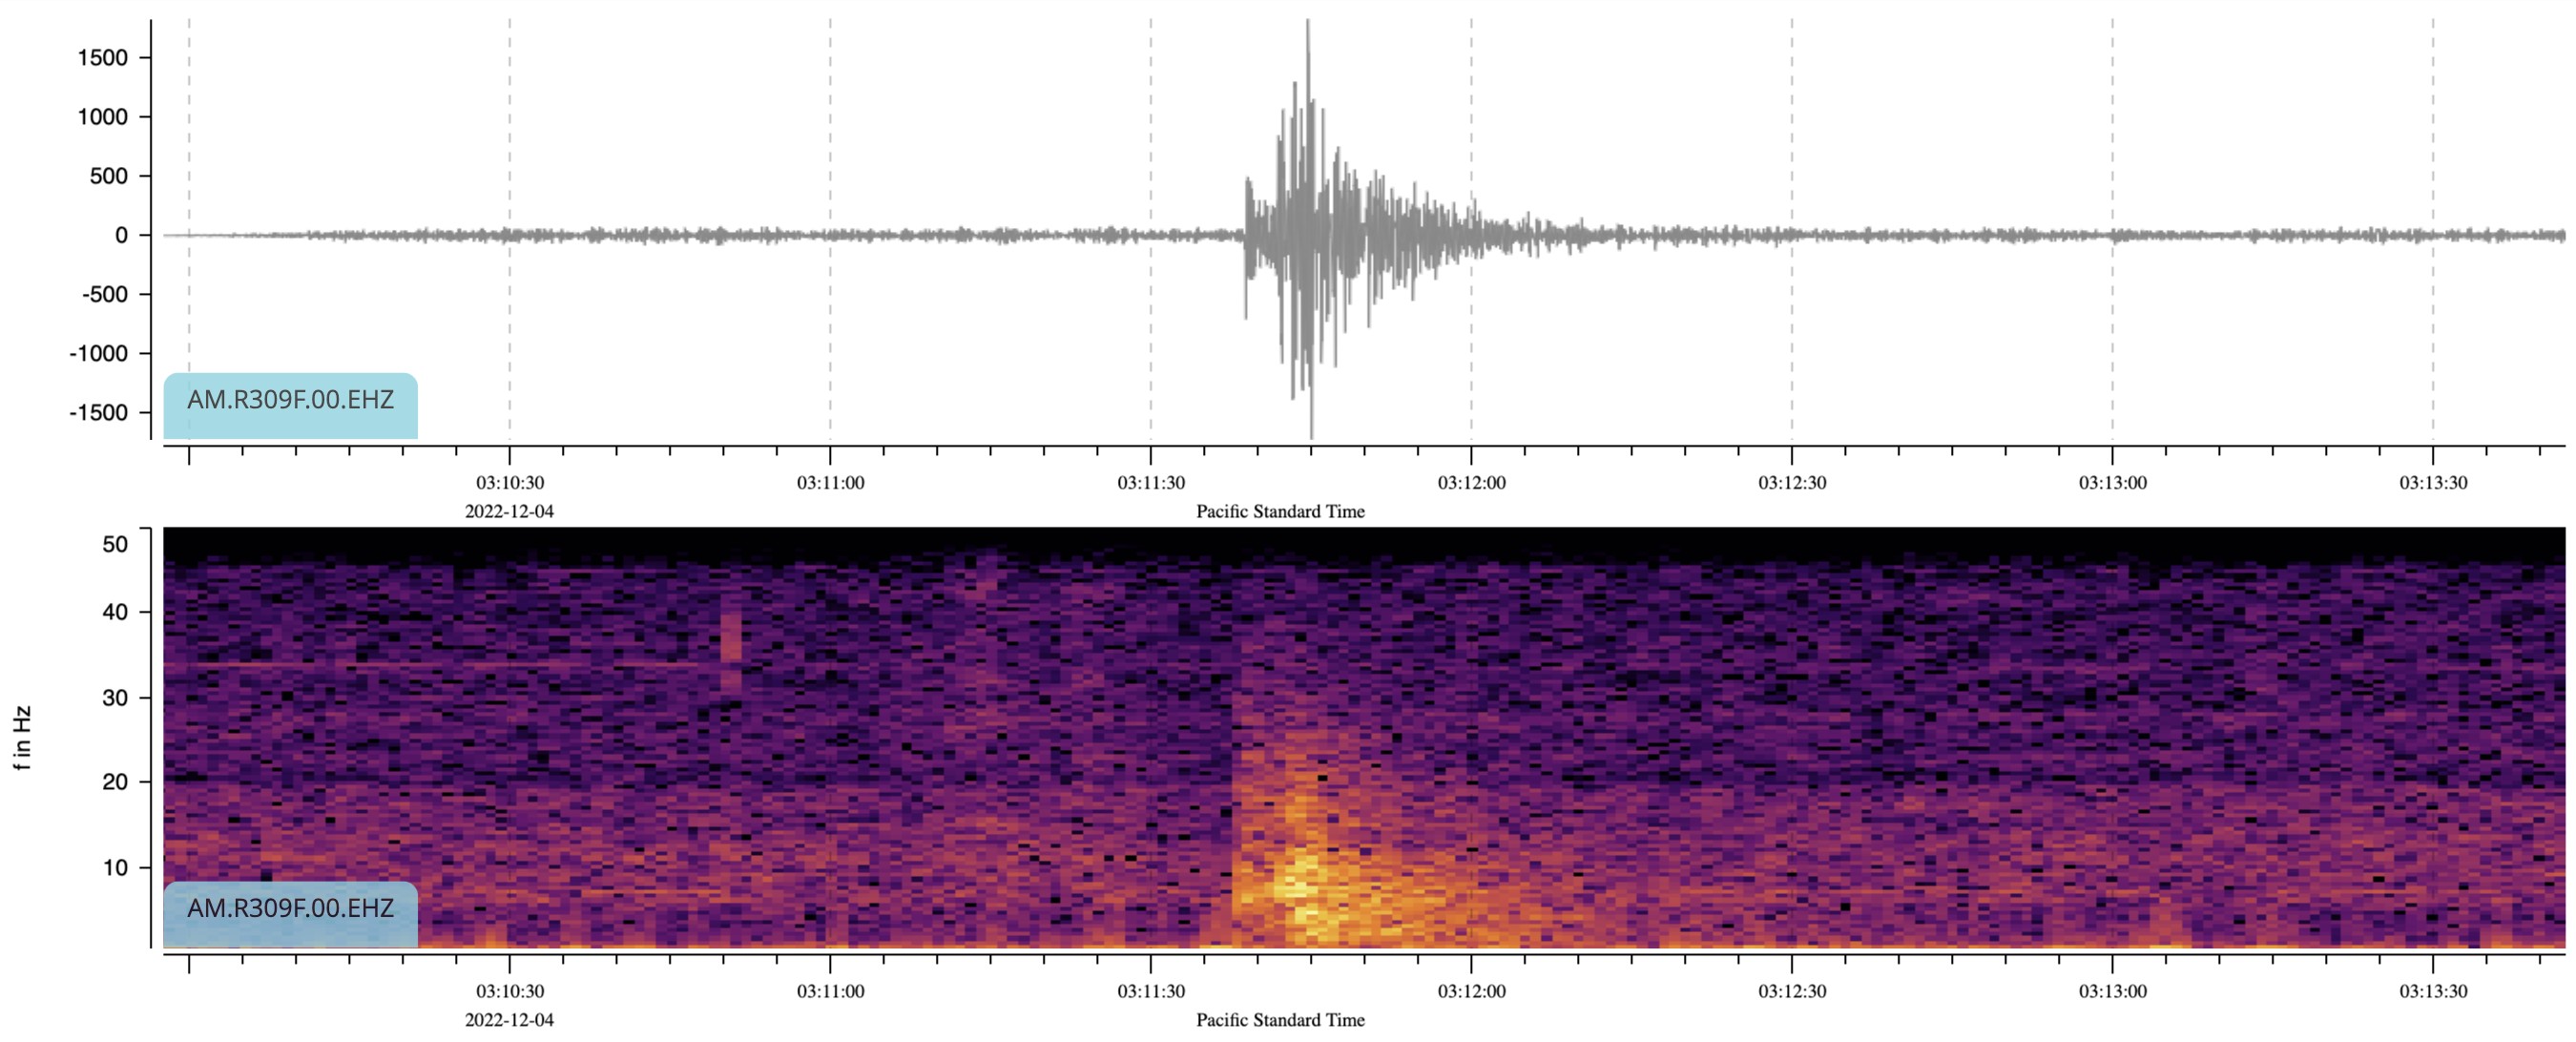
Notice how much more high frequency information is available?
So or this, selecting either no filtering at all or a “local” filter would include all of that higher frequency information in the plot.
4 Likes
Hello HowieL,
Thank you for this very interesting question! Philip’s answer is a great resource to start playing with the various filters that are available on the ShakeNet App and DataView both.
For an overall presentation of the App, we have this article on our Blog: The ShakeNet Mobile App for Apple and Android - Raspberry Shake
The four main filters (Global, Regional, Local, Hyper-Local) are set in relation to the distance between the receiving station (in this case, your Shake) and the earthquake. We can use these approximate distance classes (this is just an example, as there are many classifications available):
- hyper-local events: less than 50-100 km away
- local events: between 100 km and 600 km away
- close regional events: between 600 km and 2000 km away
- far regional events: between 2000 km and 12000 km away
- teleseismic events: more than 12000 km away
What affects the shape and distribution of what you can see in a seismogram can be listed as follows:
- differences in propagation through the various layers of the Earth (as Philip also described)
- the influence of the depth of the Earthquake (shallow event vs. deep event)
The spectrogram (the second plot in Philip’s posts, colored in various tones from violet to orange) shows a visual way of representing the event signal strength over time at various frequencies present in a particular waveform (in this case, an earthquake).
In the case of an earthquake relatively close to your location (local or regional events), the waveform will present higher signal strength in a wider range of frequencies, going from the bottom to the top (from low to high frequencies) of the chart (second image from Philip).
Instead, in the case of an earthquake far away from you (called the technical term, teleseismic), the waveform will present higher signal strength at lower frequencies (first image from Philip).
This is where the filters come in and help you. For example, if you wished to see, as clearly as possible, an earthquake that has happened very close to your location, the Local or Hyper Local filters (that include a wider range of frequencies, from low to high ones) are the best suited to show you the complete waveform and not ‘cut’ important data.
On the opposite side, if you wished to see if you have recorded a large earthquake coming from the other side of the world, as per what we have said before, the Global filter (which includes a very short range of low frequencies) is the best suited for the job.
The Regional filter is a bit of a ‘jack-of-all-trades’ for many earthquakes, I’ve noticed, and you can use it as a starting point to explore the other frequencies.
The ShakeNet App will automatically select the most appropriate filter in relation to the distance between the Shake and the earthquake, but you are more than welcome to play with the other filter options, to see the various differences, and build up your personal understanding of what you are seeing. I’m sure that, in no time, you will be easily able to discern the differences between various earthquakes at a single glance!
If you need anything else, I remain available.
Enjoy Shaking!
1 Like