I’ve found that recently the Gempa app EQInfo Ver 2.0.11 (on an Android phone) cannot access the data and gives this message:
“Unable to connect to server”
In fact, nowadays it happens most of the time, making the app essentially useless.
I’ve emailed Gempa, but got no reply.
Is anyone else having this problem?
Hi @TideMan:
Please download our new app, ShakeNet. gempa GmbH in Germany graciously allowed the Raspberry Shake Community to use EQInfo while ShakeNet was under development. This was only intended to be a temporary solution. ShakeNet has many new features, including a helicorder.
Yours, Branden
1 Like
Old habits die hard.
I’ve been using EQInfo for years and find it very good for getting earthquake information like location which Shake Net doesn’t give. And you can click on the EQ agency to go to that EQ on their website.
Talking about ShakeNet, why are the P and S times in the same colour as the signal? It makes them very hard to distinguish.
Hello TideMan,
Firstly, thank you for all your suggestions, they are extremely valuable. I have some questions that will help us in further refining your observations.
On your question regarding ShakeNet App, could you please expand on when you say that the P and S times are in the same color of the signal? I ask because I can see the lines and label appear in a blue color, while the signal is pink, in the dark theme, or blue over black in the light theme. Would you prefer a different colorscheme? What do you suggest?
Regarding the location display, would you also prefer to have latitude/longitude information alongside the date/time of the event and the direction and distance from your Shake?
Thank you in advance for all the details you will provide, it will help us in making the App even more efficient!
Stormchaser
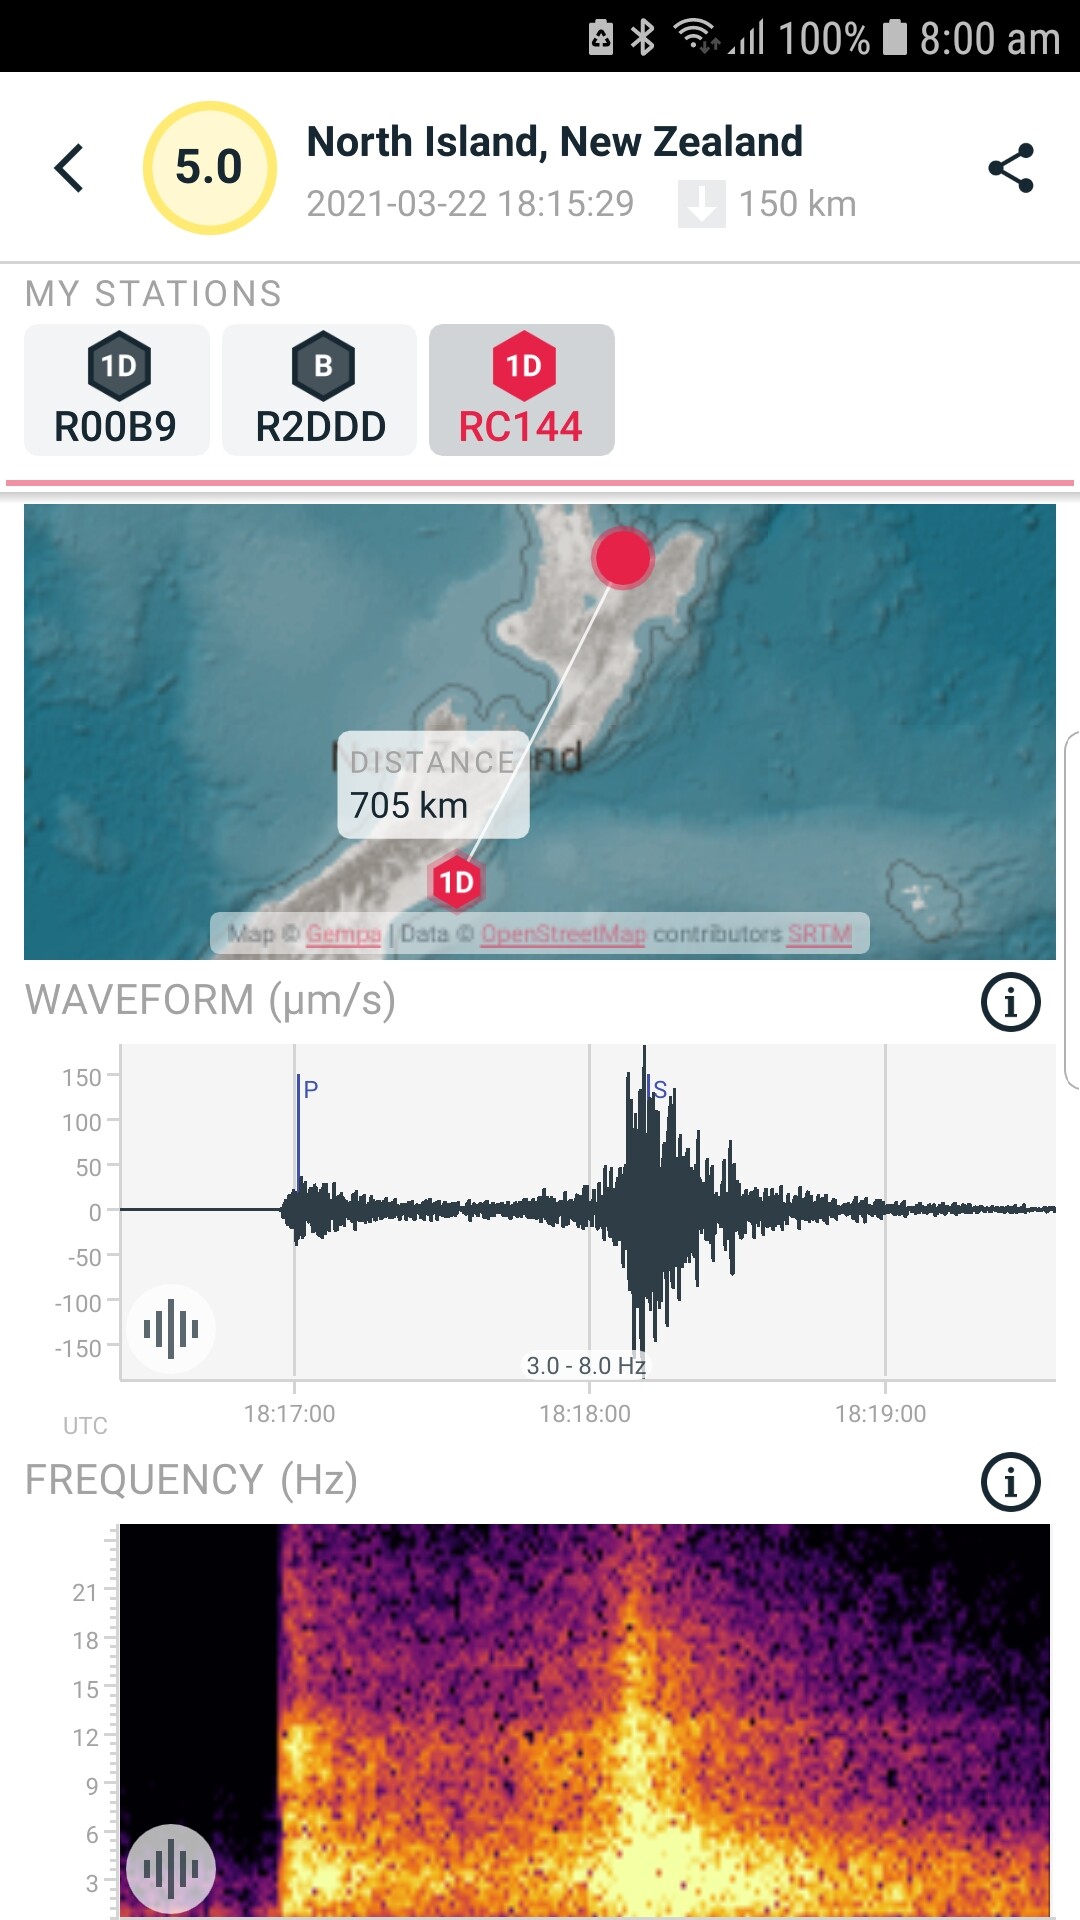
See the screenshot below.
The P wave shows quite well, but the S wave is lost in the black signal. The problem is that the blue colour is navy, which is too close to black. It needs to be a brighter blue. The dark background has a similar problem, only worse (in fact, that’s why I use the light background - it’s easier to see the P and S waves). Also, they need to be plotted over the top of the signal.
There’s not much room on the screen to show lat/lon, so why not have a button that lets you go to another screen for that? It could also list the agencies that are reporting the EQ like EQInfo does, with links to their websites.
In other respects, ShakeNet is excellent!!
1 Like
Thank you for your detailed opinion TideMan, that’s what we need to move forward!
We will take everything you said under consideration for future App releases, and discuss it with the relevant teams.