My EHZ graphs are blank. Please let me know what I need to do to get graphs back on line.
Thank you,
My EHZ graphs are blank. Please let me know what I need to do to get graphs back on line.
Thank you,
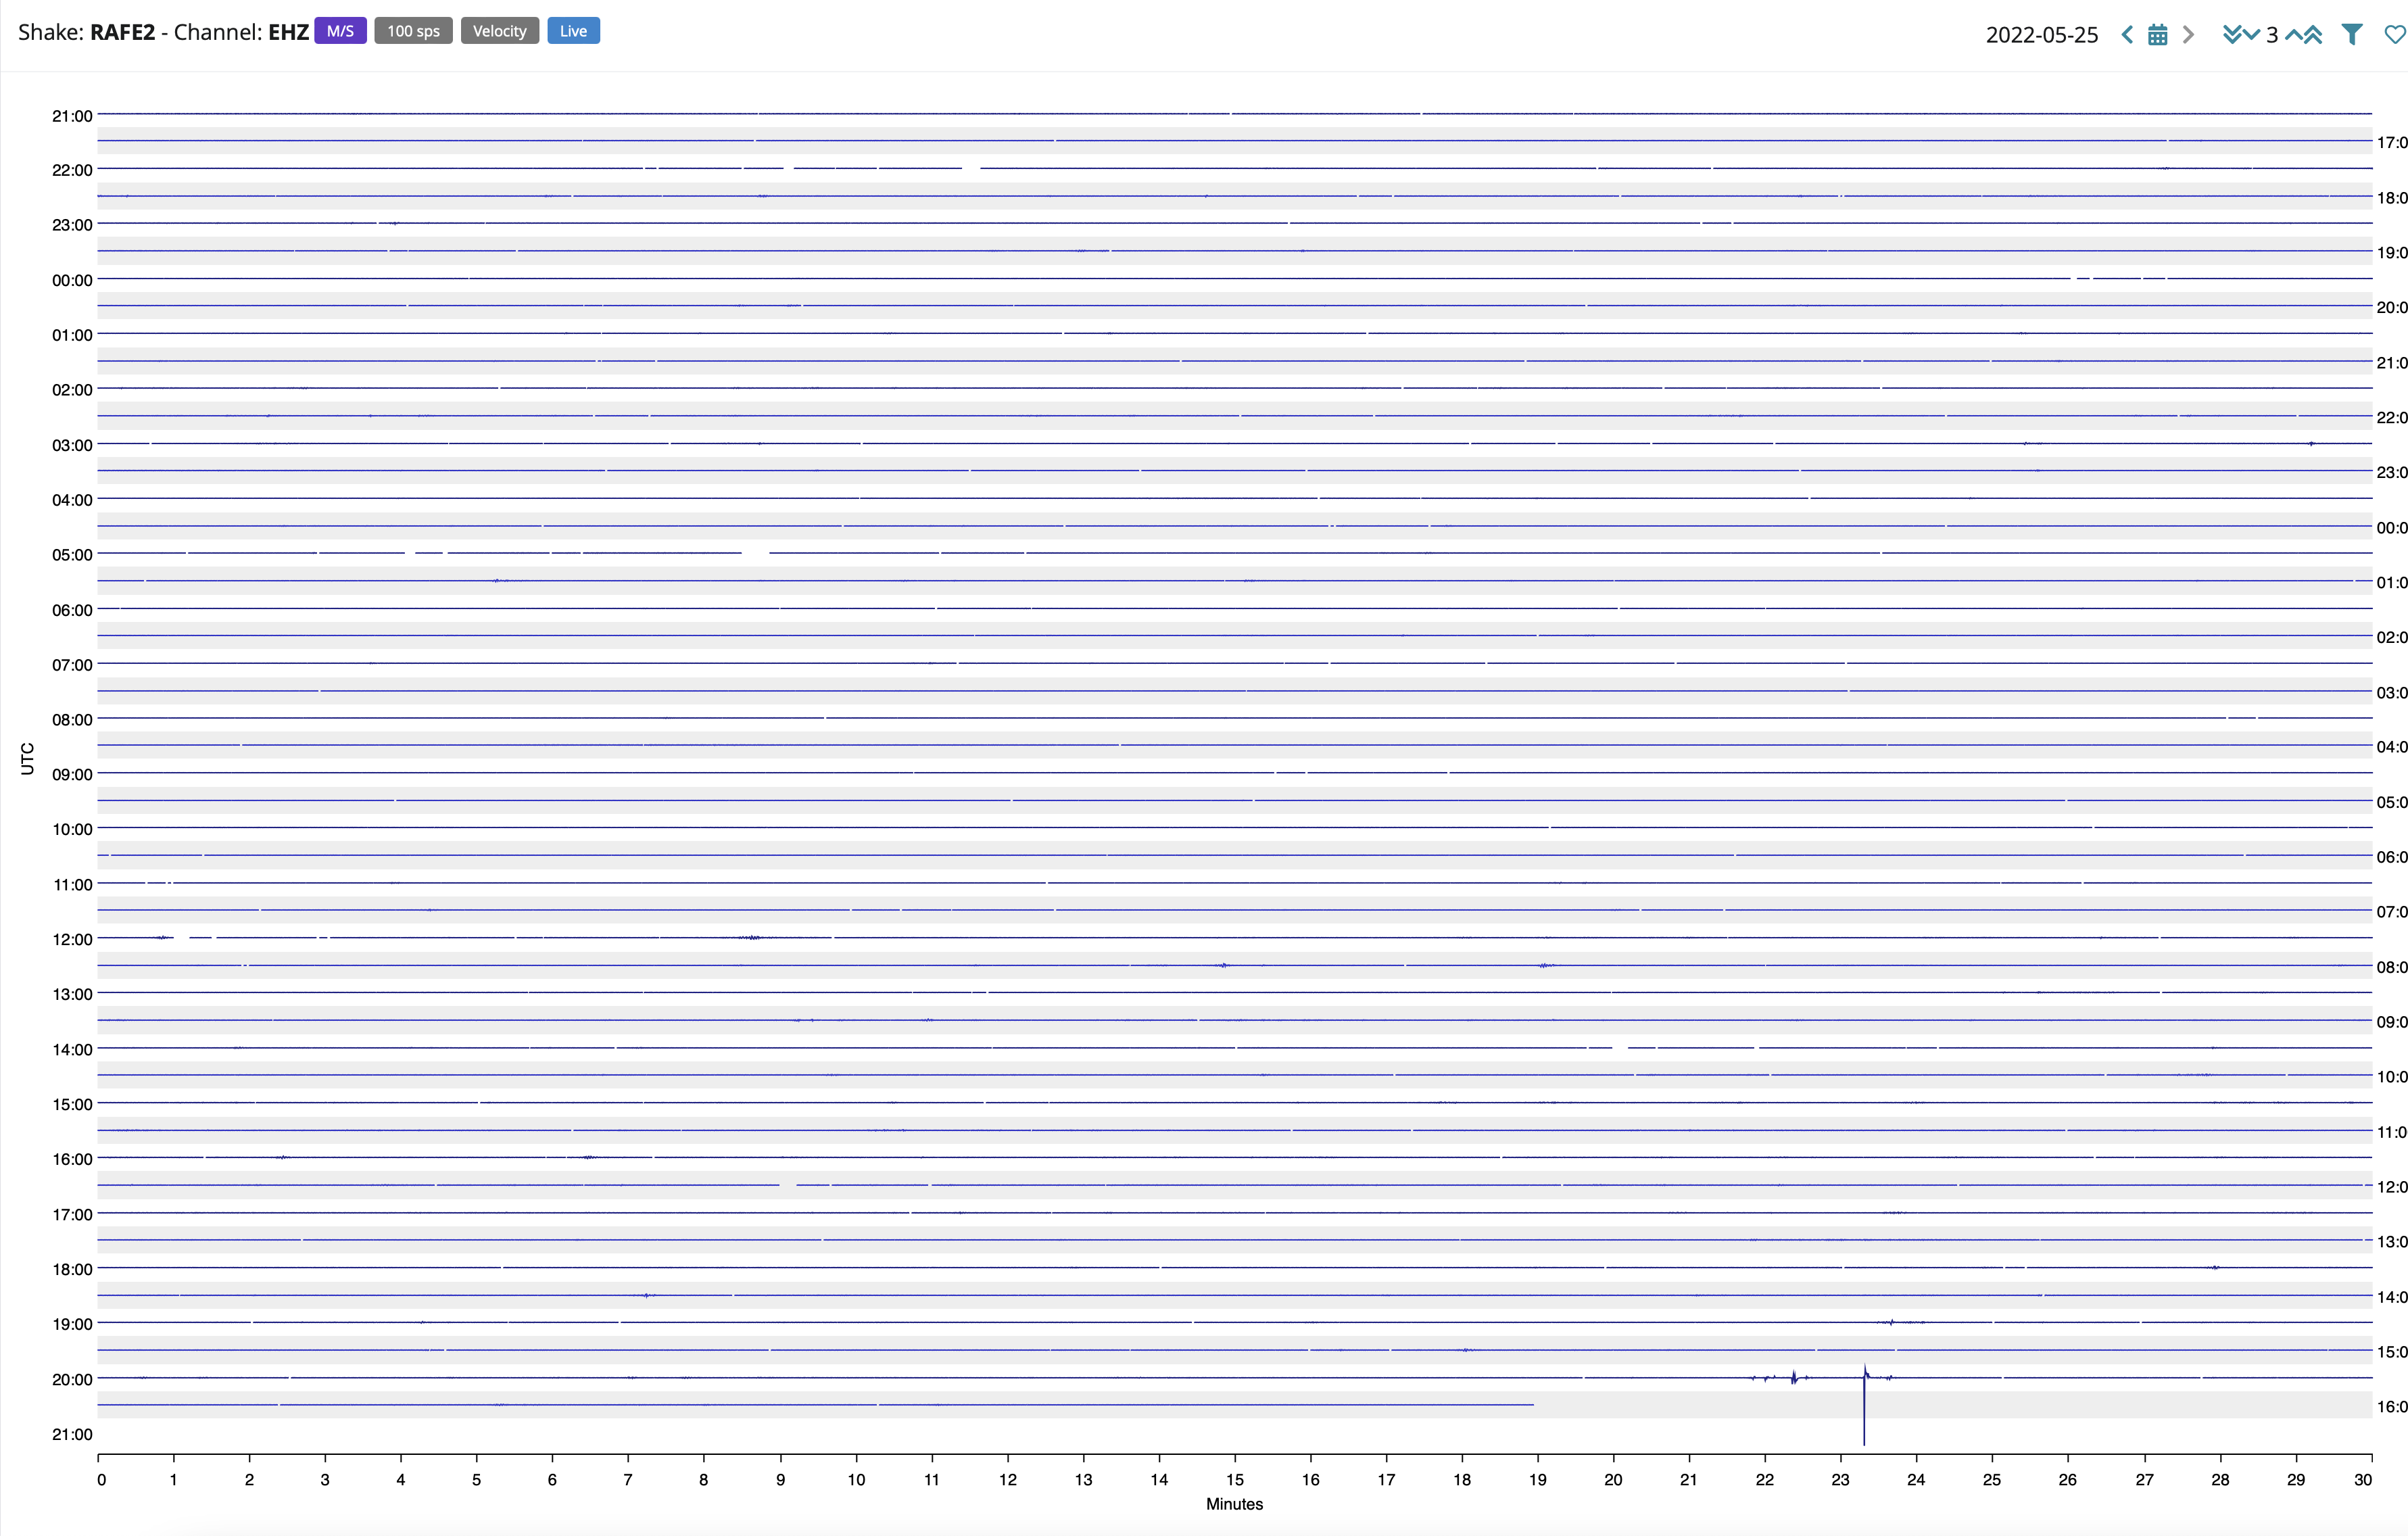
It isn’t blank. See that downward spike, bottom right?
You have the scaling factor (top right) set to 3. What that will do is increase, or decrease “amplification” such that the largest spike on the current display covers 3 lines.
That is a huge spike, so compressing everything to reduce that to 3 lines pretty much makes everything else invisible.
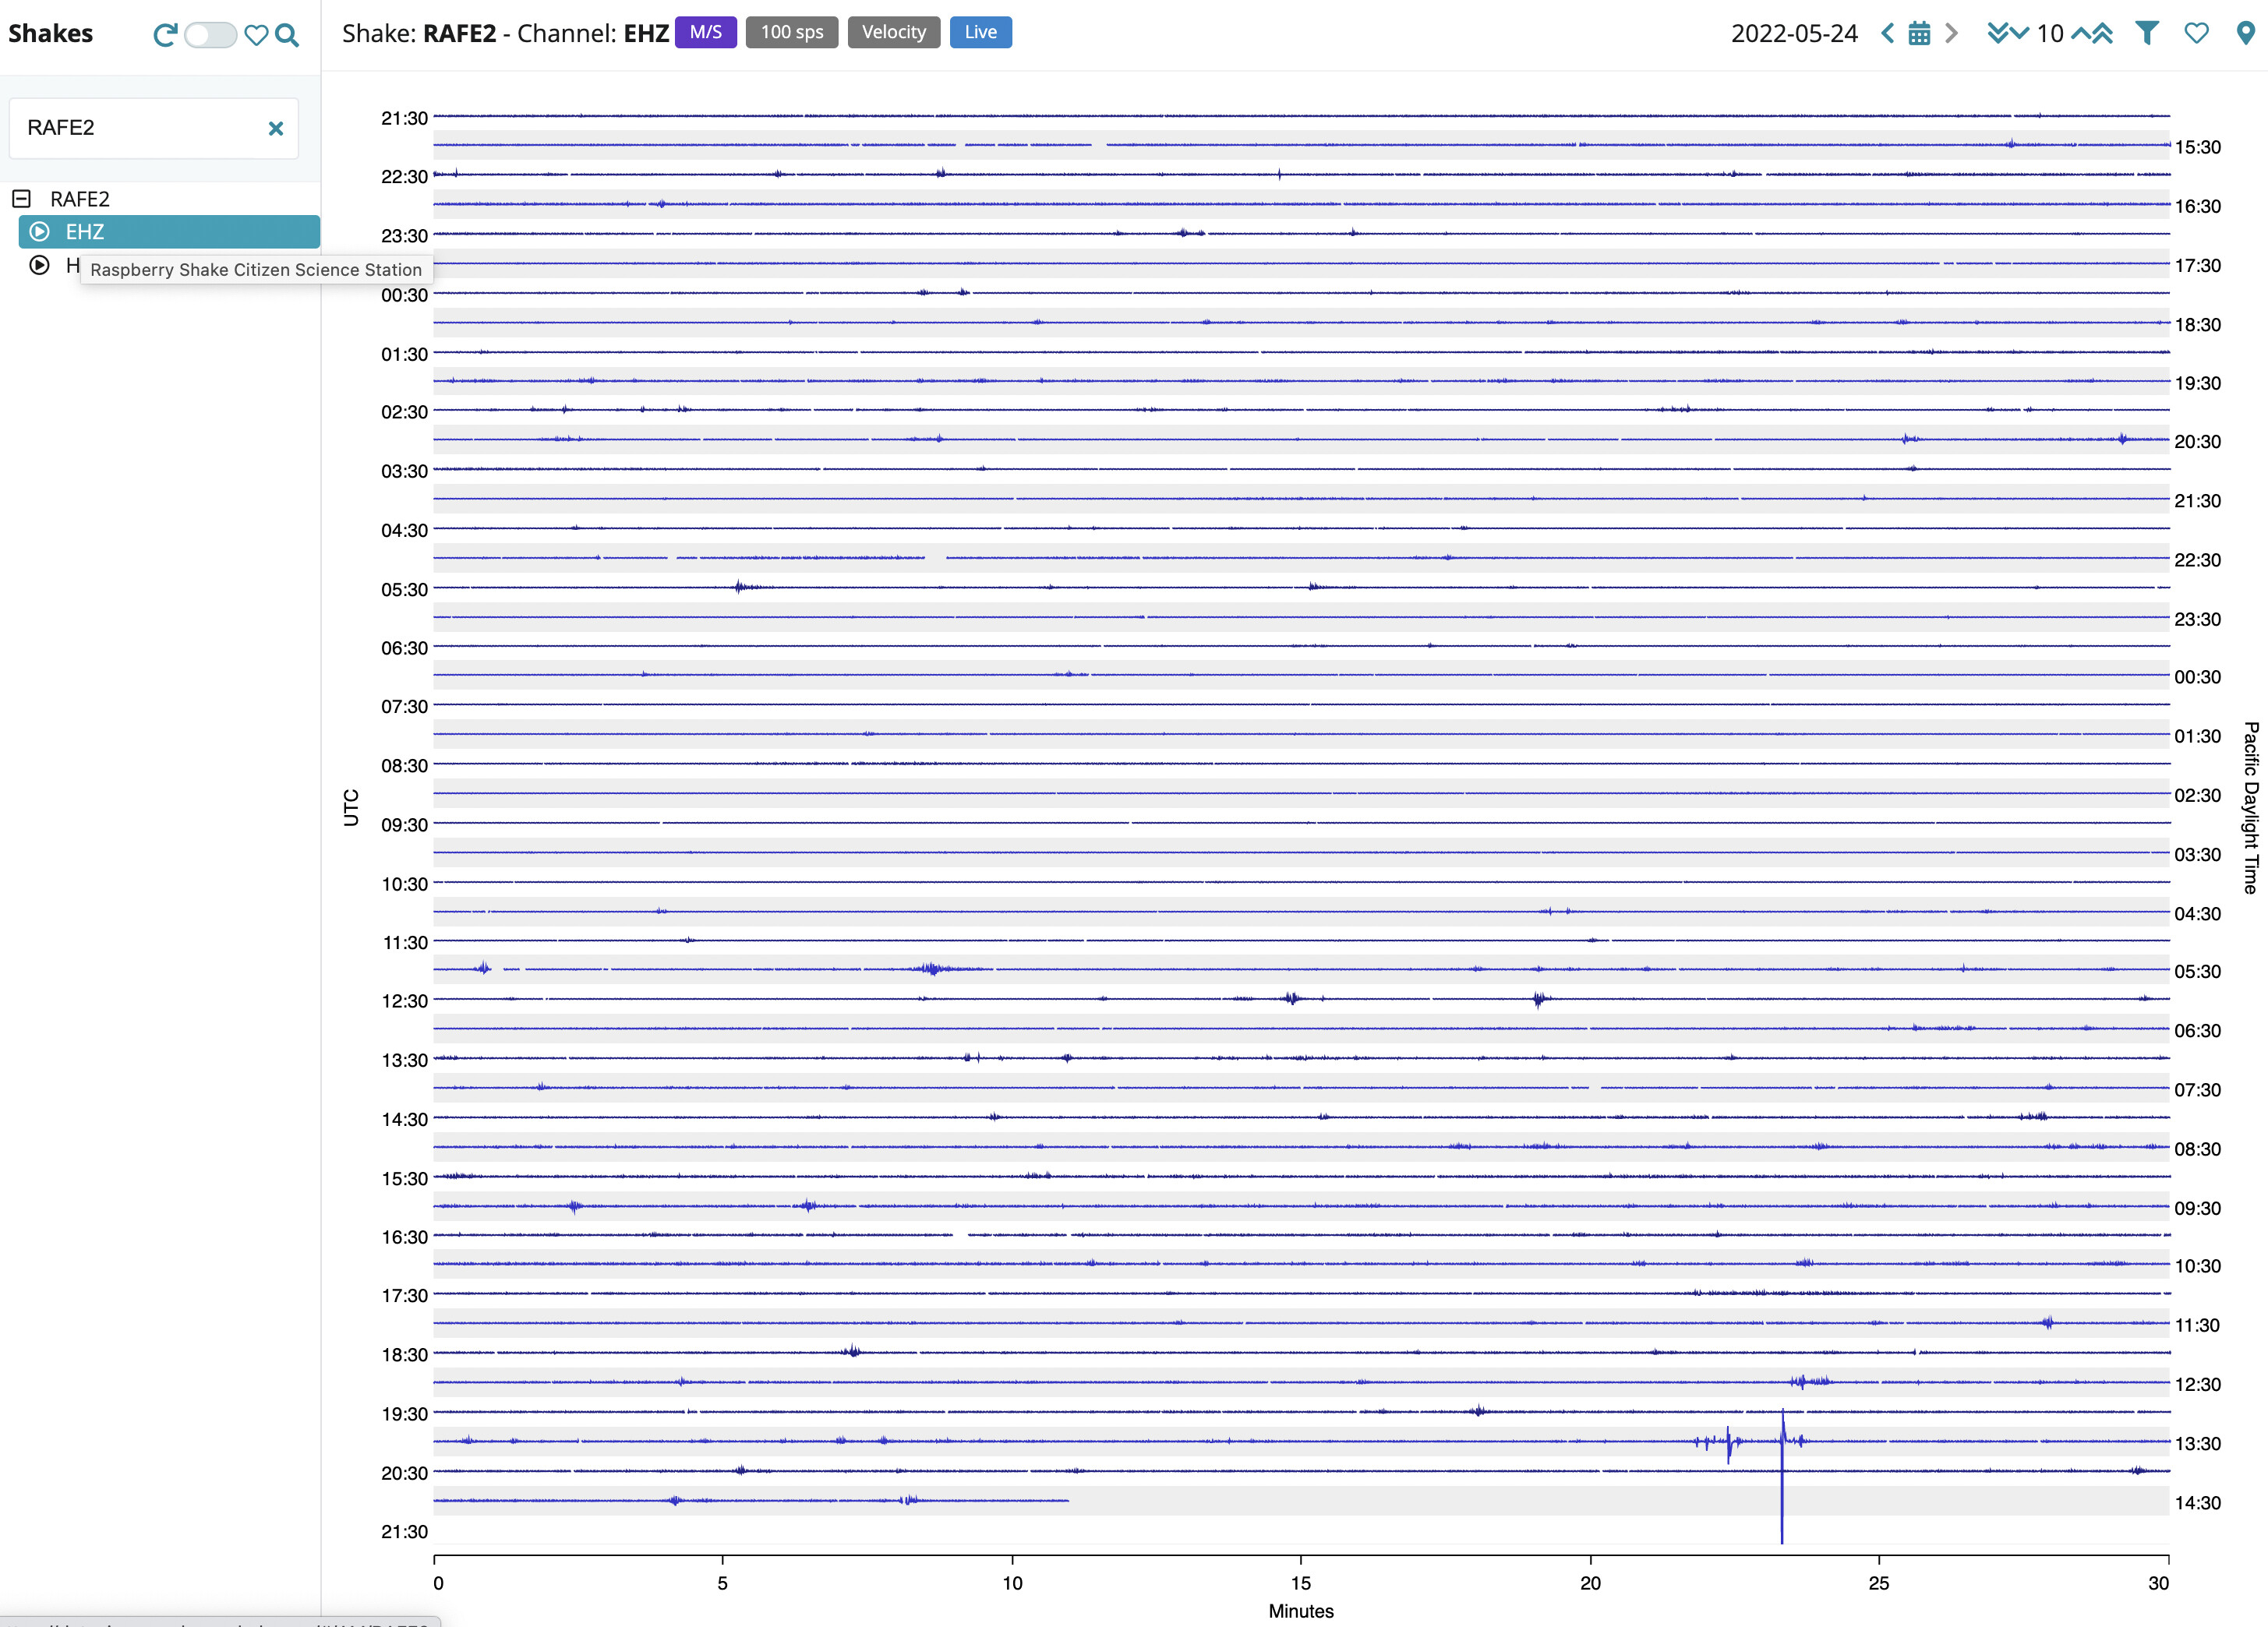
Here is your Z channel with the scale bumped up to 10:
Other things are just starting to appear. Bump it up some more to see more.
BUT when that spike rolls off the top, you will need to turn it down again…
Hello Mountains,
Yes, as Philip has shown, the very large spike in the dataset is causing the rest of the helicorder view to be compressed down, resembling a single line with no movements.
We are awayre of this issue, and we are working on a couple of possible solutions to avoid this in the future. Unfortunately, as of now, we cannot provide an ETA for when these new implementations will be available.
Thank you for your patience in the meantime.
It’s not that big a problem - once you understand what is going on.
The first time it is very confusing.