Dear all,
I have problems to document local Earthquakes that are not recognised by the different agents. I used Swarm in the past, but the application does not work on a 4k-monitor.
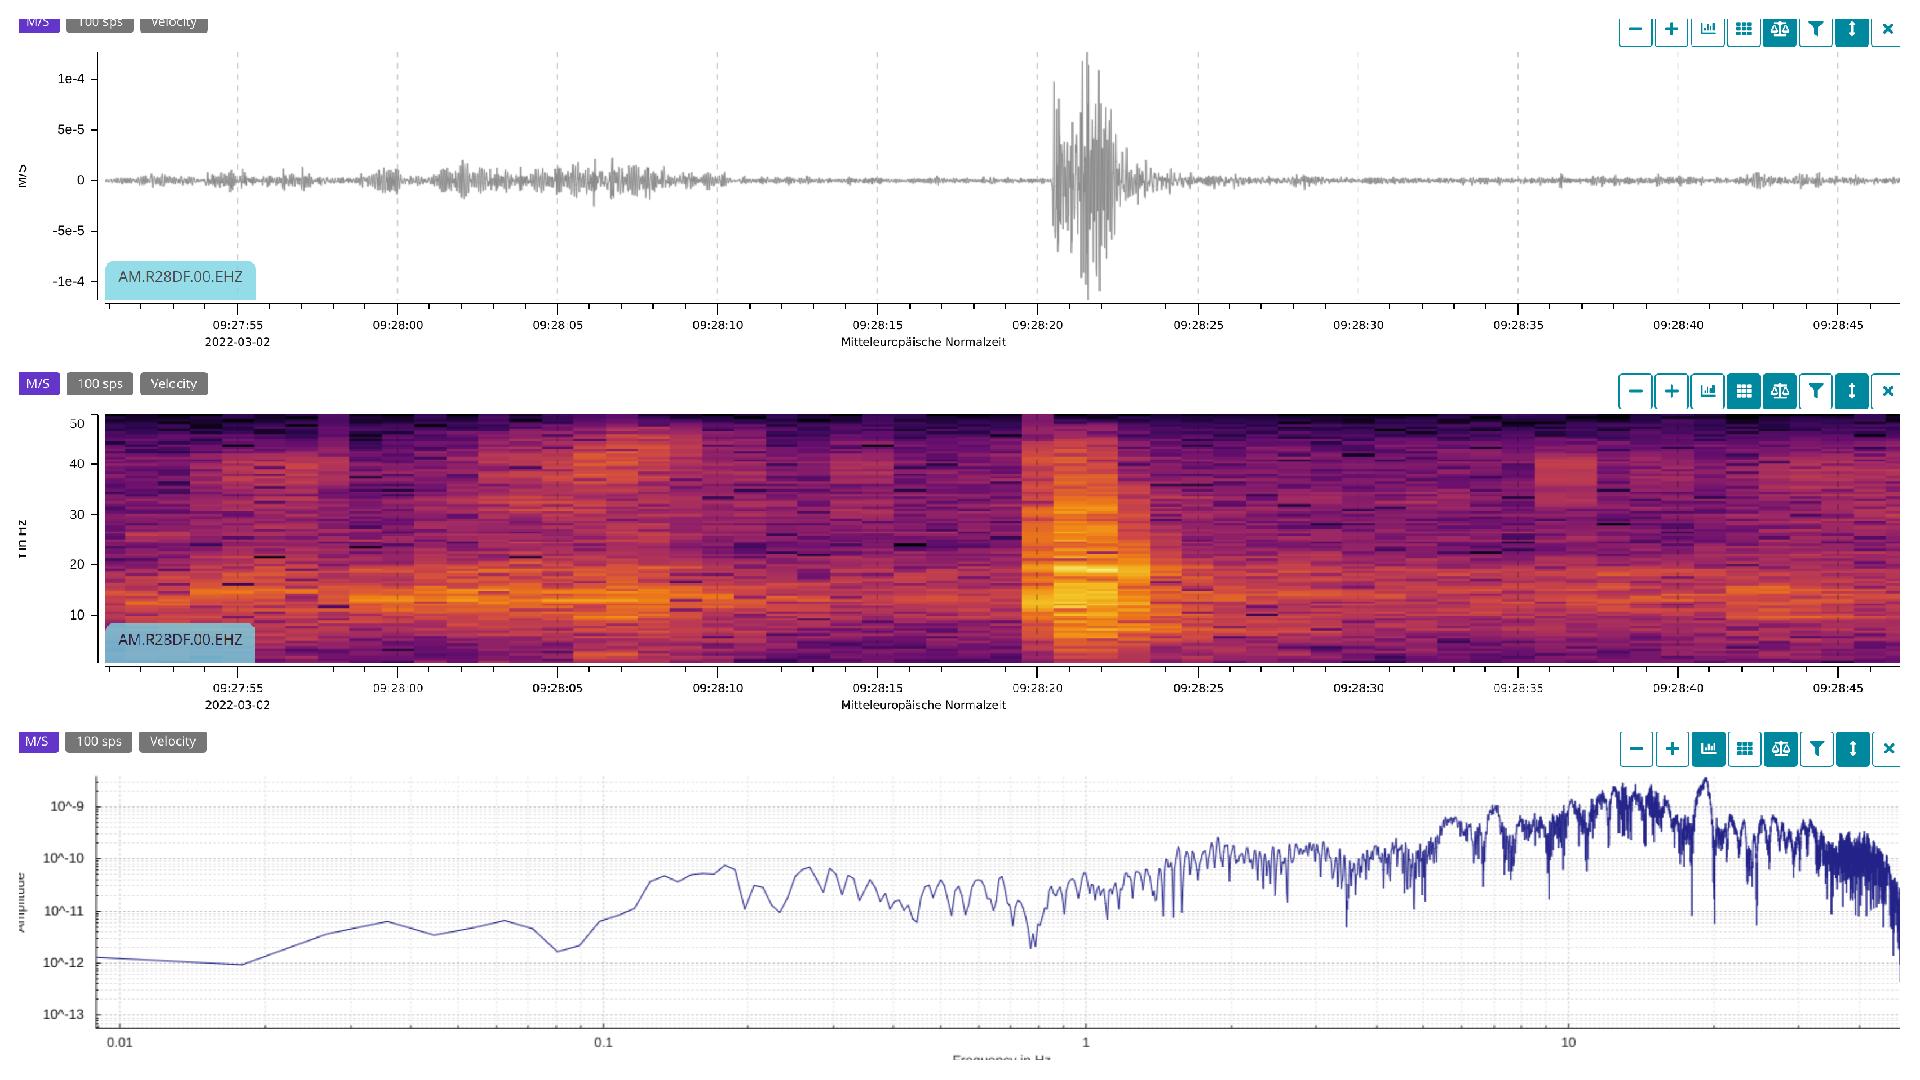
Please find enclosed an experimental document where i put all together I have.
My request would be:
Would it be possible to enhance DataView with the possibility to put together the three sights on an event like Swarm does?
Would it at least be possible to enhance the shared view form the Android app with a date, not available at this point?
Kind regards
Jürgen
sinzig_20220302.pdf (2.2 MB)
2 Likes
Hello jheiler,
Firstly, this is a very interesting project, thank you for showing your work to us!
Regarding your suggestions, we are currently working on something similar to what you have proposed in your first point. I am not able to provide an ETA for you, but we will be implementing a feature that will enable users to show multiple waveforms from different channels/stations at the same time.
Regarding the second suggestion, I have opened a ticket for our app team, explaining what we would like to add. Hopefully it will be easy to add and it will be implemented in the next releases.
Again, thank you for your ideas.
Thank you.
First and foremost, I want to merge the three views and save them. Currently, I need to take three screenshots and then combine them with collage software.
1 Like
Thanks for the image, this will be very helpful for our software team!
We could make it as a standard after some testing.
To use the possibilities of the RS3D, such graphics would also be necessary.
unbenannt.pdf (585.1 KB)
1 Like
This one could be doable too, with a bit more work since it would be a cross-channel display.
I will pass this too to the software team.
Thank you so much for taking the time to suggest all these improvements that will enrich our DataView portal!
Hello @jheiler,
I wanted to update you on the fact that both your suggestions have been recently implemented.
Now, if your app is updated to the latest version (v1.3.15), the date will appear in the final image when creating/sharing your selected waveform trace.
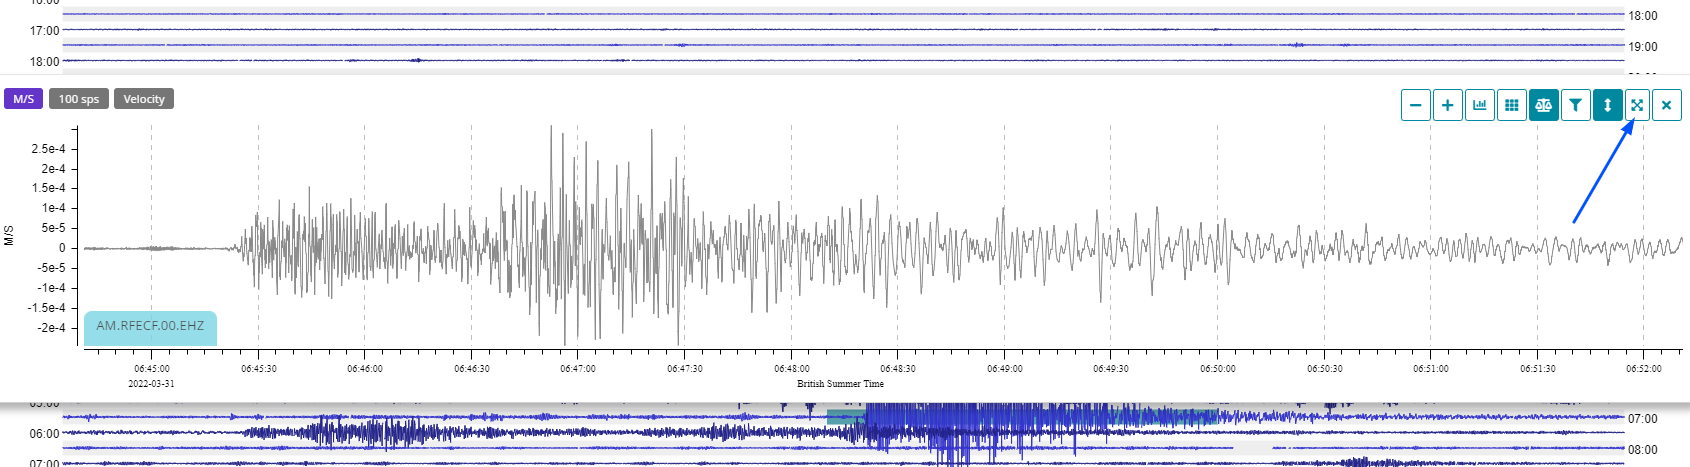
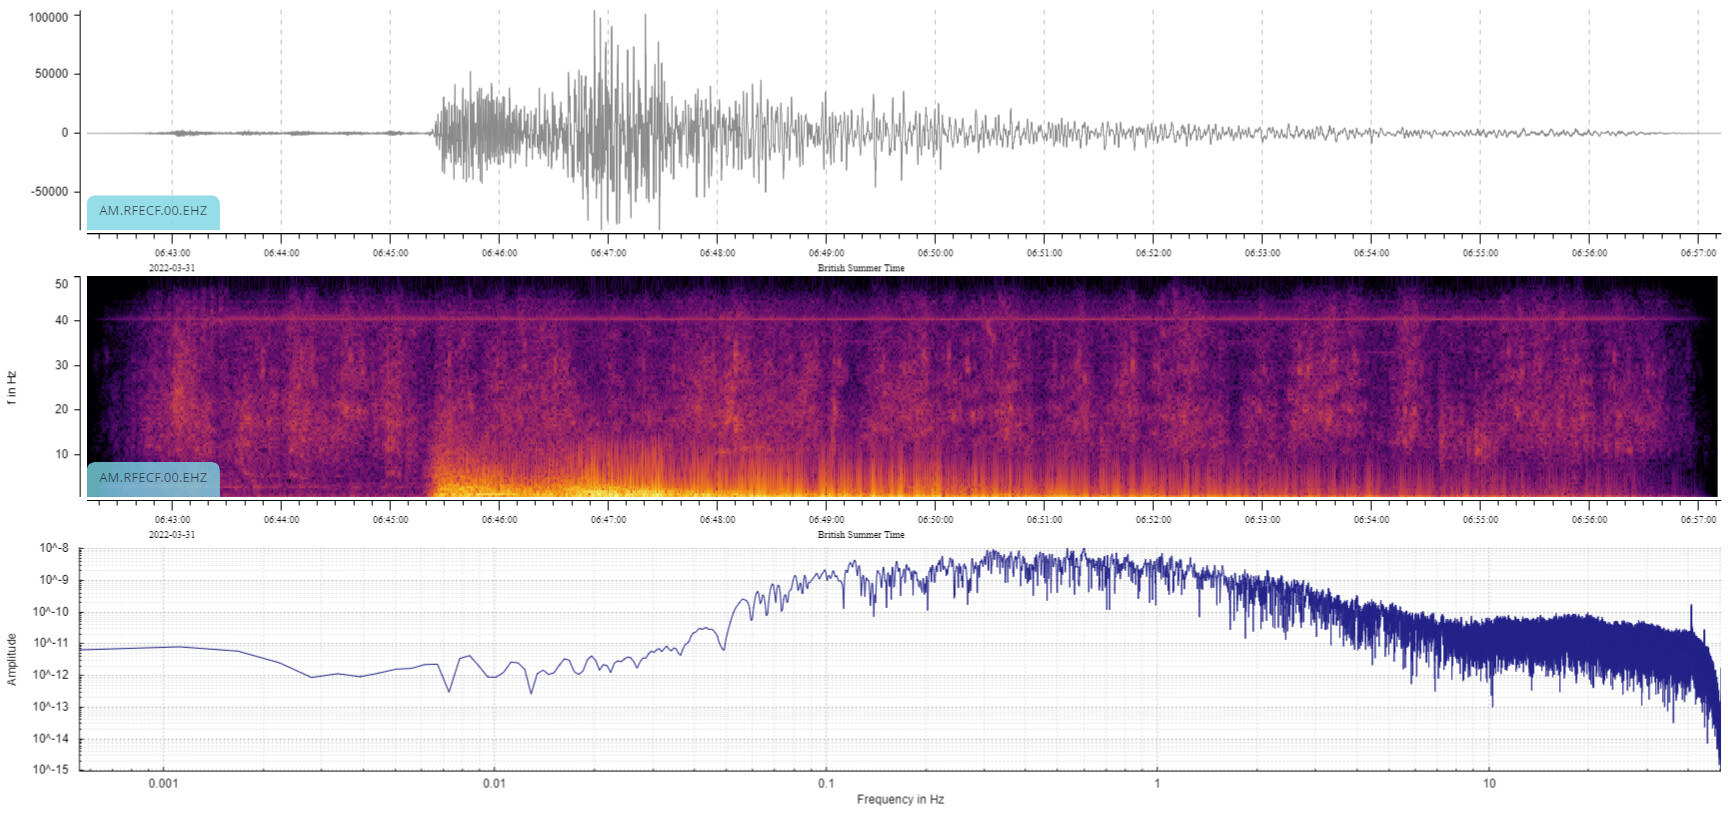
Also, on DataView, it is now possible, after selecting again the part of the waveform that you are interested in, to create a summary plot with the merged views. All that you need to do is click on the second to last button, as per this image:
And this plot will be automatically created, giving you the possibility of saving it directly without the need of doing a screenshot.
I want to thank you for your continued feedback and support, these are all improvements that we are making thanks to you!
Thank you very much for the support.
2 Likes
This is a really nice addition/improvement.
One thing you might like to add to the list for a future version:
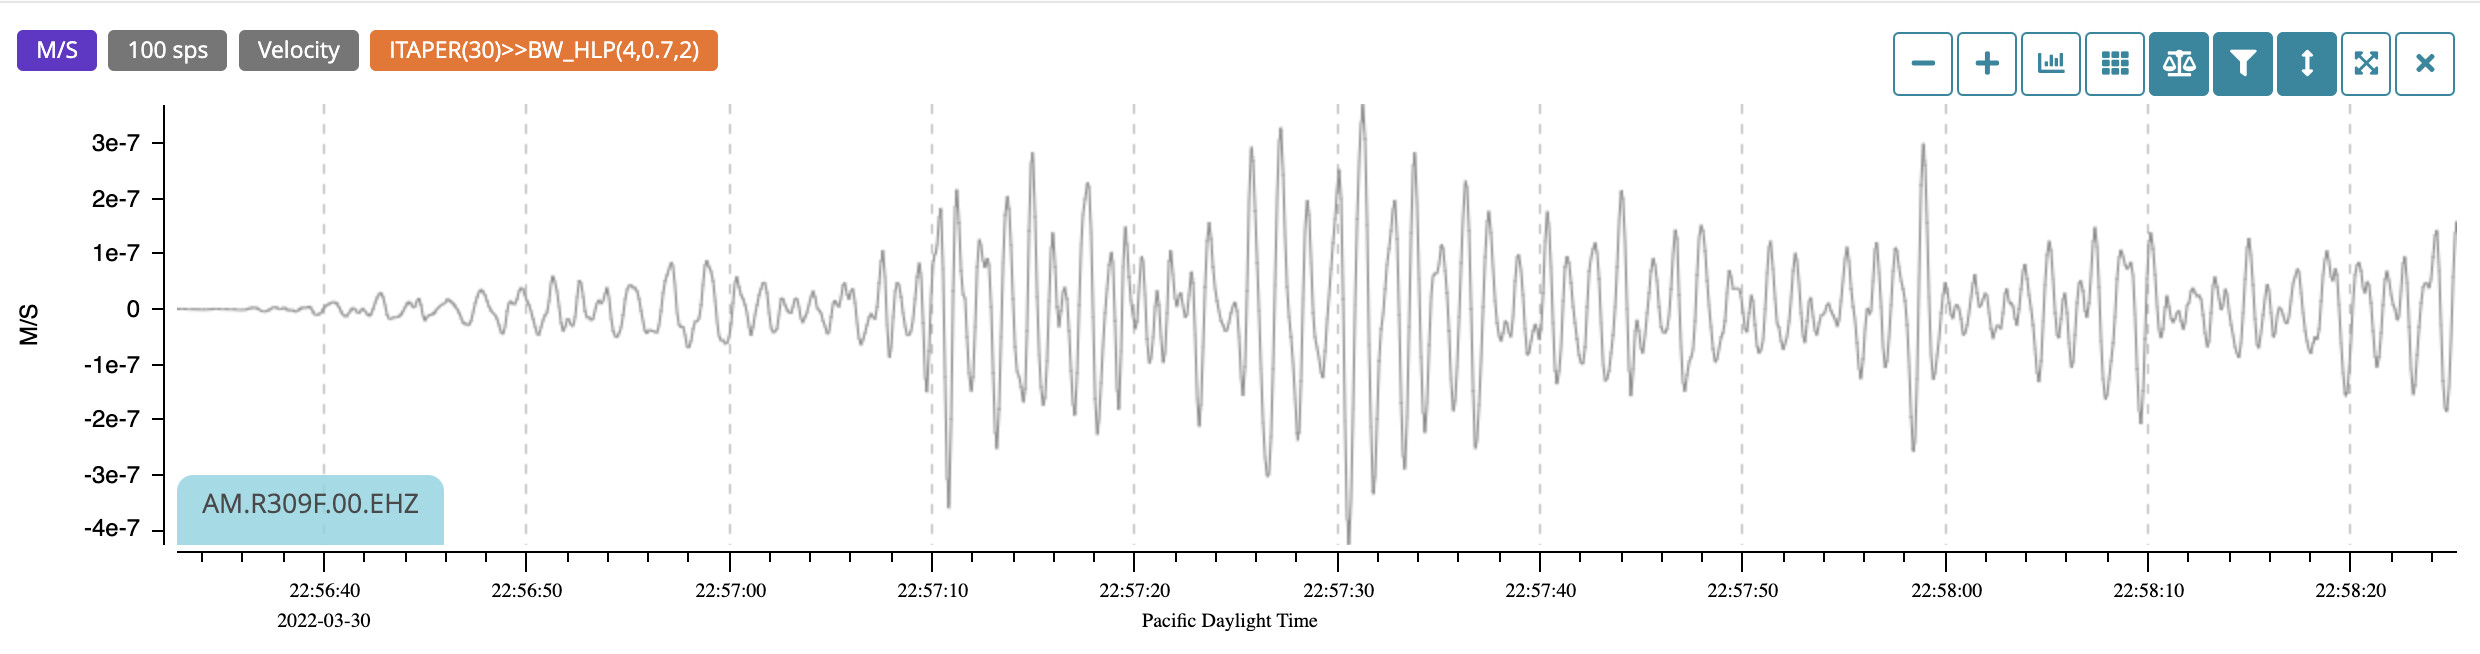
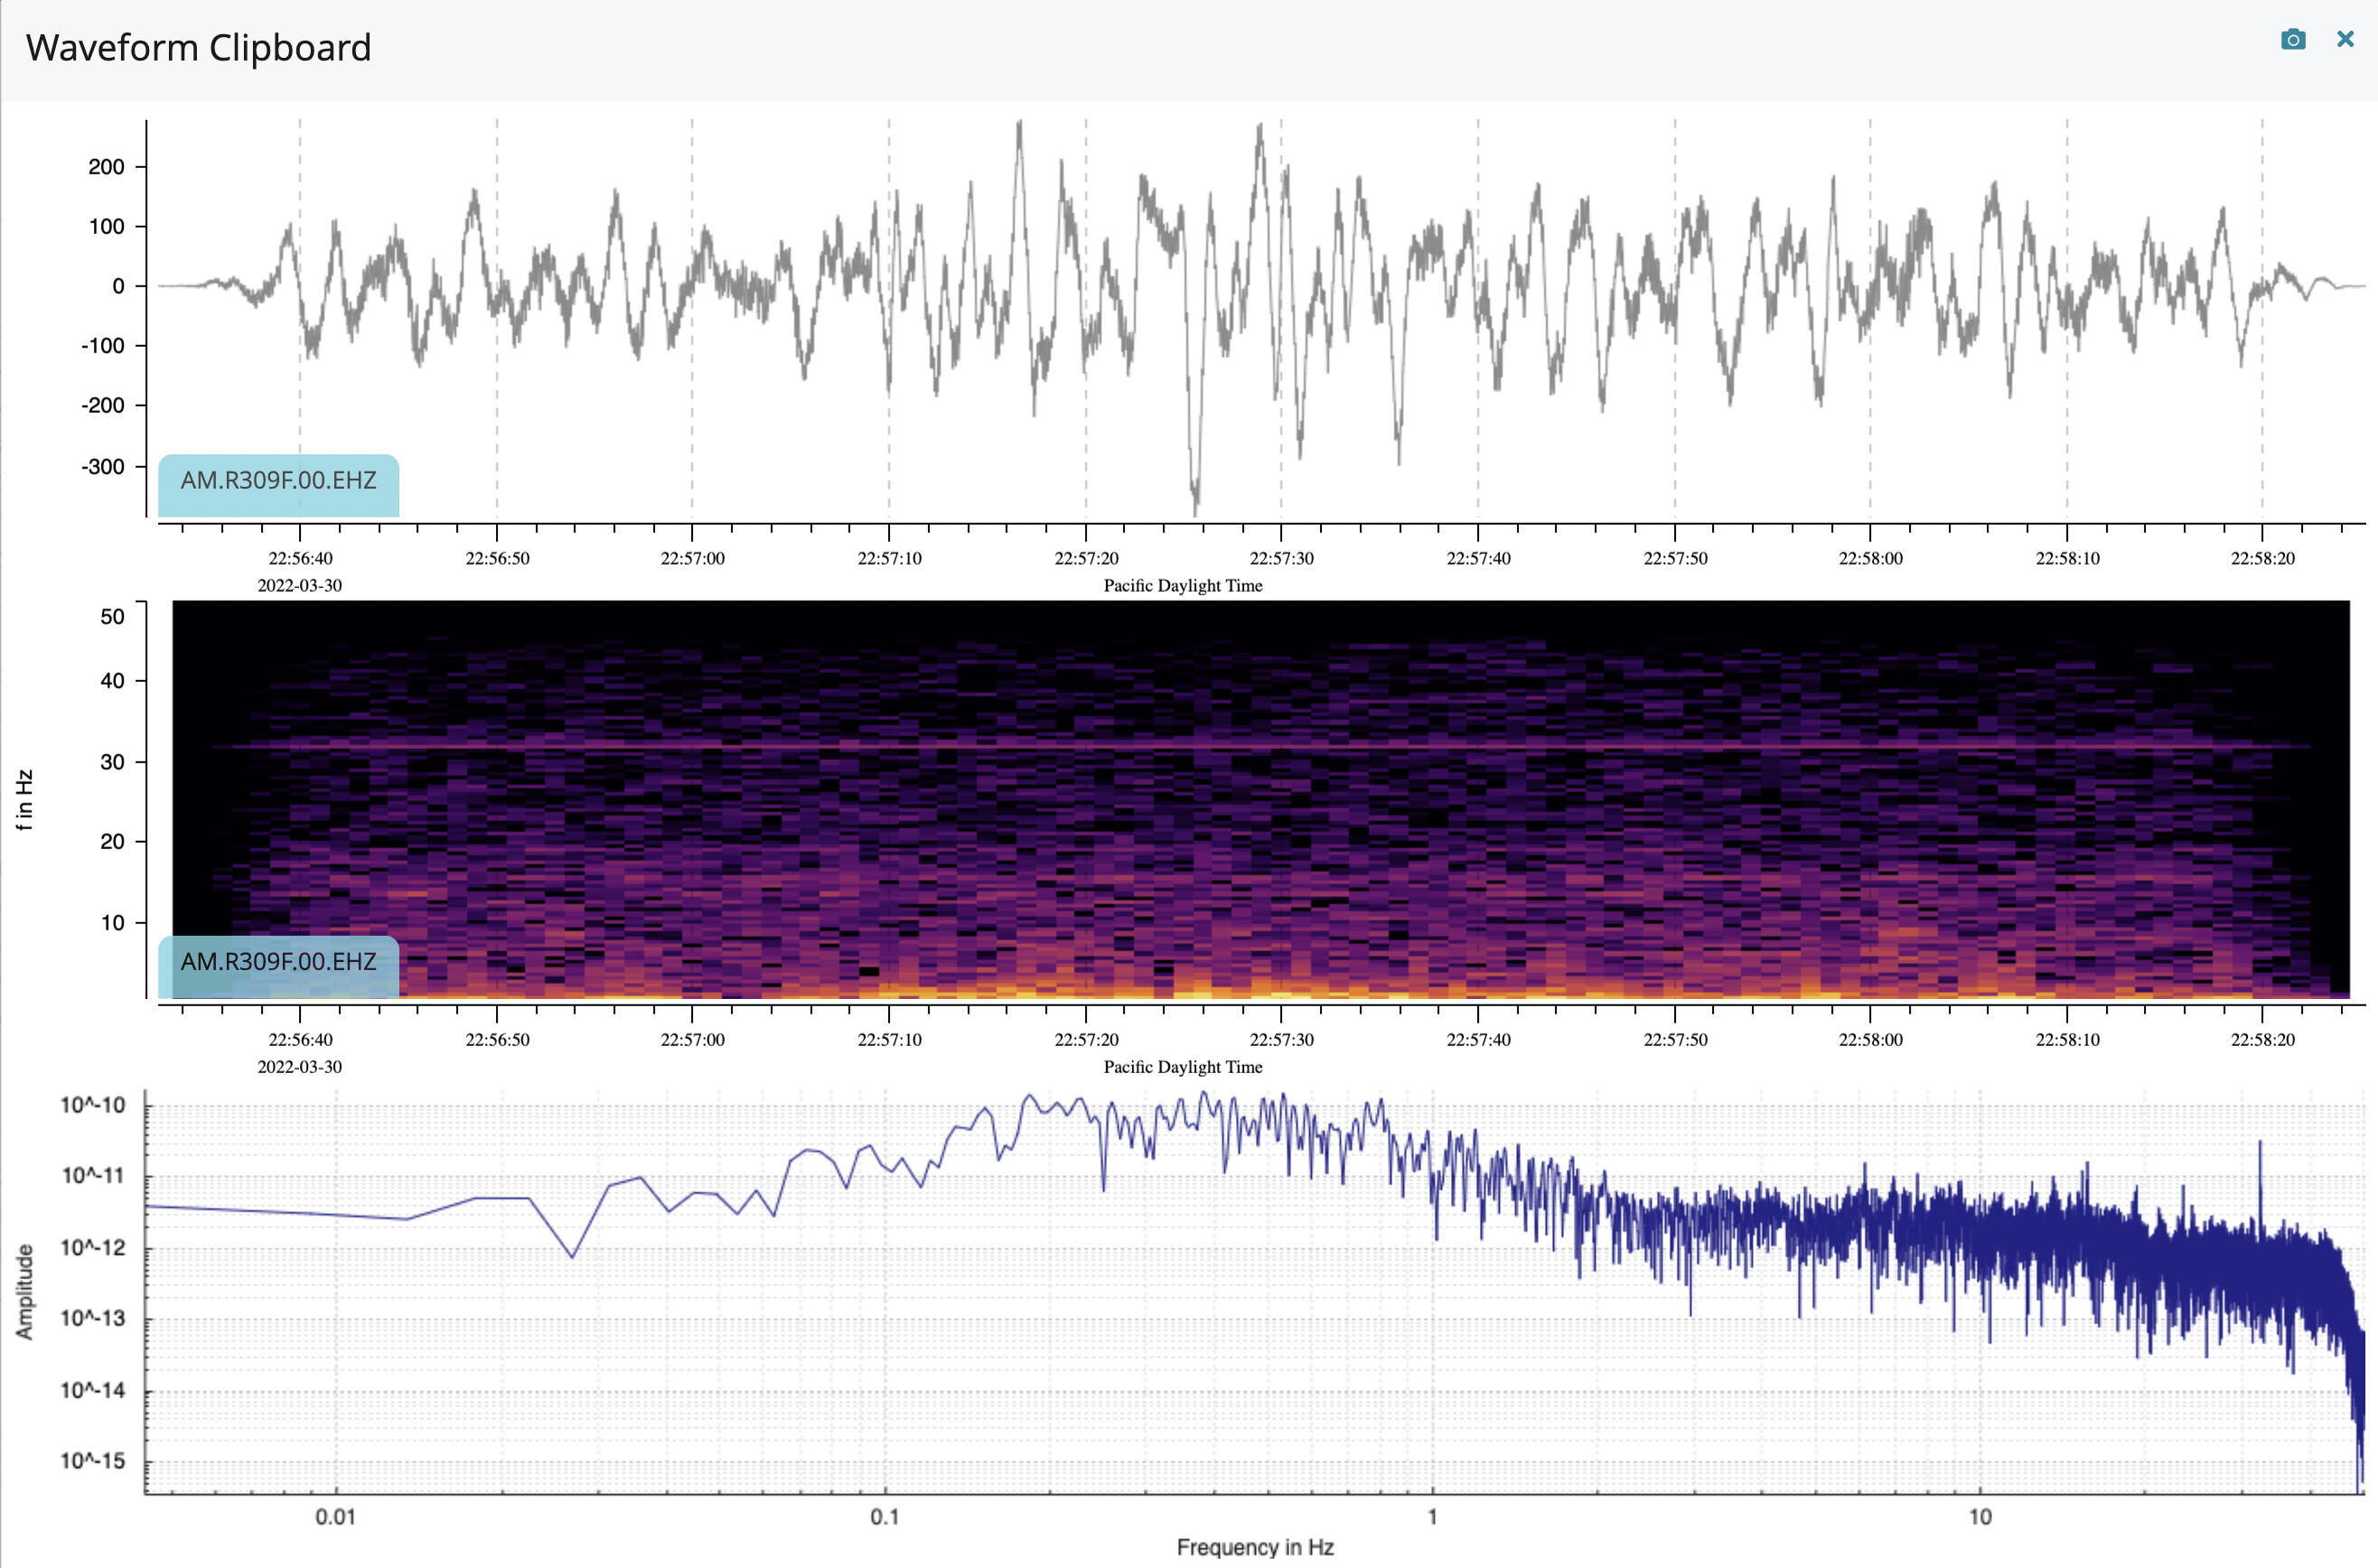
This is the M7.0 Loyalty Islands earthquake as seen by my device:
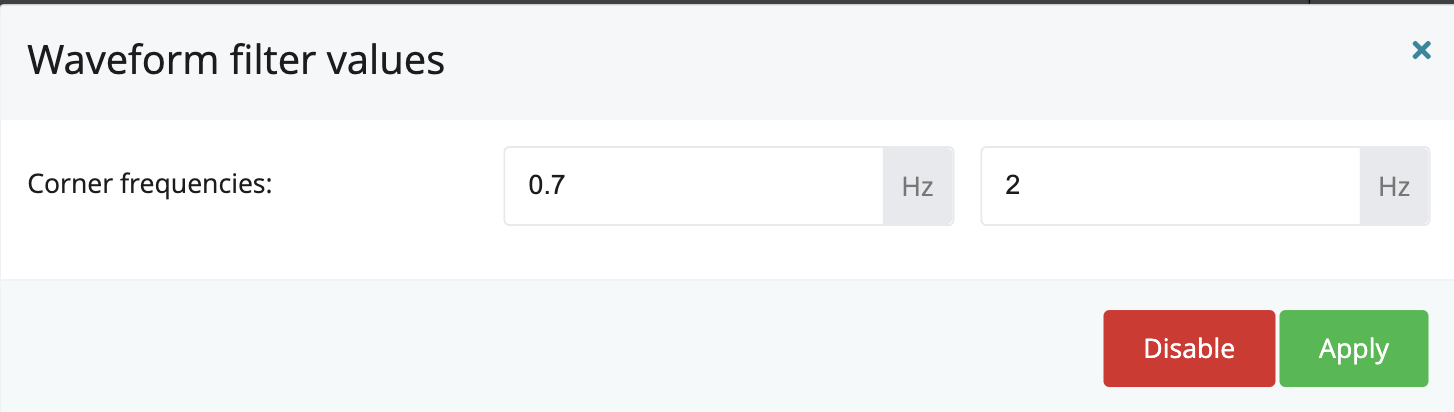
To see this clearly, I needed to apply this filter:
Unfortunately, when I use the new view, it ignores the filter currently defined/activated:
Would be nice if a future version applied any defined/active filter.
2 Likes
Hello Philip,
Yes, this will be the natural step forward that was not yet implemented since it requires a bit more work.
For now, the objective was to offer a clipboard waveform for local analysis, that is, where earthquakes could be seen easily without filters. In a future update (I have passed your suggestion to our team) then, if a filter has been applied to the original waveform, then it will also appear on the waveform clipboard.
Oh, the current improvement is most welcome. I just wanted this on the record so that if someone hadn’t put it somewhere on the roadmap, that it would get added.
2 Likes