I try to use python to download my raspberryshake data
My code:
from obspy.clients.fdsn import Client
from obspy.core import Stream
rs = Client(‘RASPISHAKE’)
stn = ‘R246D’
inv = rs.get_stations(network=‘AM’, station=stn, level=‘RESP’)
start = UTCDateTime(2024, 2, 1, 10, 32, 51) # (YYYY, m, d, H, M, S)
end = UTCDateTime(2024, 2, 1, 10, 54, 18) # (YYYY, m, d, H, M, S)
channels = [‘EHE’]
stream = Stream()
for ch in channels:
trace = rs.get_waveforms(‘AM’, stn, ‘00’, ch, start, end)
stream += trace
stream.attach_response(inv)
Output_type = ‘VEL’
resp_removed = stream.remove_response(output=Output_type)
resp_removed.plot()
Then, I get the figure.
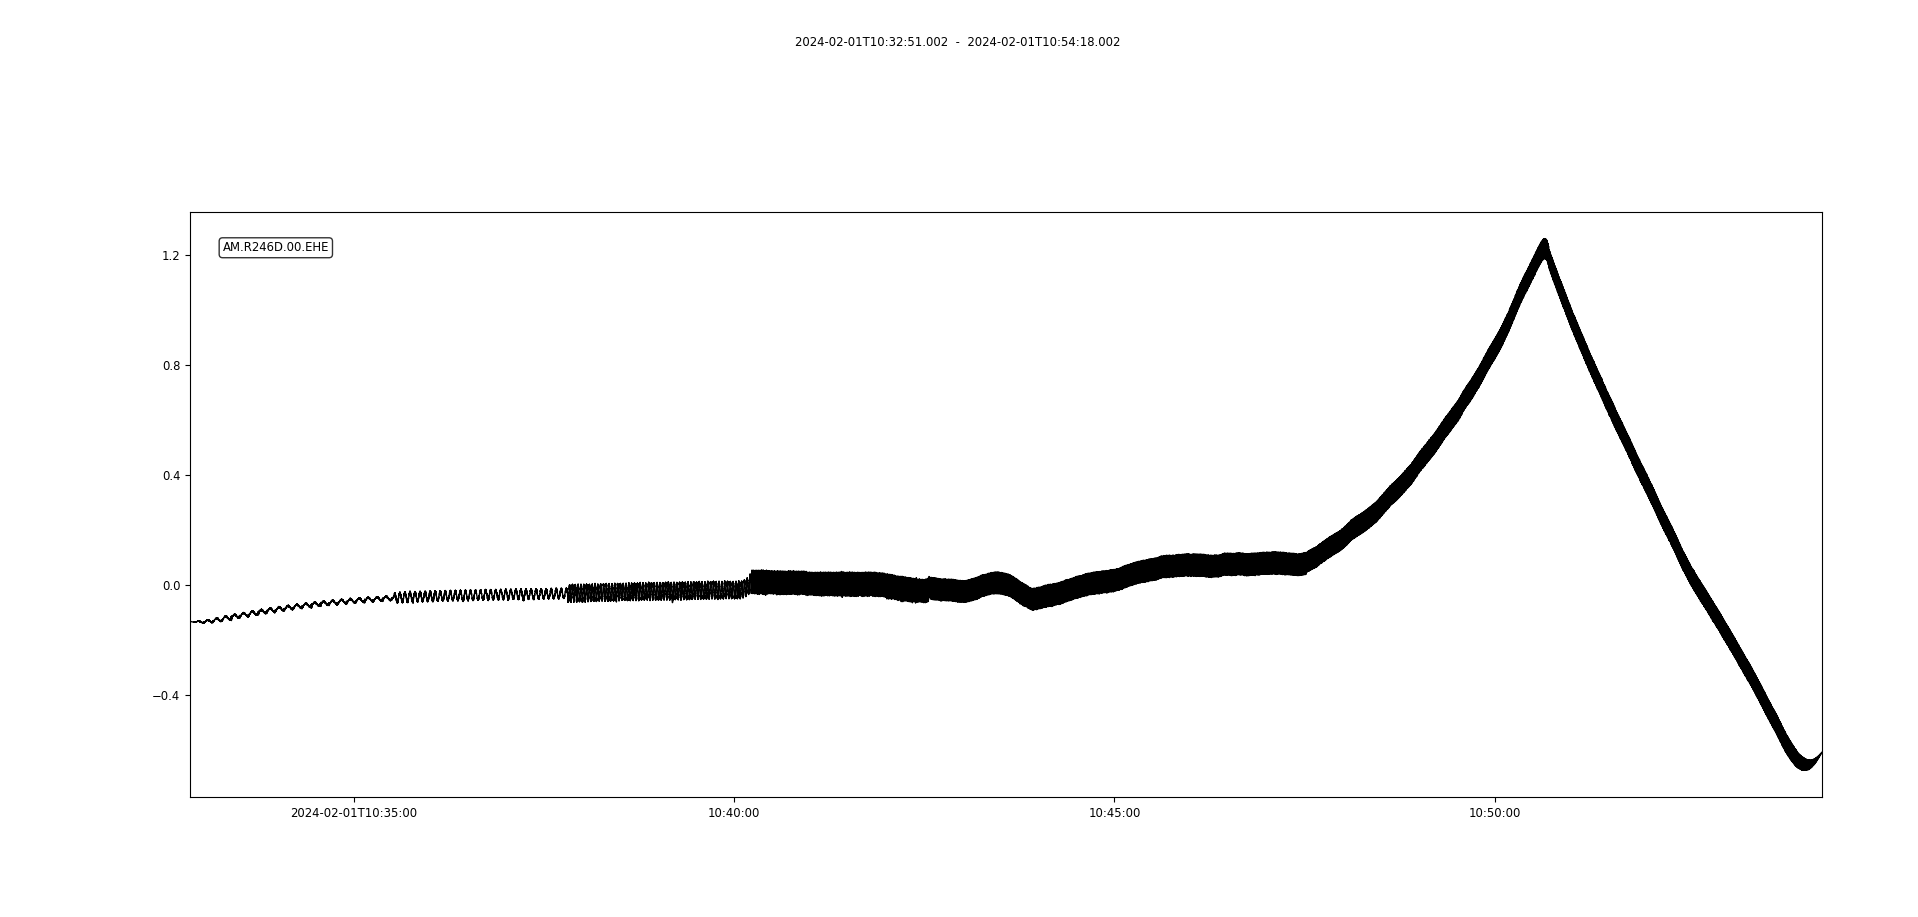
However, the velocity figure gotten from python is different to data view website
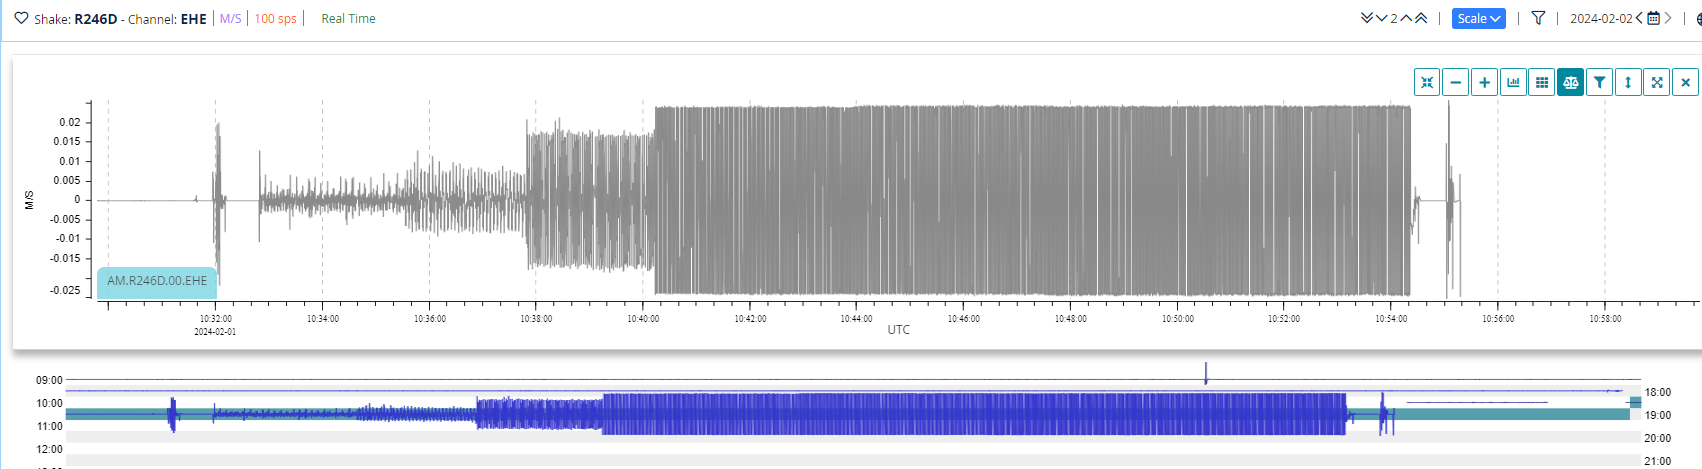
Which one is correct?