Hi All,
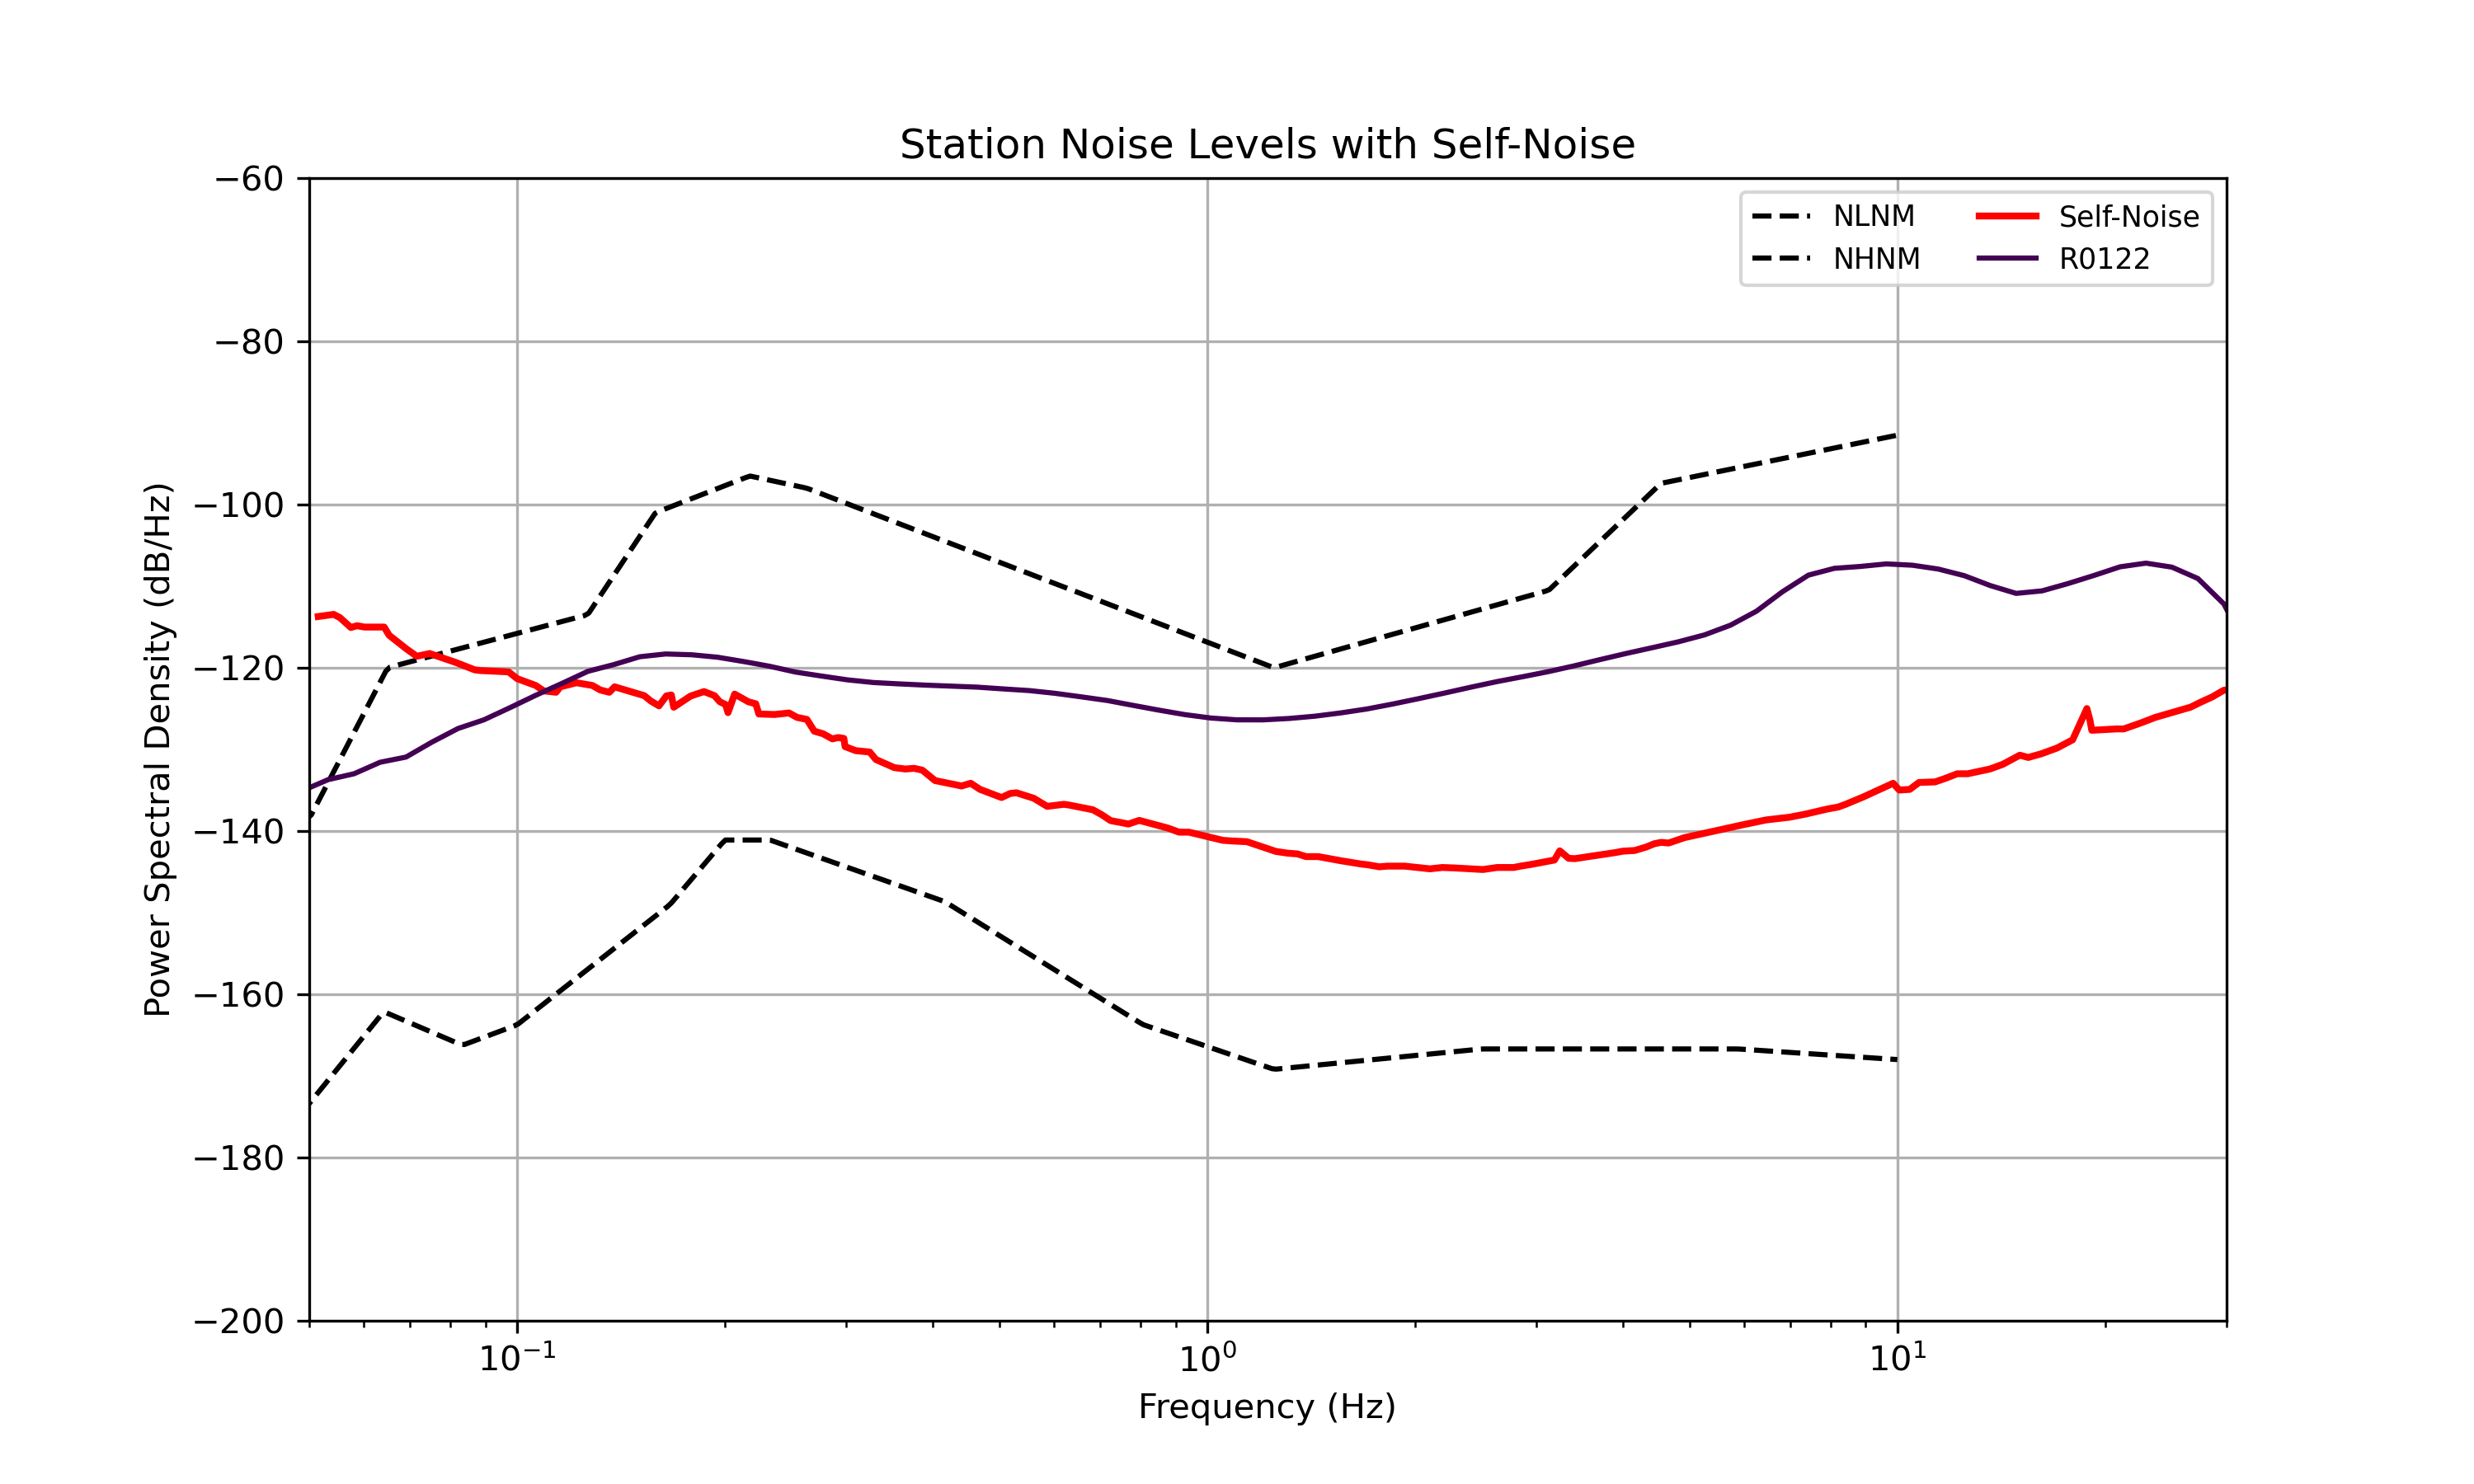
I am a researcher trying to compare the self-noise from one of our sensors by plotting PSD. For this purpose, I am using Obspy’s built-in PPSD function and plotting the self-noise curve provided by Anderson in the same plot following the instructions given in the research article: https://pubs.geoscienceworld.org/ssa/srl/article/94/6/2725/627977/Monitoring-of-Local-Earthquakes-in-Haiti-Using-Low
However, the ambient noise in my sensor is below the self-noise for frequencies less than 0.1 Hz, which cannot happen. I have attached the Python code used for this analysis. I would love to hear your thoughts.
Any help would be much appreciated.
noise_analysis.zip (184.5 KB)
1 Like
Unfortunately, many of us do not have free access to the article mentioned.
I am, however, interested in this topic and was going to launch into a noise floor calc for my unit last fall when, shall we say, life intervened.
One shot-in-the-dark guess would be that the red self-noise curve is too high at the low end. Making measurements at 0.1 Hz and below can be difficult because tiny air leaks cause ambient noise to get into the self-noise reading.
1 Like
Hello chanthuj,
This is very interesting! Thank you for sharing the code and its output with all of us.
Not having access to the research article you linked, the only thing that comes to mind would be to check this section in your code where you detrend and filter your signal:
        tr.detrend('demean')
        tr.filter('bandpass', freqmin=0.1, freqmax=30)
It is possible that this step could be introducing some unwanted results in your area of interest below 0.1Hz. However, if this is recommended by that article, then the problem has to be somewhere else.
1 Like