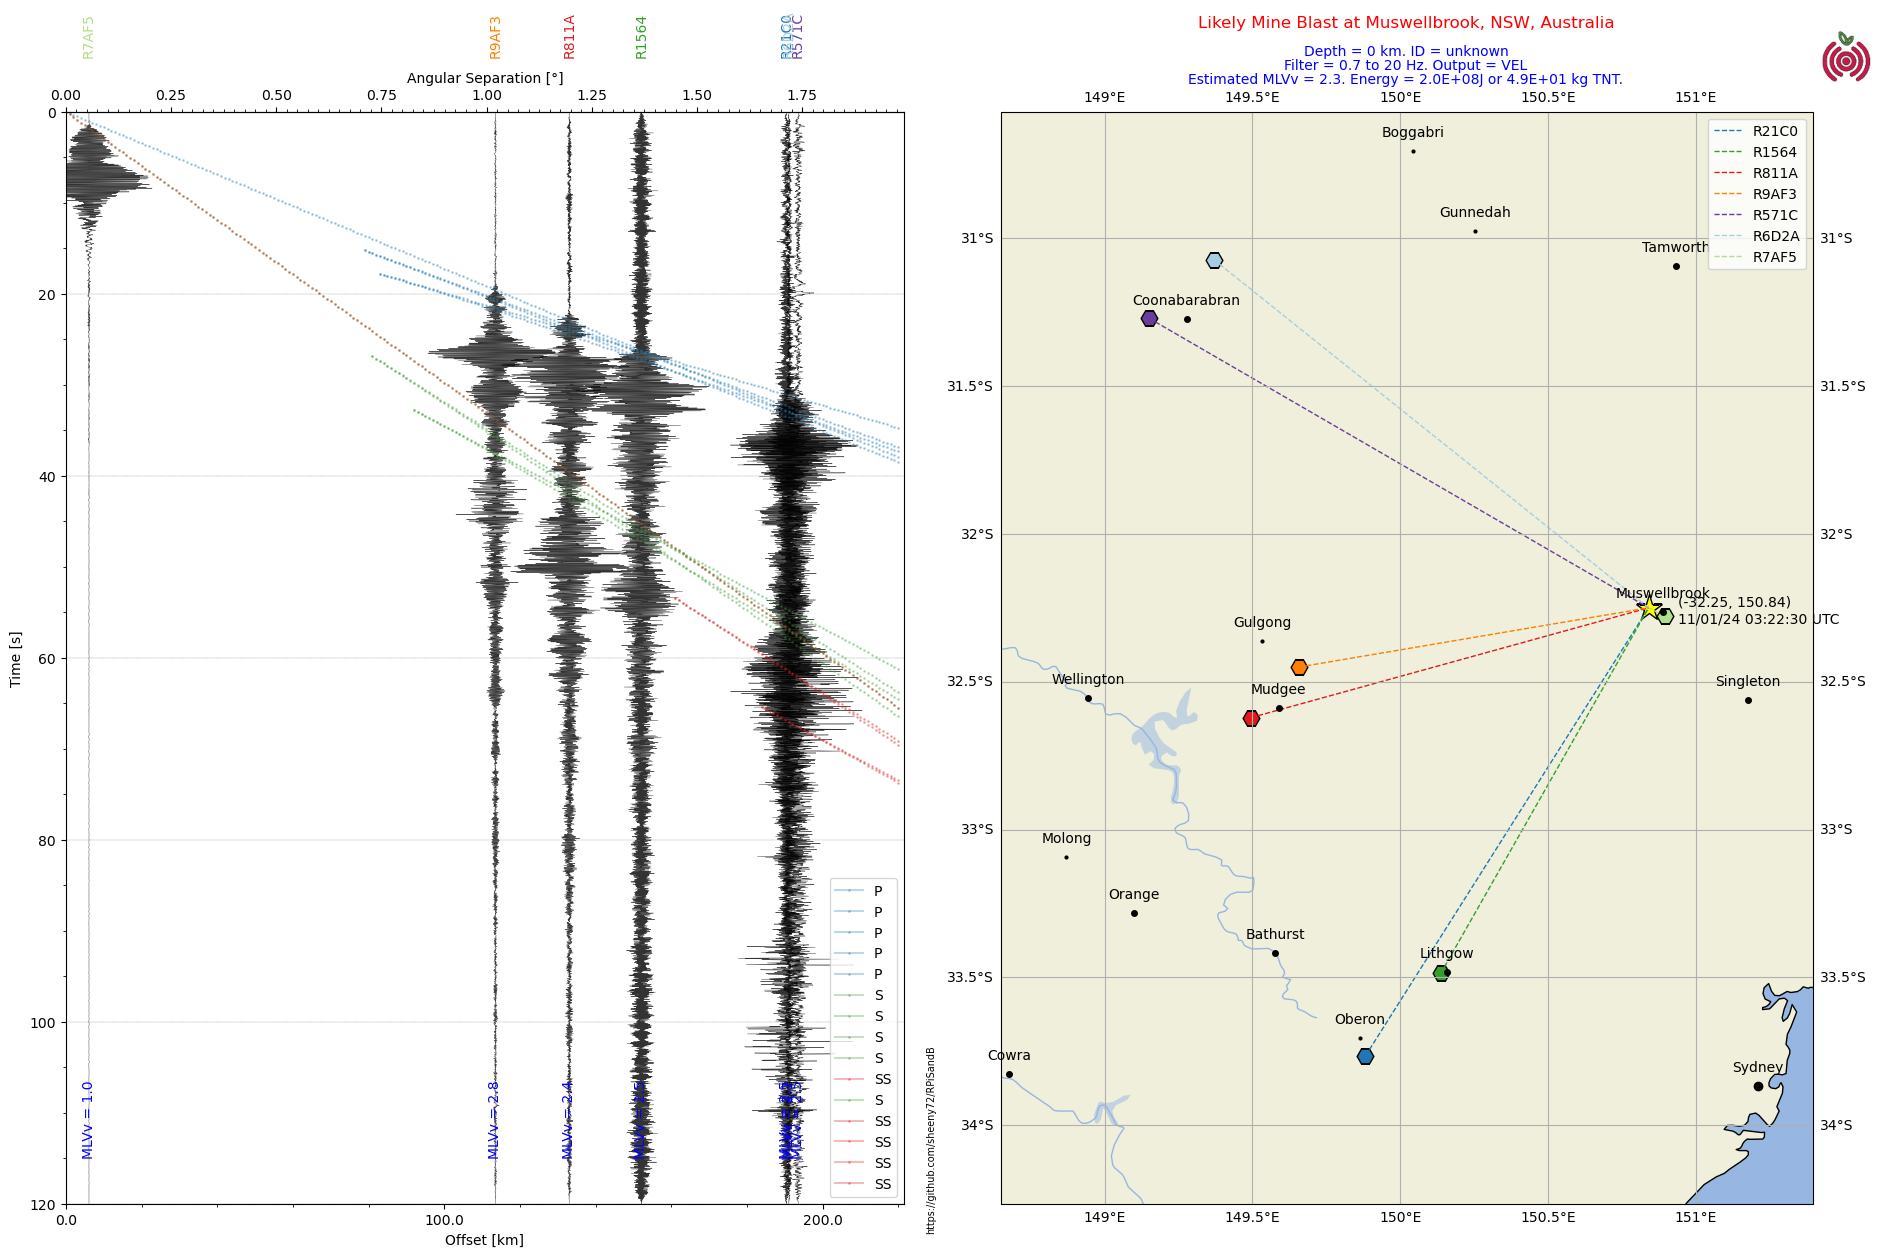
For a while now I’ve been using my Python section plot (LocalStns6.py) to chase both local unregistered quakes and mine blasts. I found a likely candidate on the helicorder this morning but nearly ignored it because it had a 10Hz line through it on the spectrogram.
I started trying to pin point it on the section plot by trial and error and nearly gave up as the signatures were a bit messy and it was proving more difficult than usual to pinpoint the source.
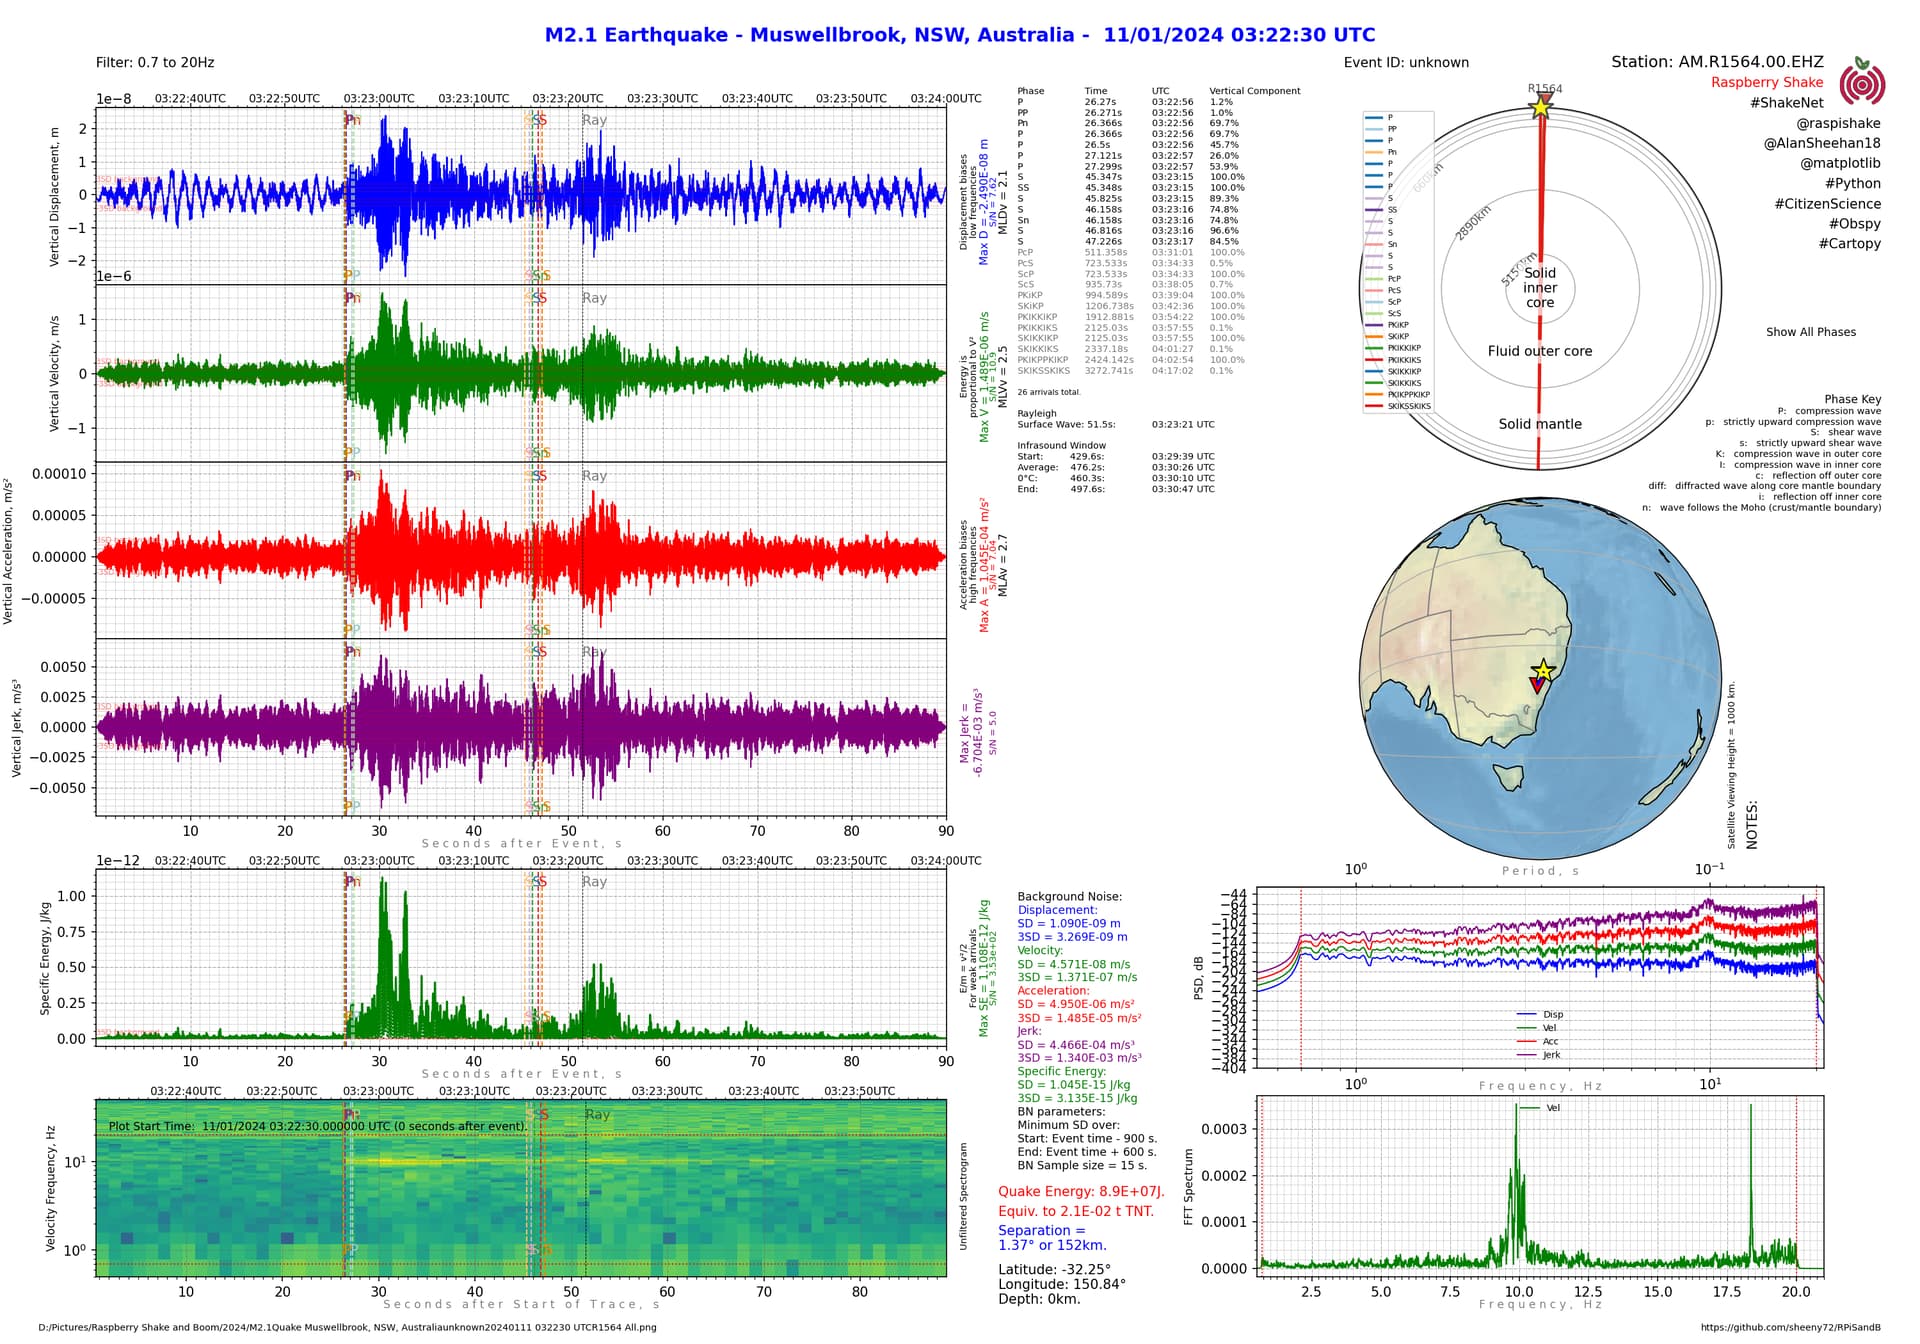
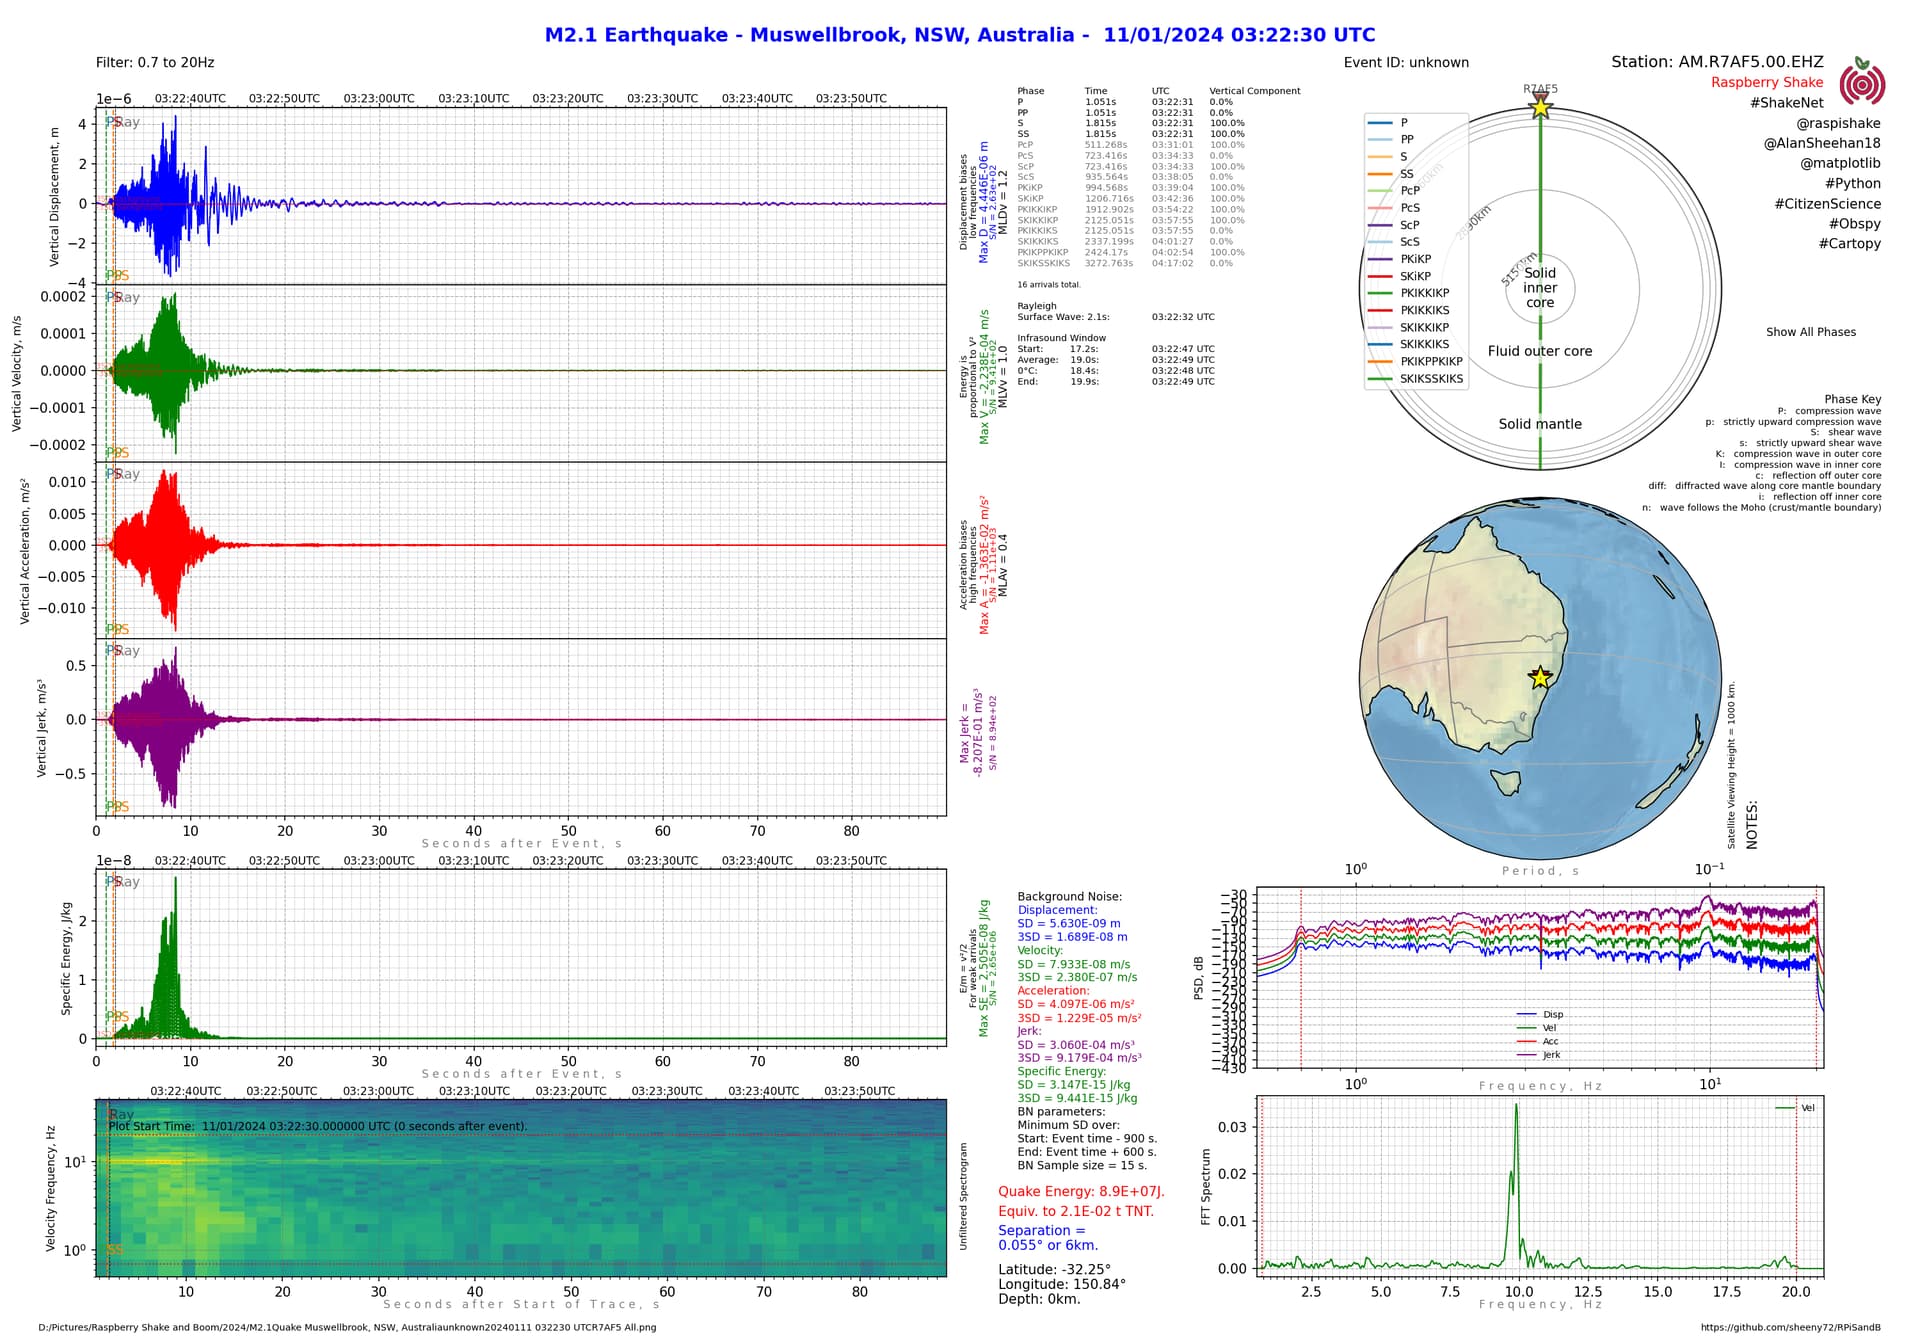
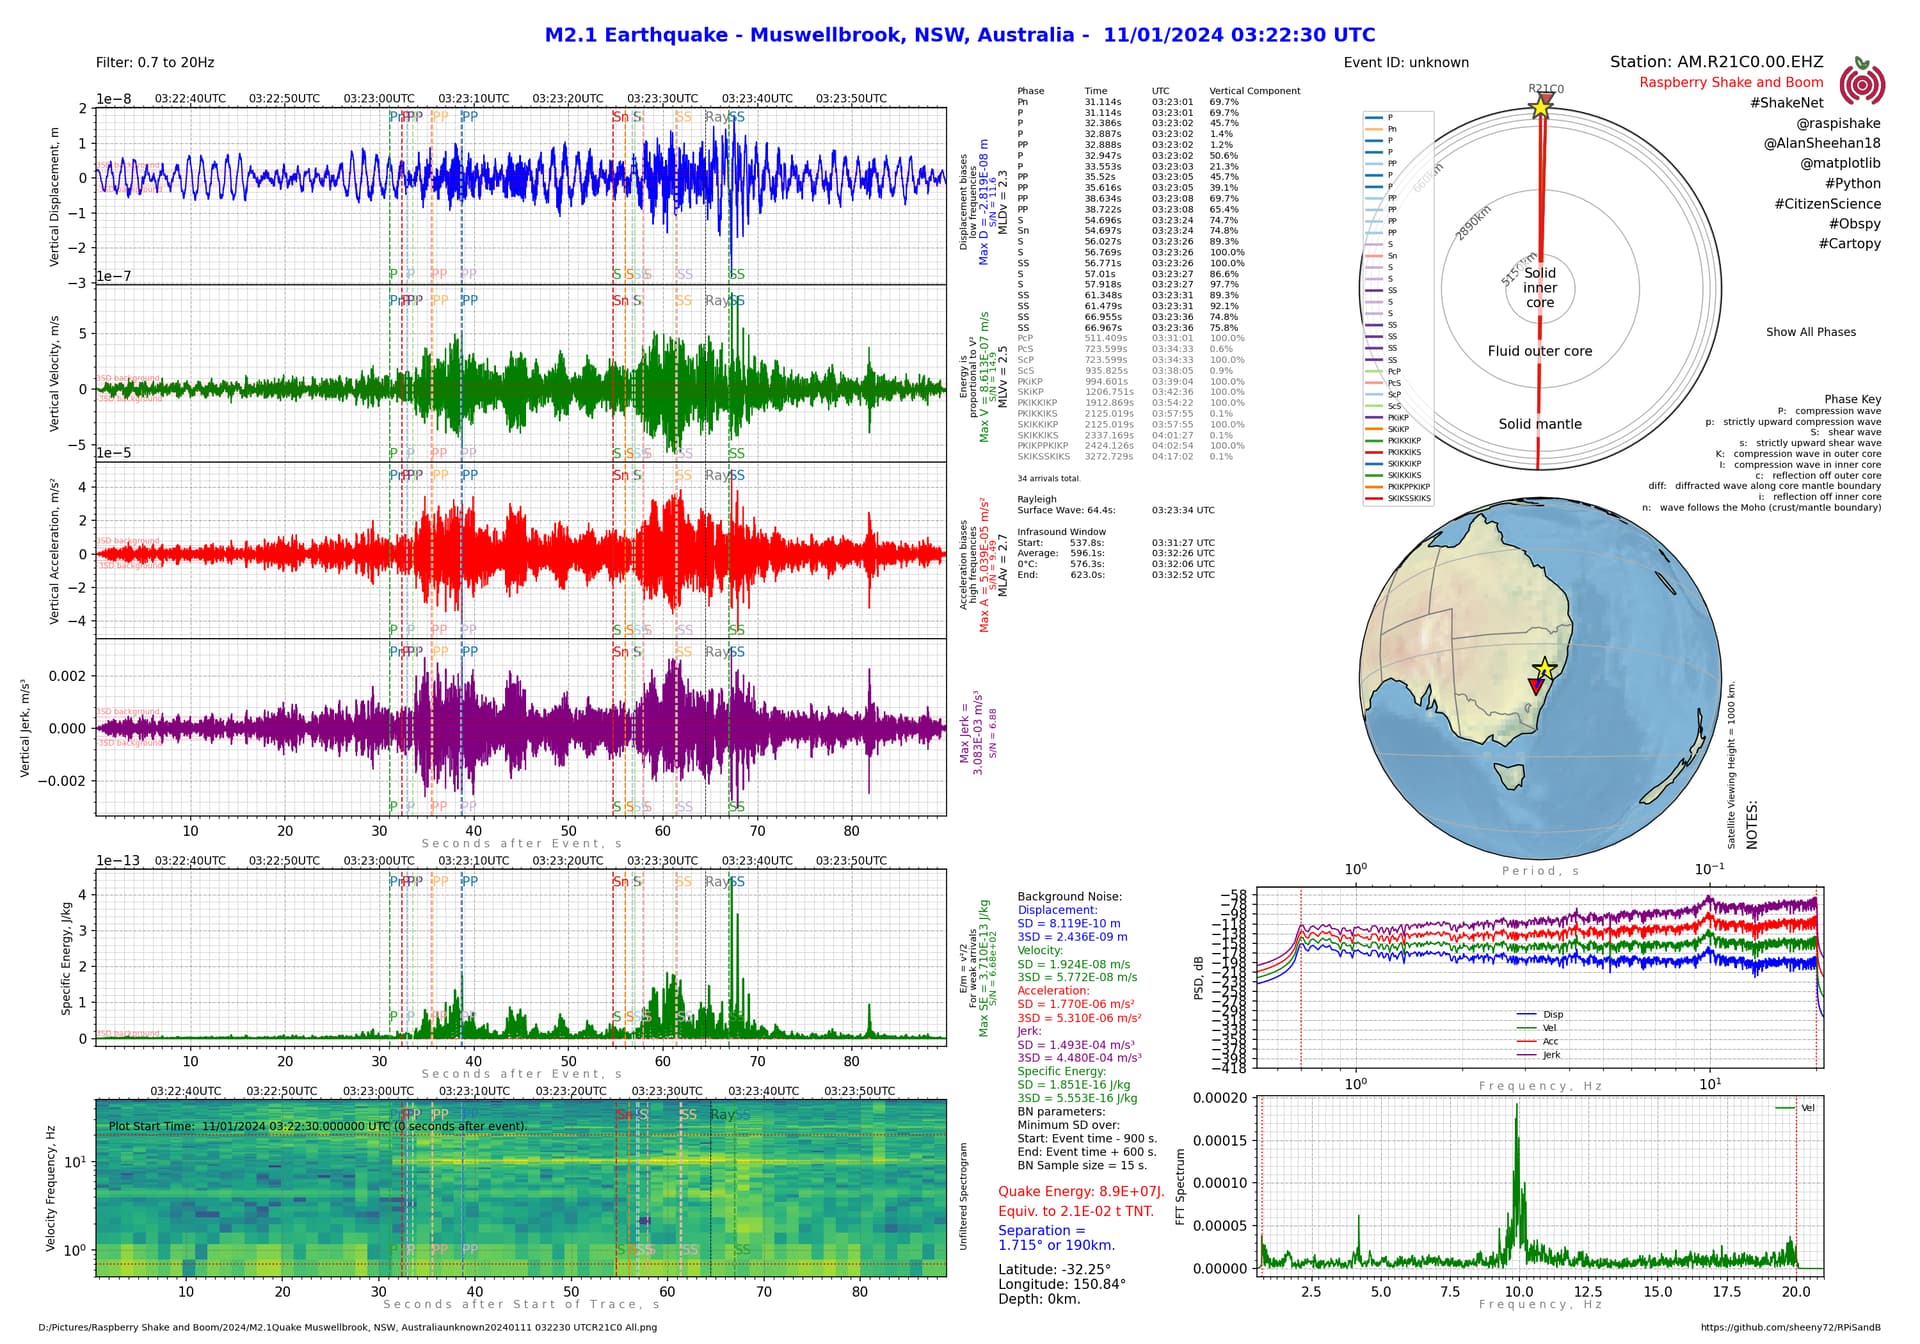
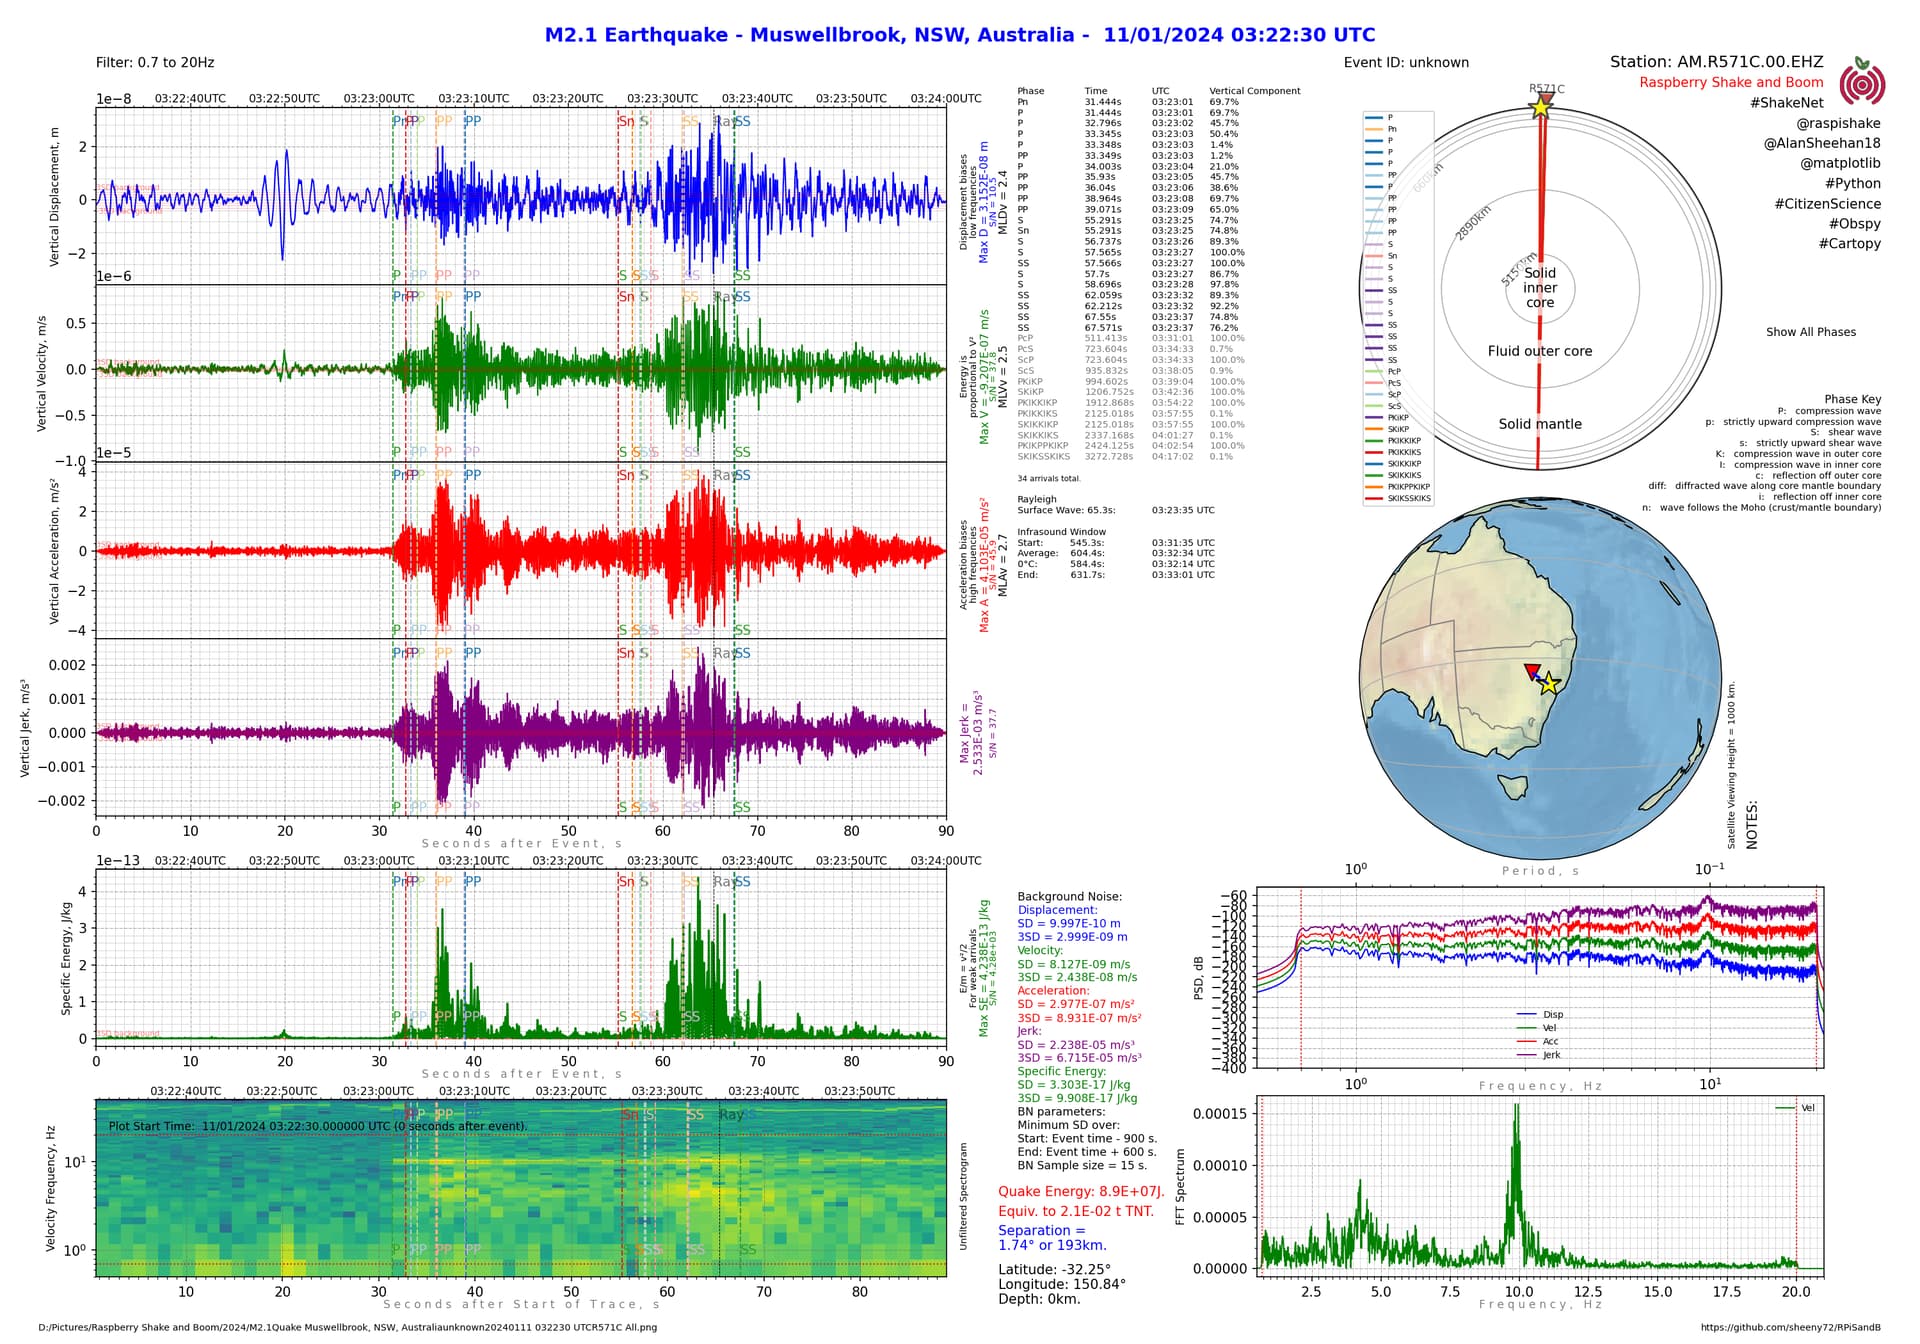
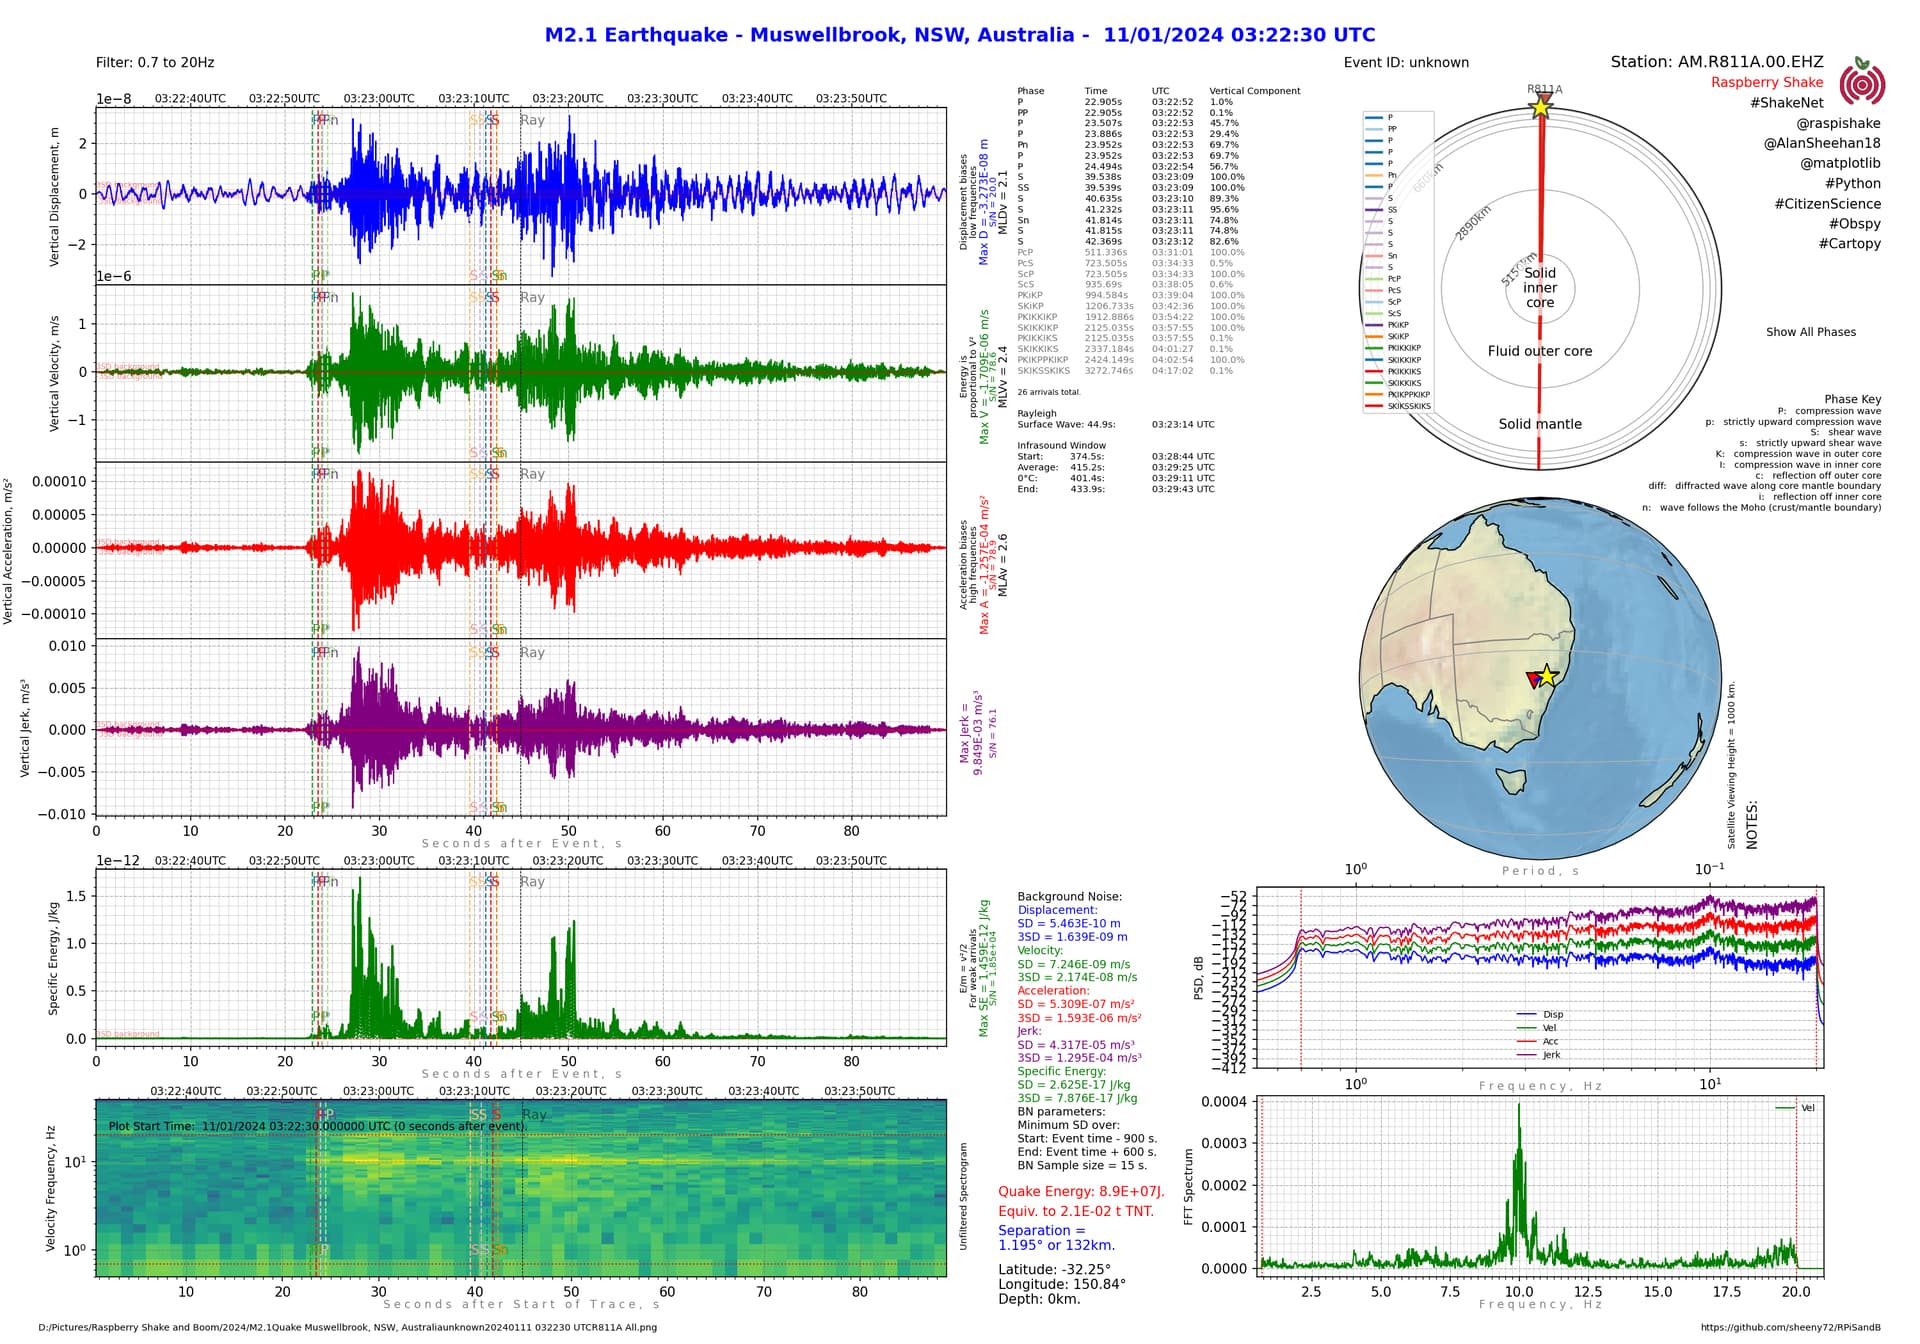
When I got close I thought I’d have a look at the spectrograms for all the stations and see if the 10Hz line was just noise on my station or part of the signature of the event. It shows up on all the stations so it is part of the event!
My best guess is that this is a 0.1s delay between individual detonations in the blast (giving a signature of 10Hz). It’s the first time I’ve noticed this in a mine blast, so I’m pretty pleased!
It’s cool what can be detected with a Shake!
In the individual station reports check the 10Hz line in the spectrograms and the peak at 10Hz in the FFT spectrum.